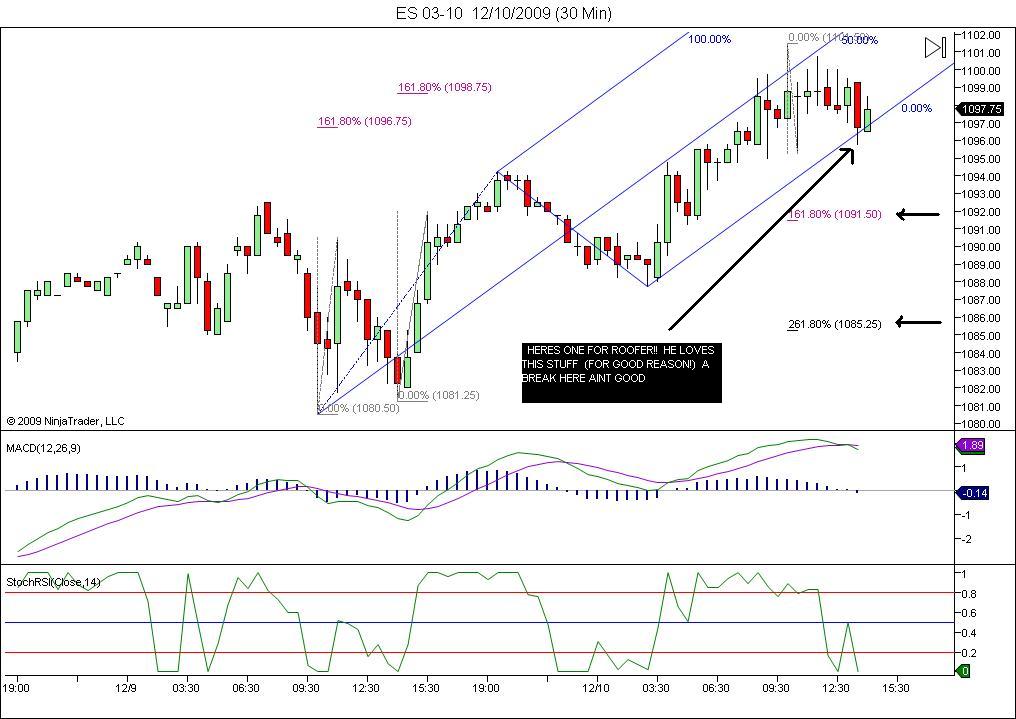
Hey Roofer!...
Click image for original size
Thank you Jim. I'm so far behind on automation. It still sounds stressful to me as I can't multi-task that way but it sounds like you have a good system going. In general how many areas do you need to see line up on the higher time frame before you drop down to a lower time frame from a PTA ? Do you have some sort of minimum or matrix with some methods given more precedence ?
Bruce
Bruce
Bruce,
I'm looking for a basic setup on all issues, any timeframe, as long as it is liquid. The setup is made up of three disparate techniques, and I'm looking for all three to tell me the same thing at the same time, to create a synergy. The three legs to the stool, so to speak, are pattern (always an ABCD of some kind, of which I have identified nine variations I use, which are no harder for me to see and identify than identifying nine relatives or friends on sight), line (from some type of a median line set, using unique variations and techniques I developed), and Fib. Many ask which Fibs, since for example I am watching about twenty, many of which I quantified myself. I tell my students once you learn a bit about my methodology you will see that's a non-question. I am looking for a Fib to hit into the area that I am already looking at. If one does, I consider that adding to the potential synergy. If not, I move on. I don't care if I have a thousand Fibs, one either does or doesn't hit into the synergy area. This takes me less that one second to determine.
Intraday in the ES, for example, I use IB and POC, VAH and VAL, as well as daily pivot and a few other things, to see if they fall into my areas from the above techniques. If they do, I count that as additional confirmation for my synergy. If not, I don't count it as a negative, I just see those traders will not be assisting my potential trade area. I'm just looking for synergies.
So, to answer your question, I have a predefined area which is fairly narrow by my standards. I will look to trade it if it is hit and gives me an entry trigger, as I essentially never 'fade' an entry. I need a fair amount of confirmation that the area is 'seen'. Then I drop down so I can get a finer look at the price action. I am very big on price action reading. If I get a trigger like I want, that's that. If not, I move on.
I'm not sure, Bruce, if that answered your question fully. Let's say I see a pattern, the starting point in just about every case for me. This pattern has a designated completion spot, by it's very nature. I look to see if line work and Fib work hit that same spot. If they do, I have a possible synergy and I get ready to look for an entry trigger. If not, I move on. I find that most patterns do have a synergy. Understand that this is a very simplified overview of what I am looking for, but gives everyone the basic concepts.
i watch the same small group .i have a set of predefined trade triggers.i can scan all index etf's in less than minute.re jim's ABCD'S..i have done the grunt work for myself to know the odds on each.the one that stands out is this... when kane abcd completes at .382, then 87% of time, based on thousands of recorded samples,price will take out high of pattern.at the july 10th low,i pounded the table for an all in long position in the face of much negativity. how could i do it?because i had done the grunt work to expand my scan on the dailies to hundreds of stocks... at the july low there were dozens and dozens of stocks sitting on kane abcd's completeing at .382...while all the indexes were at key medianline support levels.
i try to let jim do all the talking on his patterns...but there is a mind numbingly simple answer to the legitimate question'' what is the number one way you know one of your trade setups has lost its edge?''answer... if THE VERY FIRST THING that happens after entry is that a kane abcd sets up against the trade.
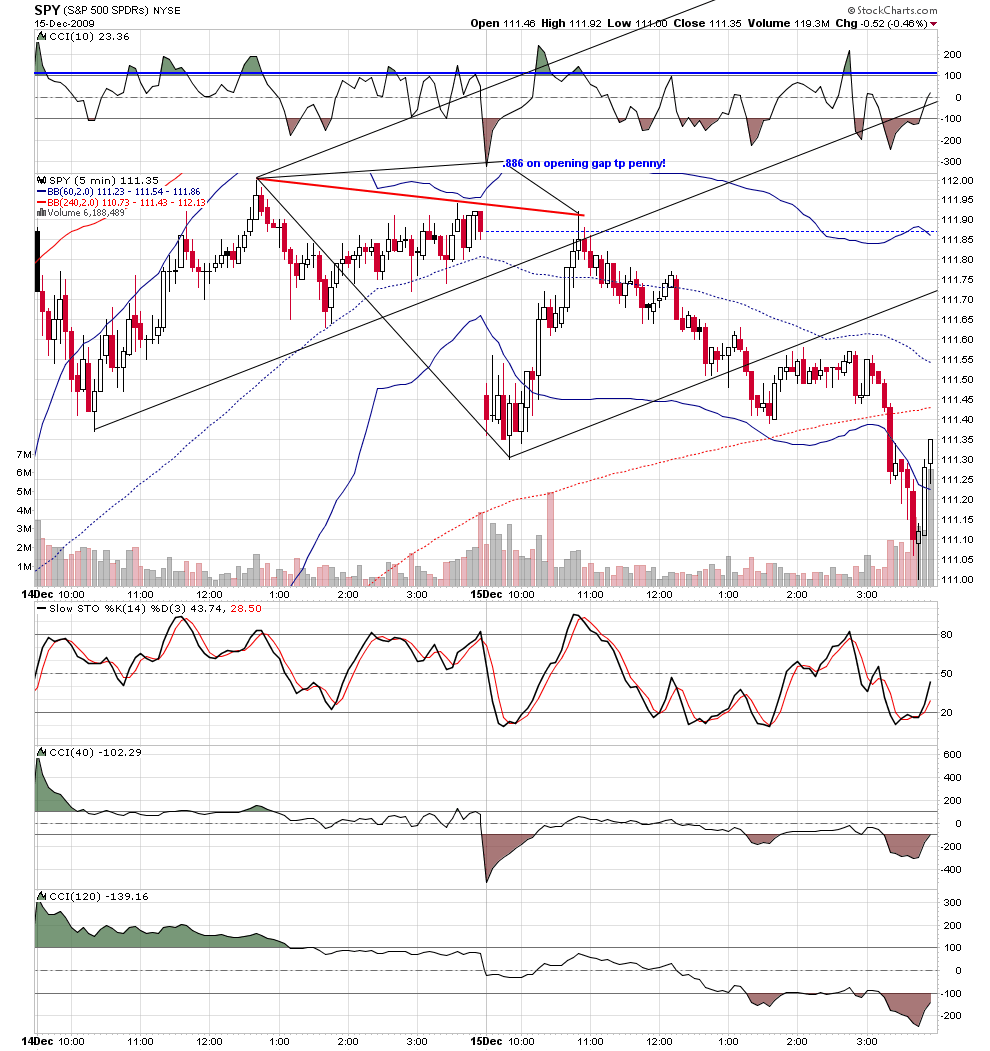
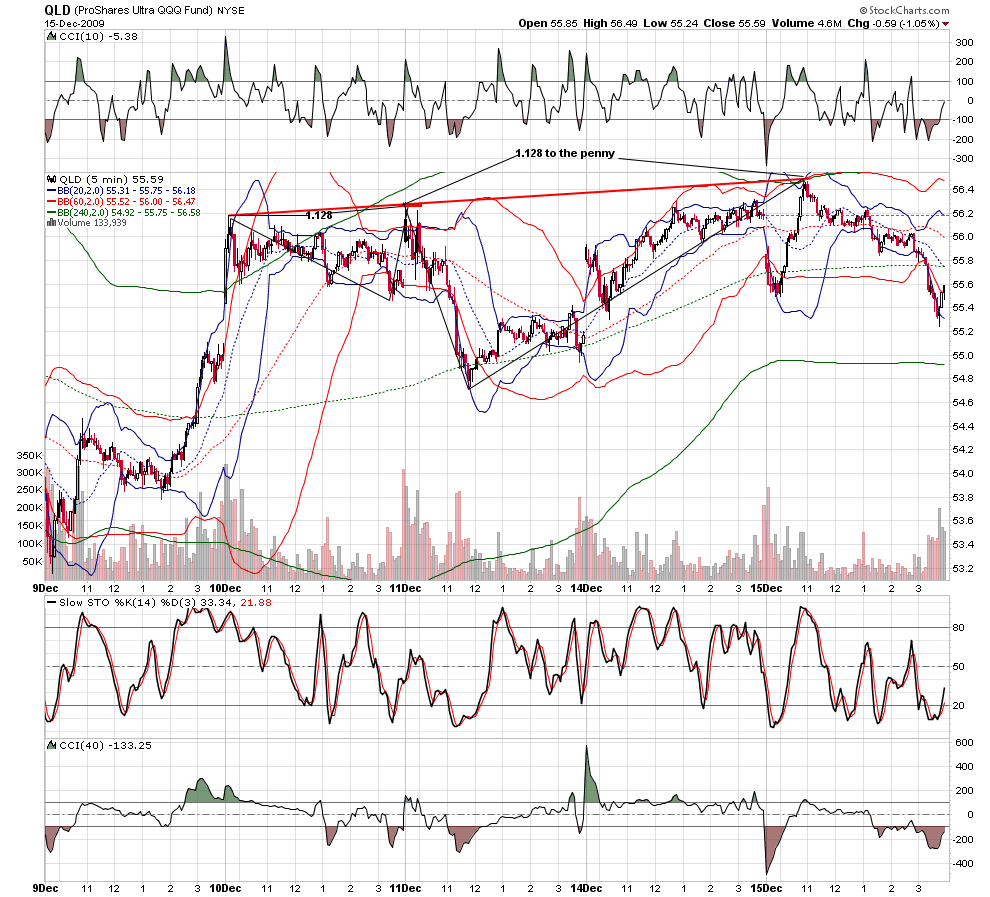
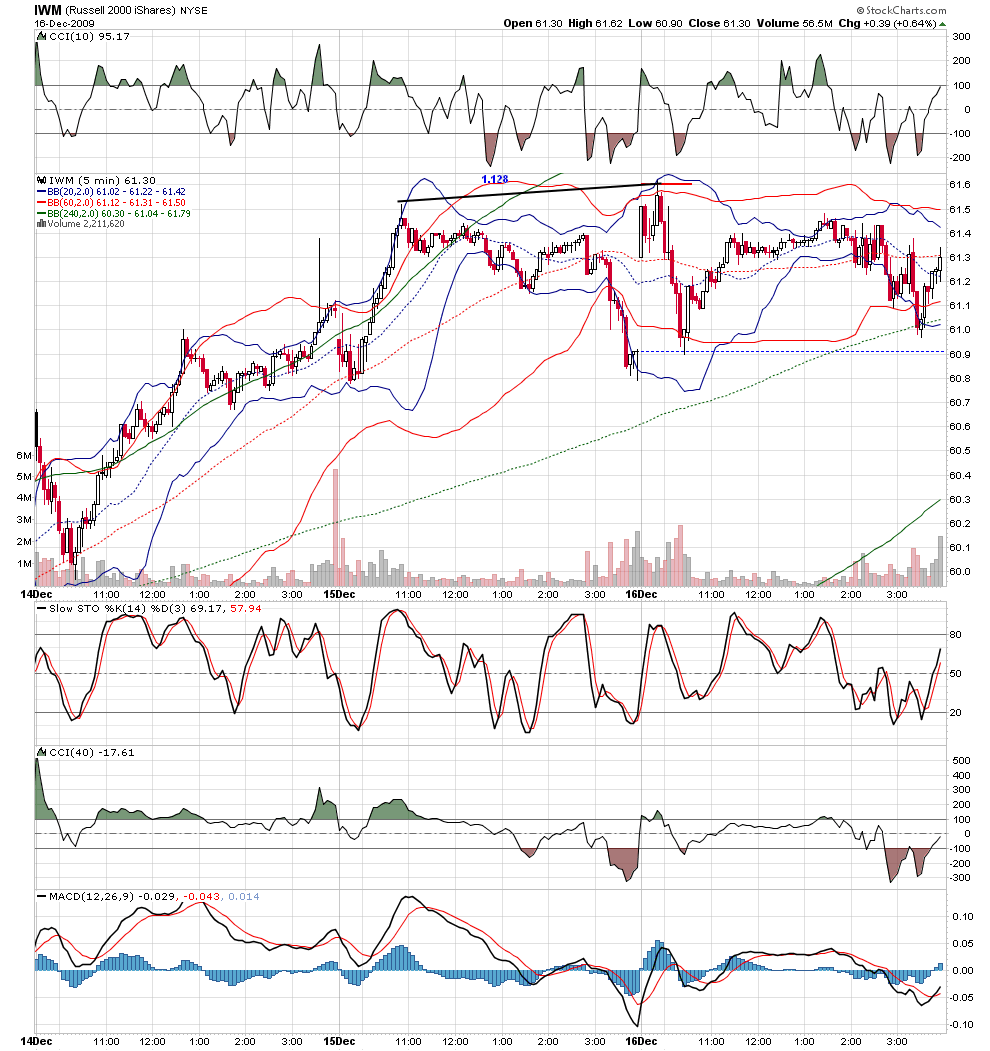
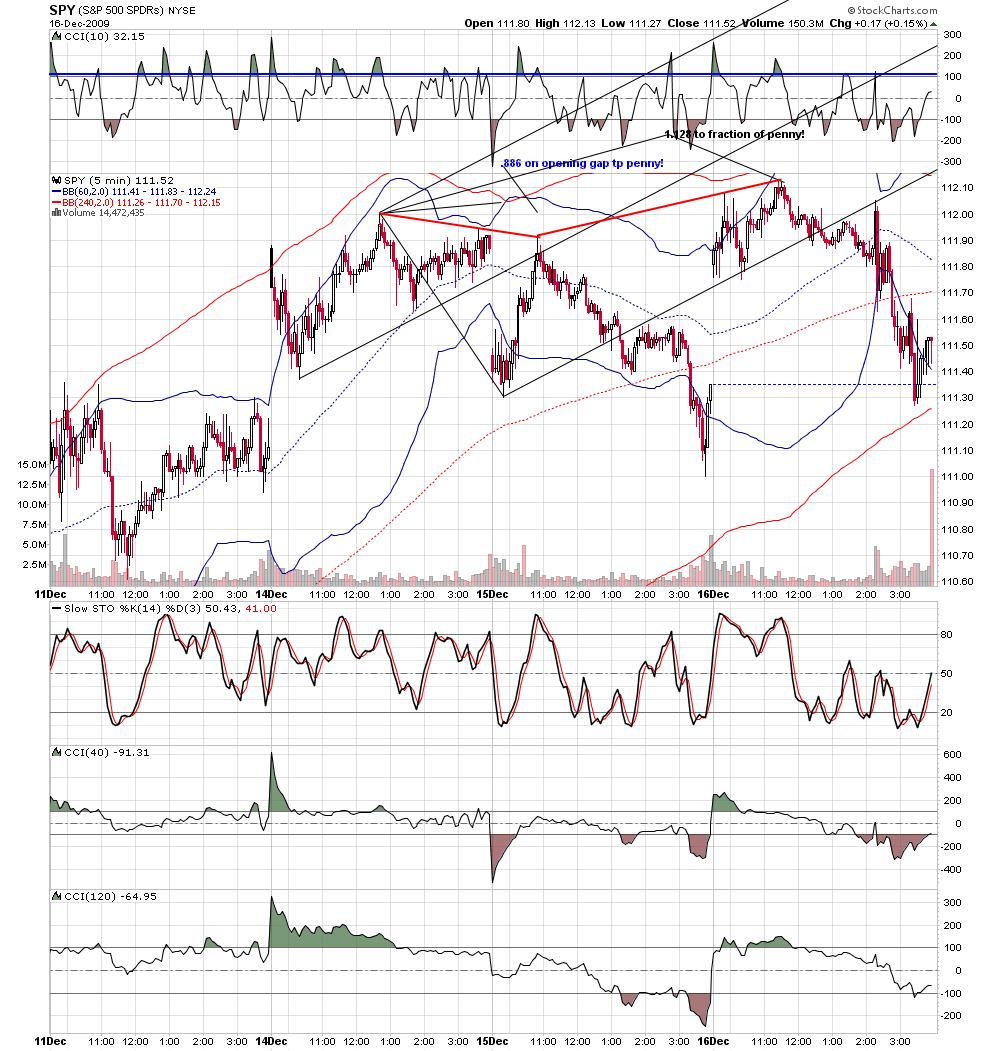
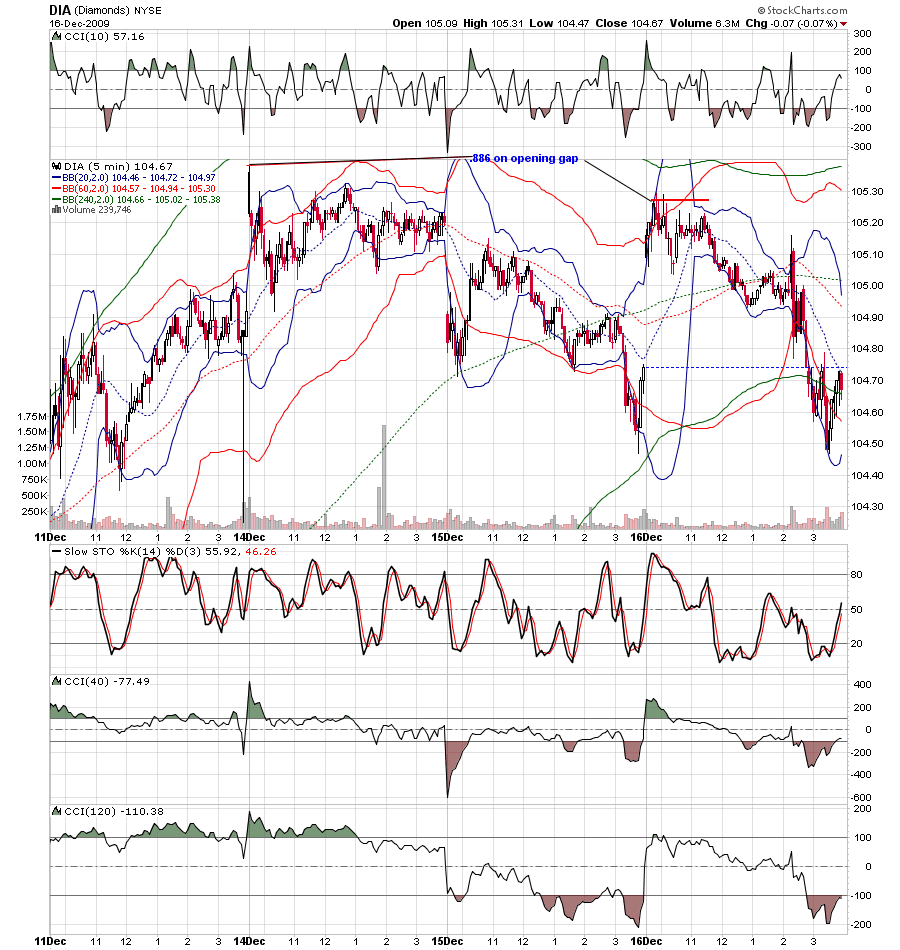
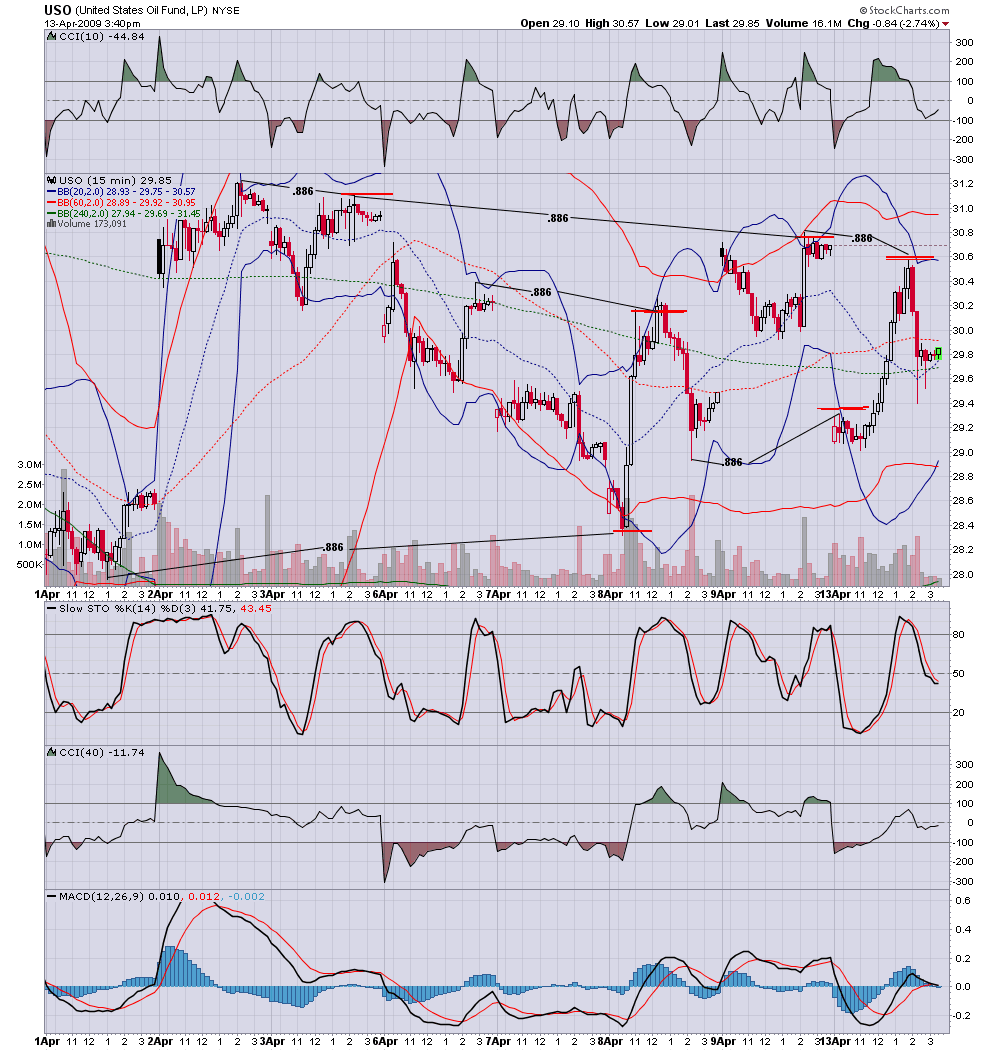
jim and i can pound the table until we pass out about the importance of the .886/1.128... i have pounded the table for three and a half years about the computers keying on the .886 on opening gap days... and for almost a yr i have been posting about the qualitative of fib that is sorted by a line connecting 3 pivots....i hope at least one trader took advantage of the time i spent showing the previous charts....
Click image for original size
Click image for original size
i have said what i look for.... even now it is remarkable how the computers will hit the numbers again and again....
Click image for original size
Click image for original size
Click image for original size
Click image for original size

thanks to you both for expanding on this...
Bruce
Bruce
Click image for original size
Click image for original size
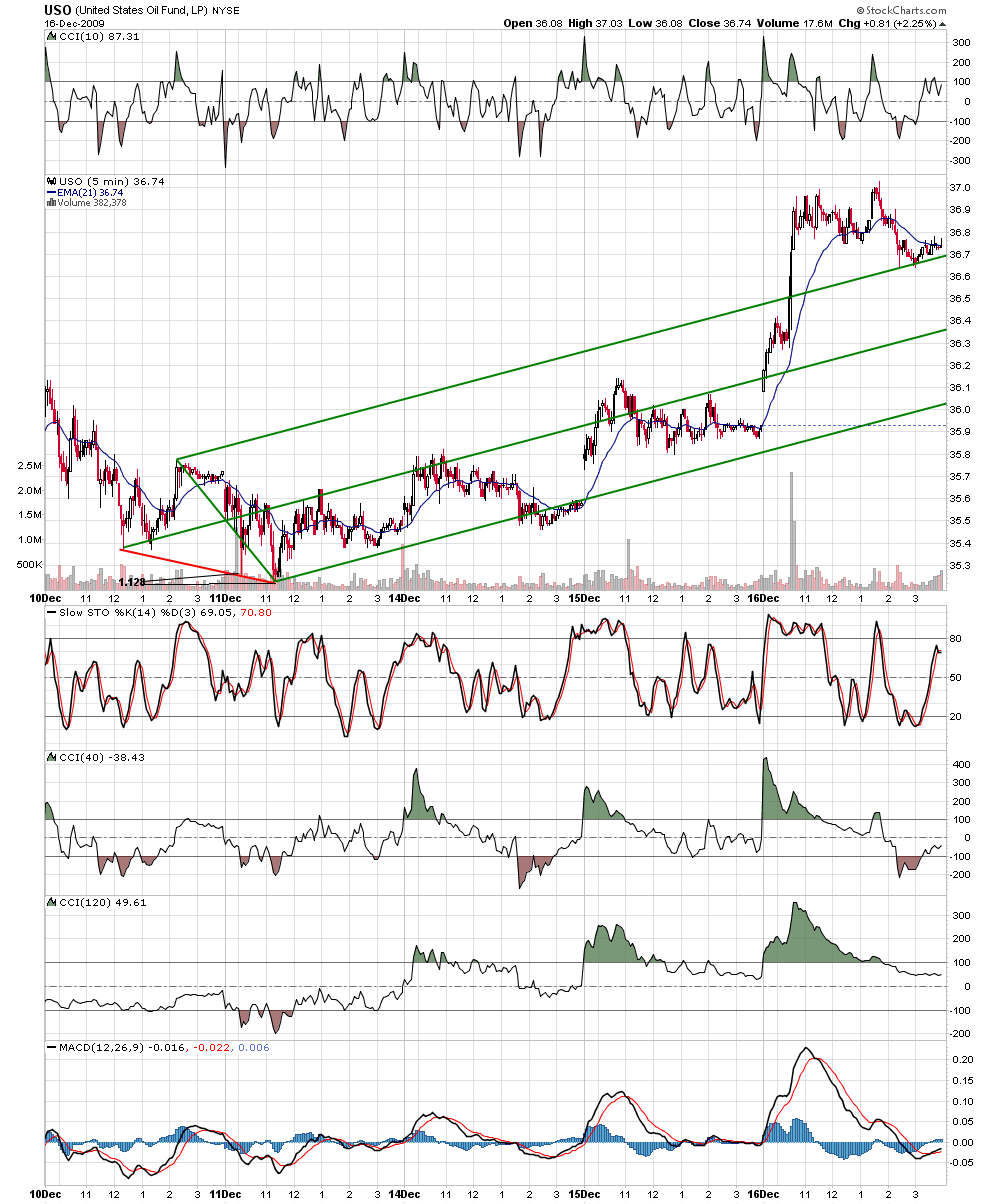
the computers dont care about what market they are playing in... over time,the USO is one of their favorites....i will end with this post.... ktk
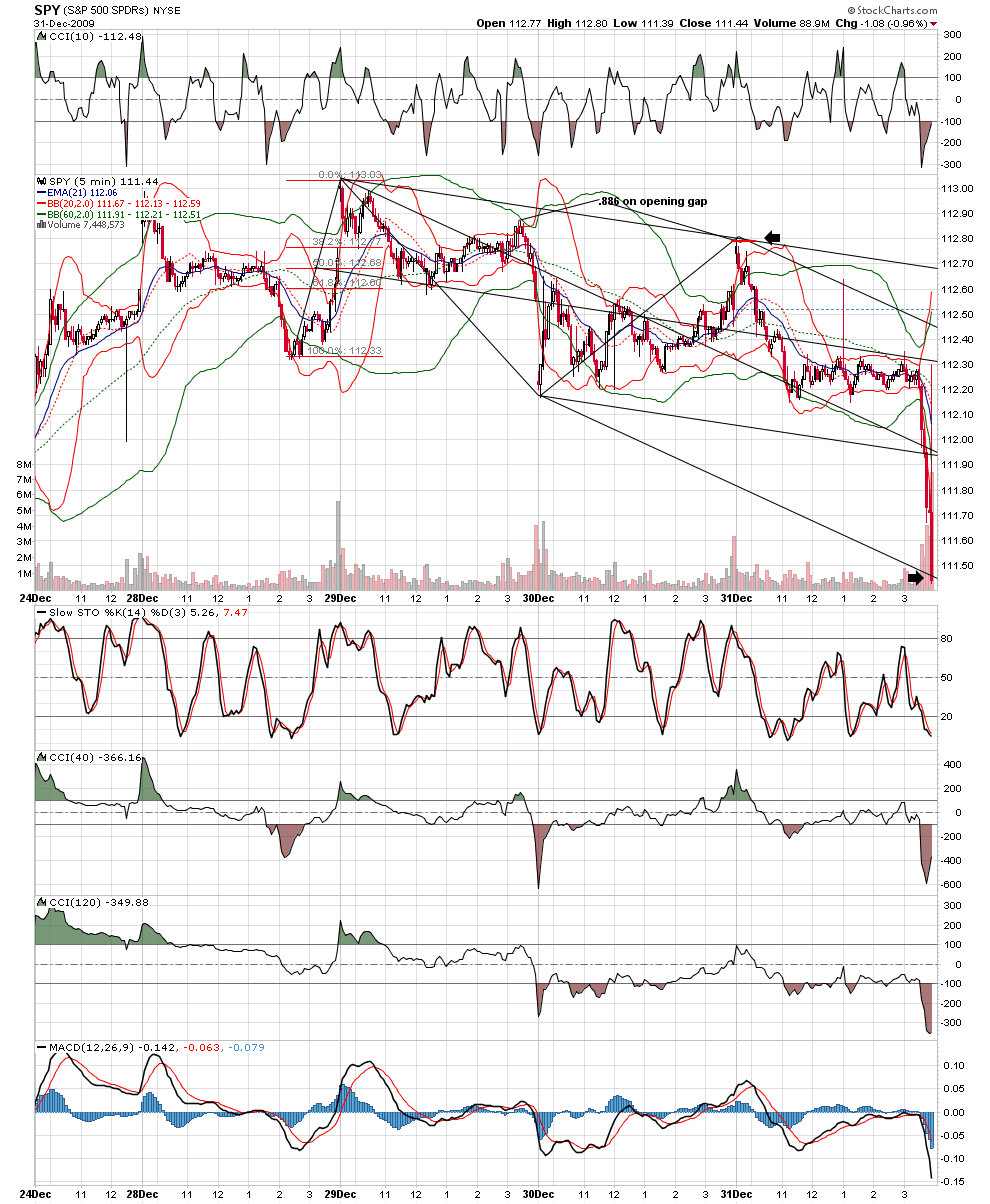
quietly, without fanfare, the computers end the year playing the same game....,886 on opening gap
Click image for original size
Emini Day Trading /
Daily Notes /
Forecast /
Economic Events /
Search /
Terms and Conditions /
Disclaimer /
Books /
Online Books /
Site Map /
Contact /
Privacy Policy /
Links /
About /
Day Trading Forum /
Investment Calculators /
Pivot Point Calculator /
Market Profile Generator /
Fibonacci Calculator /
Mailing List /
Advertise Here /
Articles /
Financial Terms /
Brokers /
Software /
Holidays /
Stock Split Calendar /
Mortgage Calculator /
Donate
Copyright © 2004-2023, MyPivots. All rights reserved.
Copyright © 2004-2023, MyPivots. All rights reserved.