Hey Roofer!...
Click image for original size
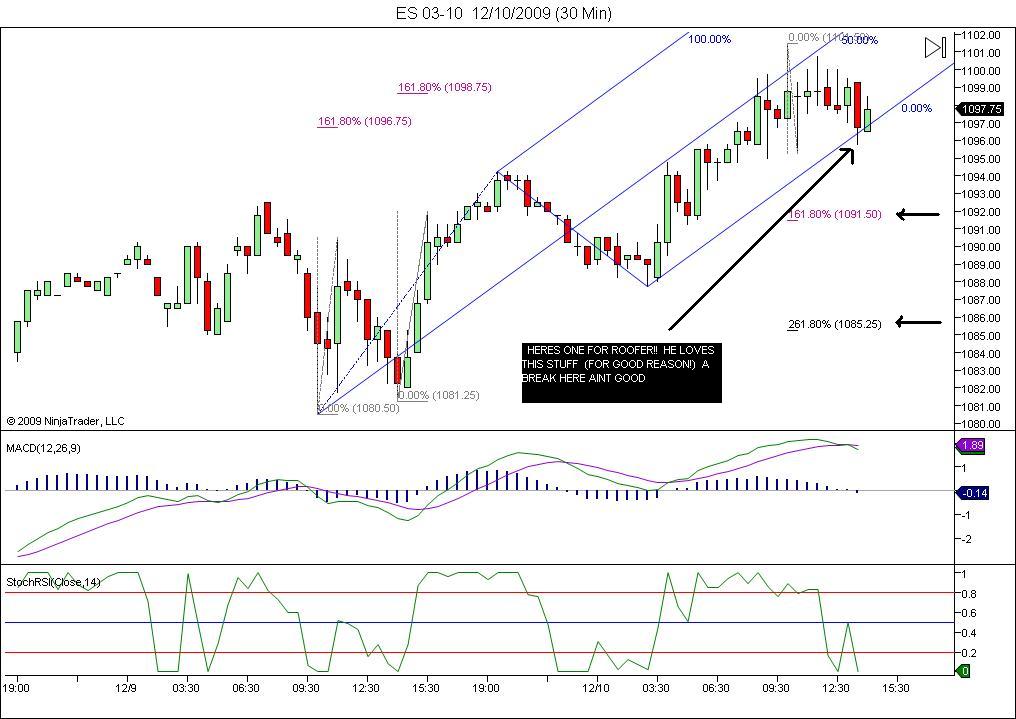
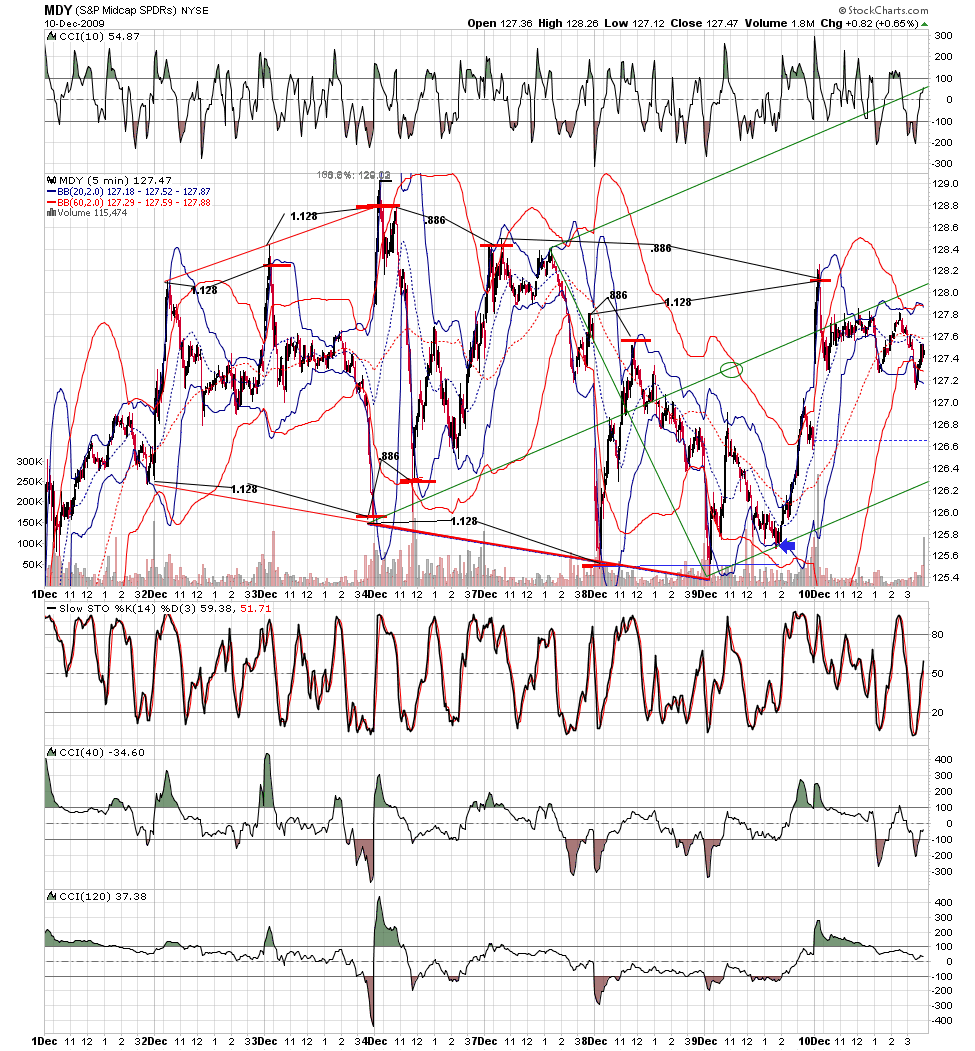
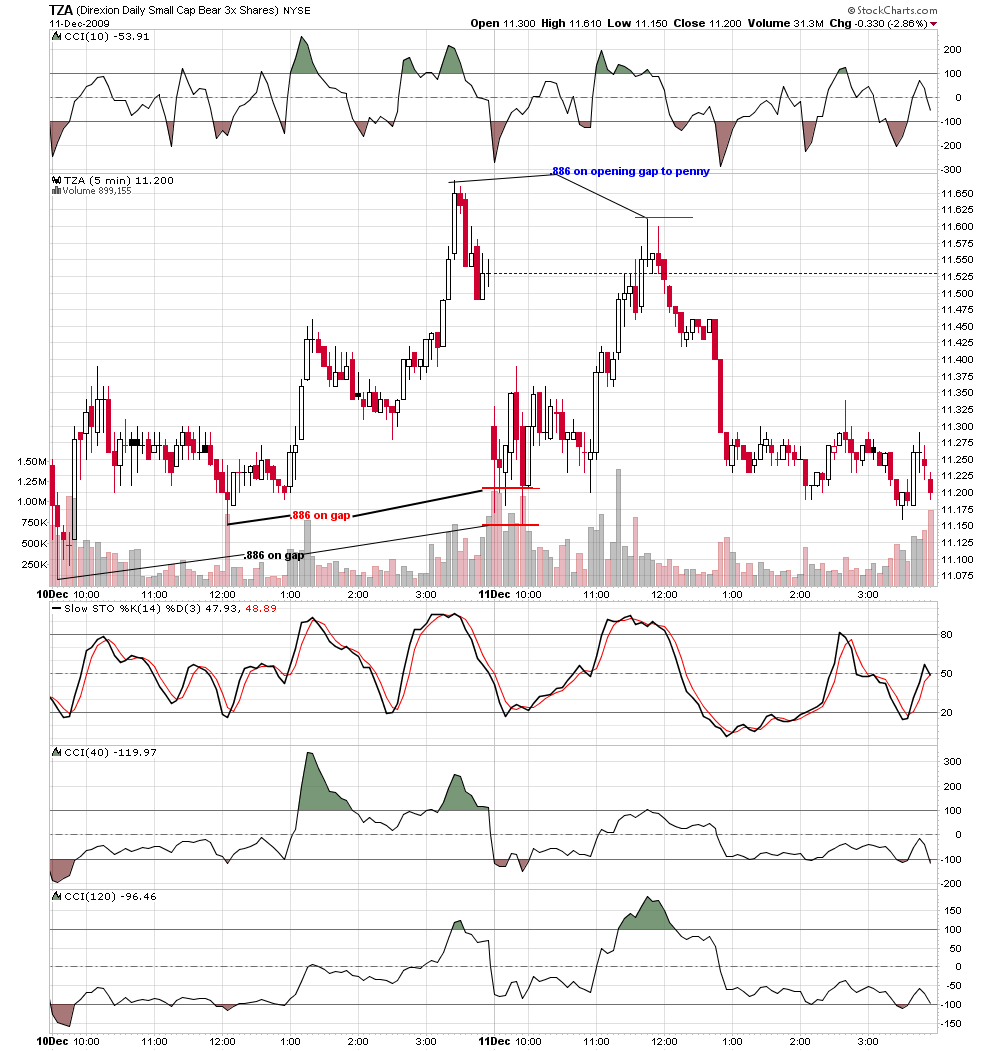
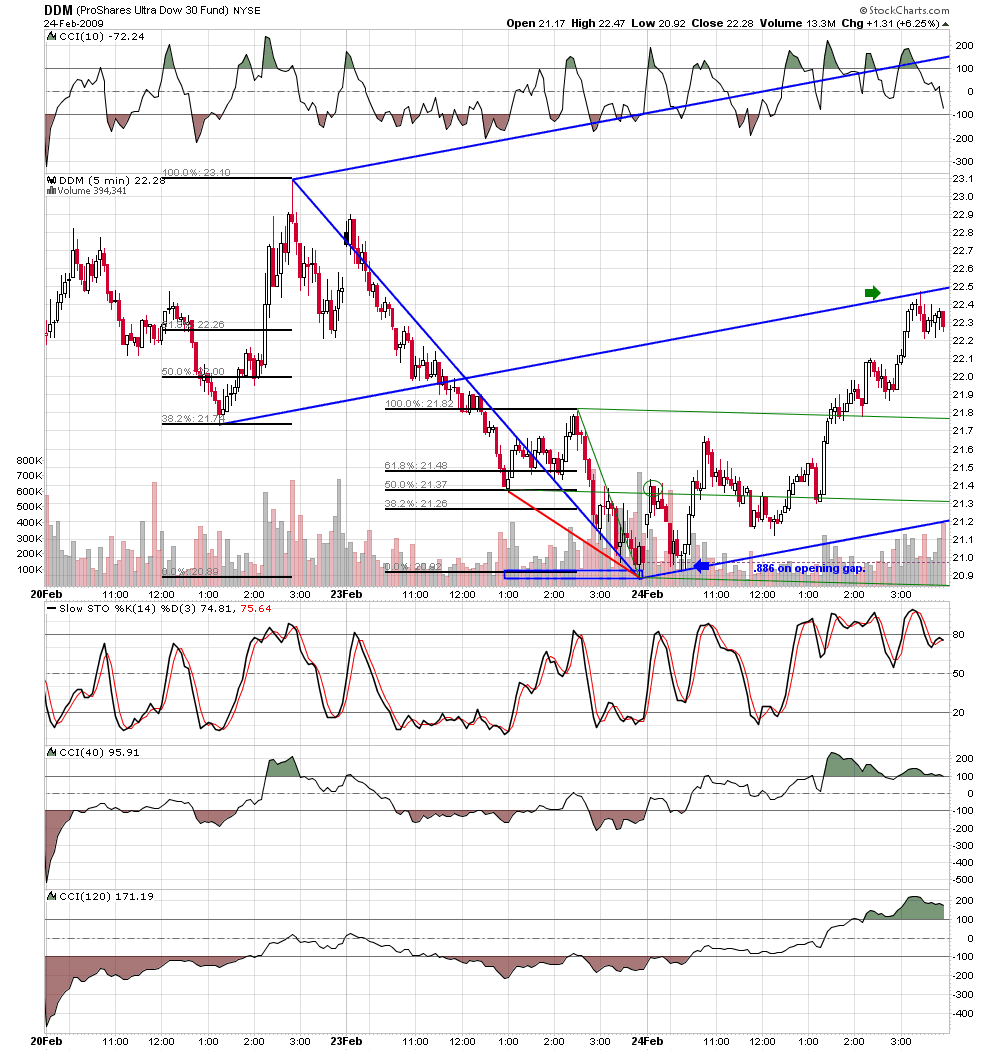
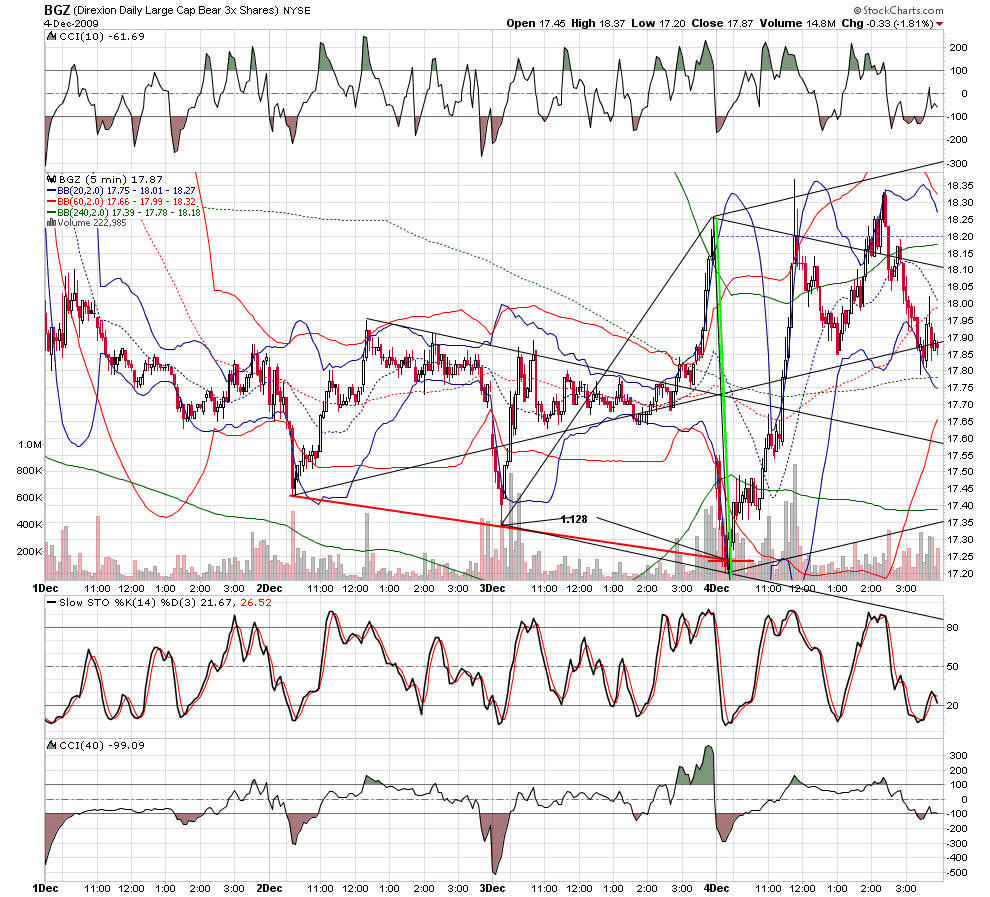
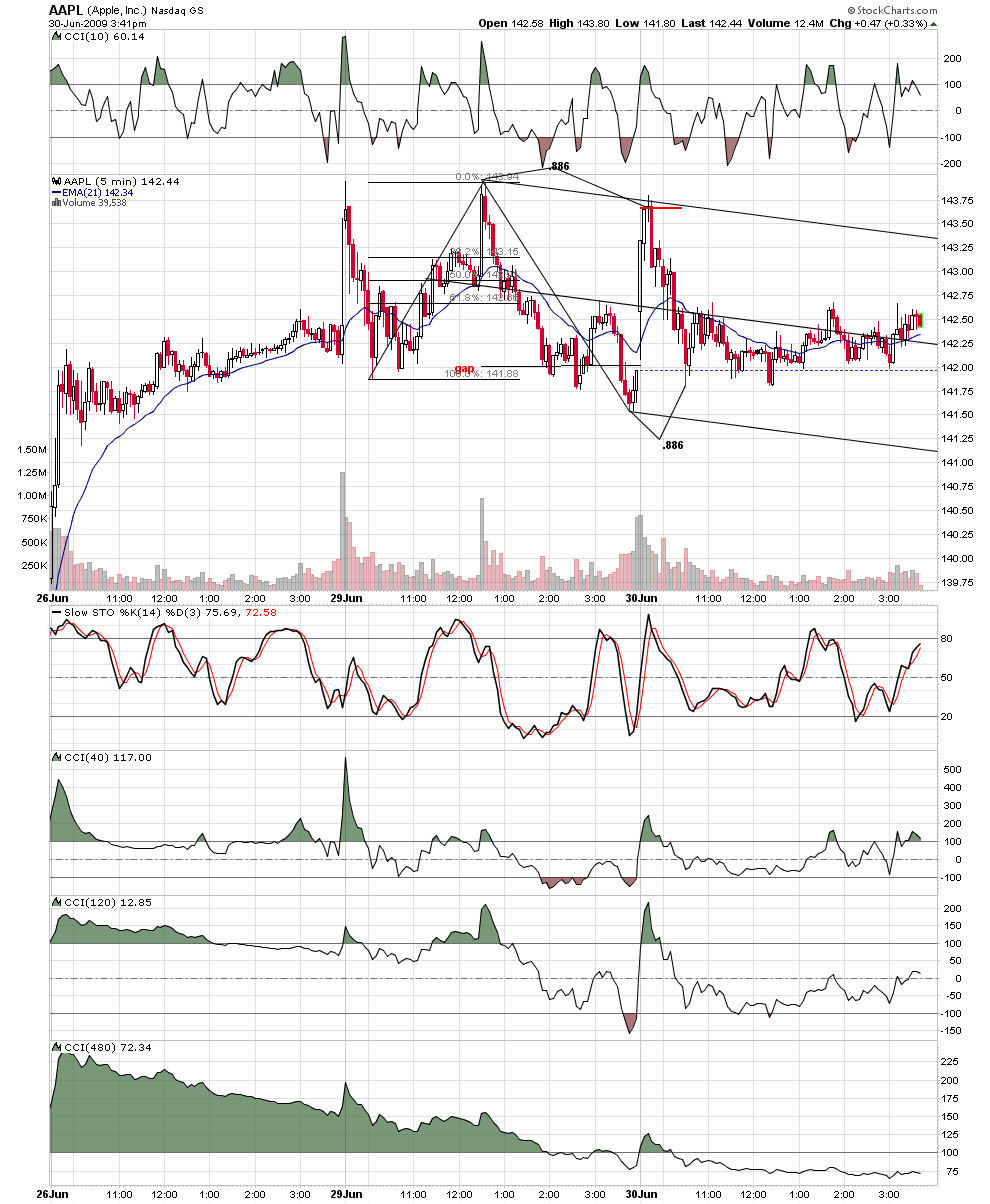
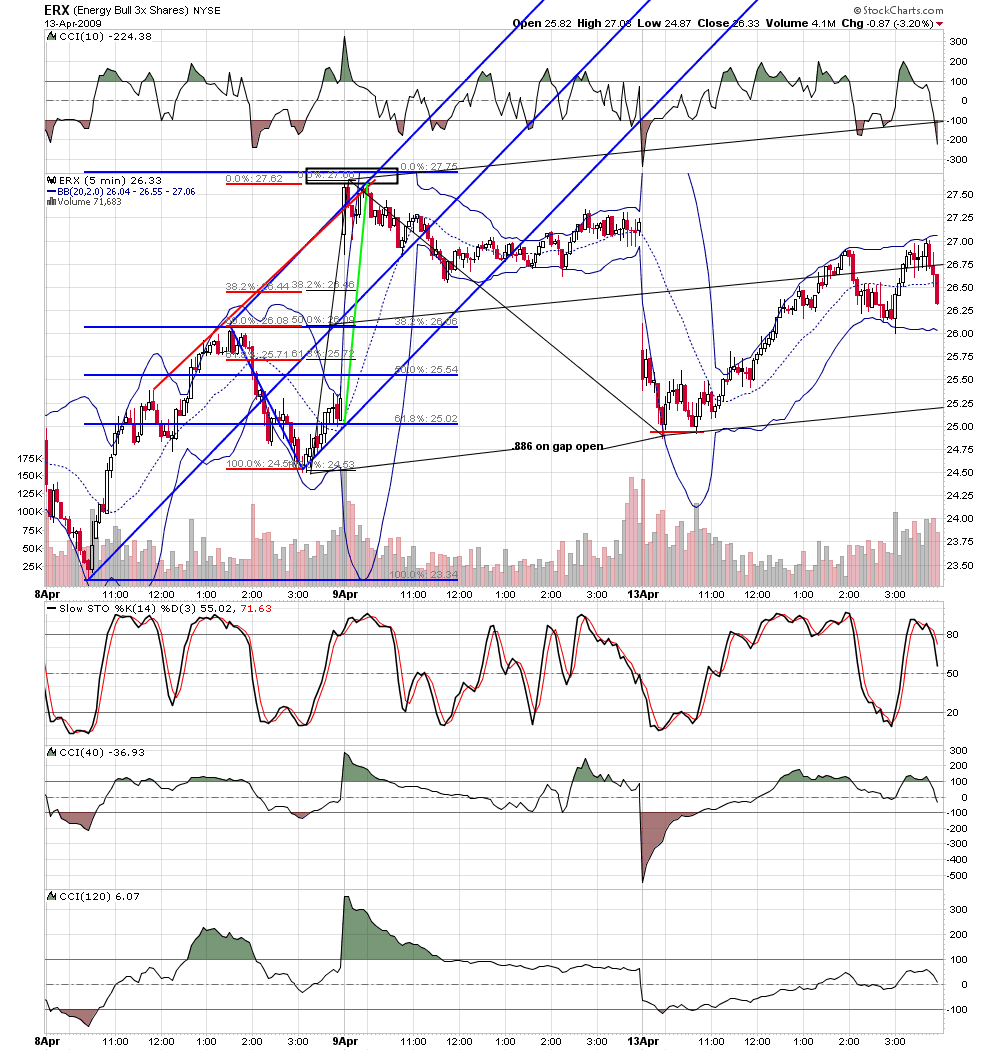
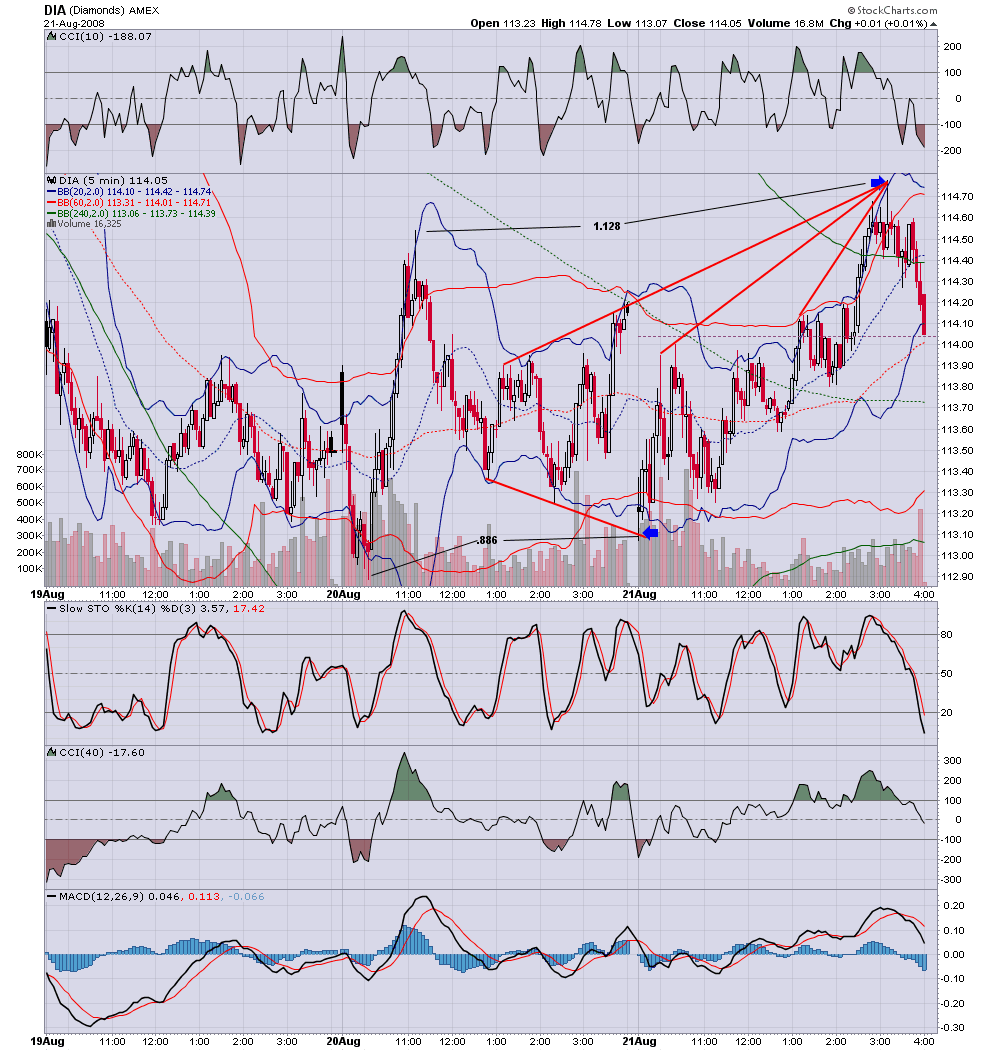
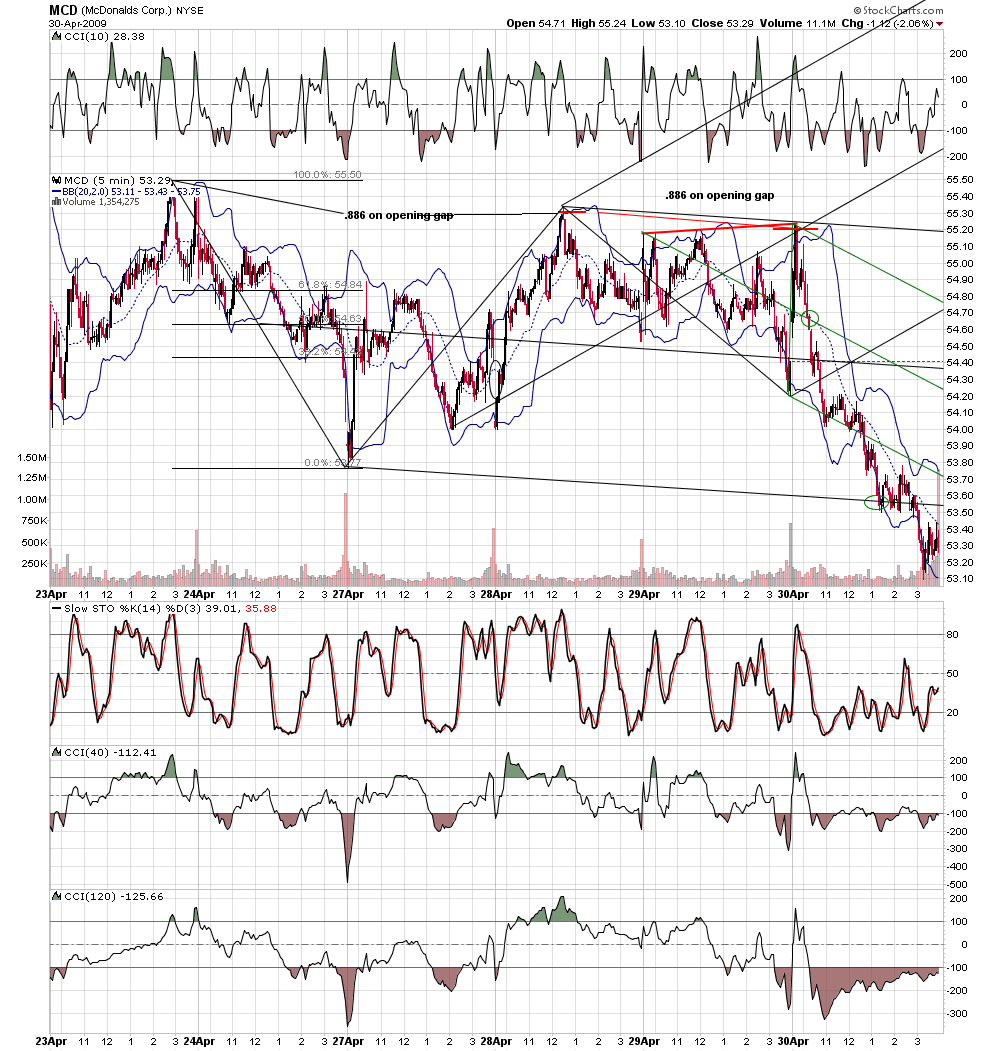
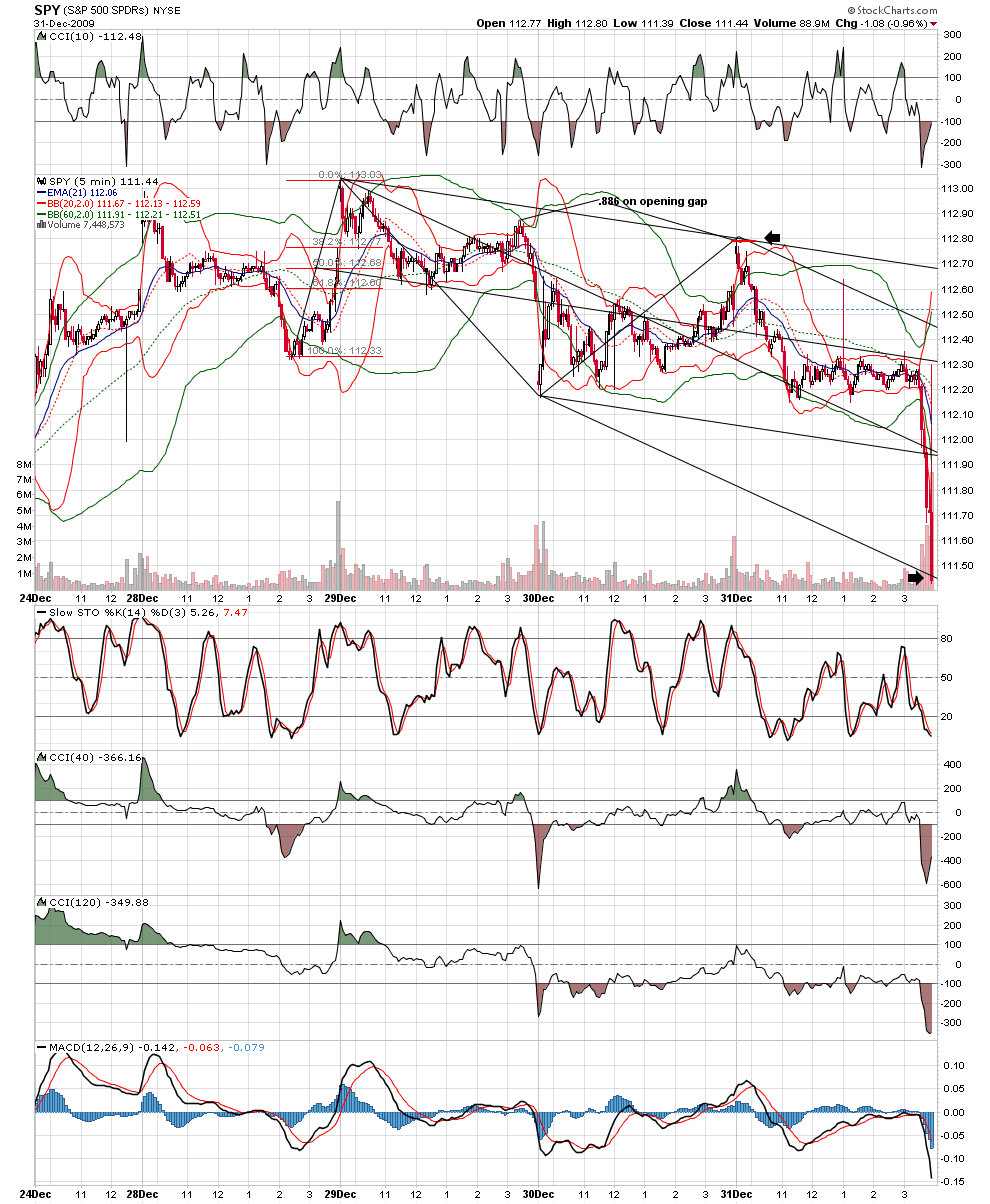
december is the numbers traders month....many big traders are done for the year and those that are left are often leaving the snp alone and trading the numbers in other indexes and etf's... it is remarkable that most famous fib writers do not even mention the .886 and 1.128 as fib numbers... jim kane on the other hand pounds the table for their importance in his written work....for three and a half years i have been pounding the table for my own idea... the computers focus on .886's on days that open on gap....my charts from last week.... i have included another setup i learned from long ago from dr war when he was a member of an early morge forum that set up in GS this week....
Click image for original size
Click image for original size
Click image for original size
Click image for original size

Click image for original size
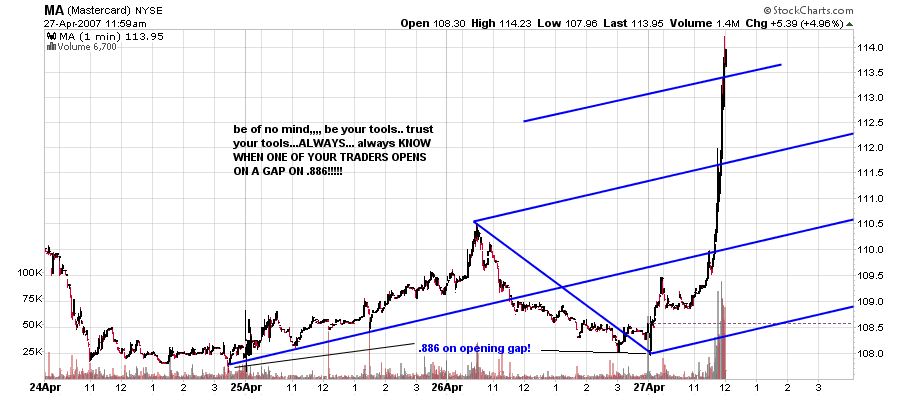
i forgot to post this last one... i have posted hundreds and hundreds of these at the private kane forum....
Click image for original size
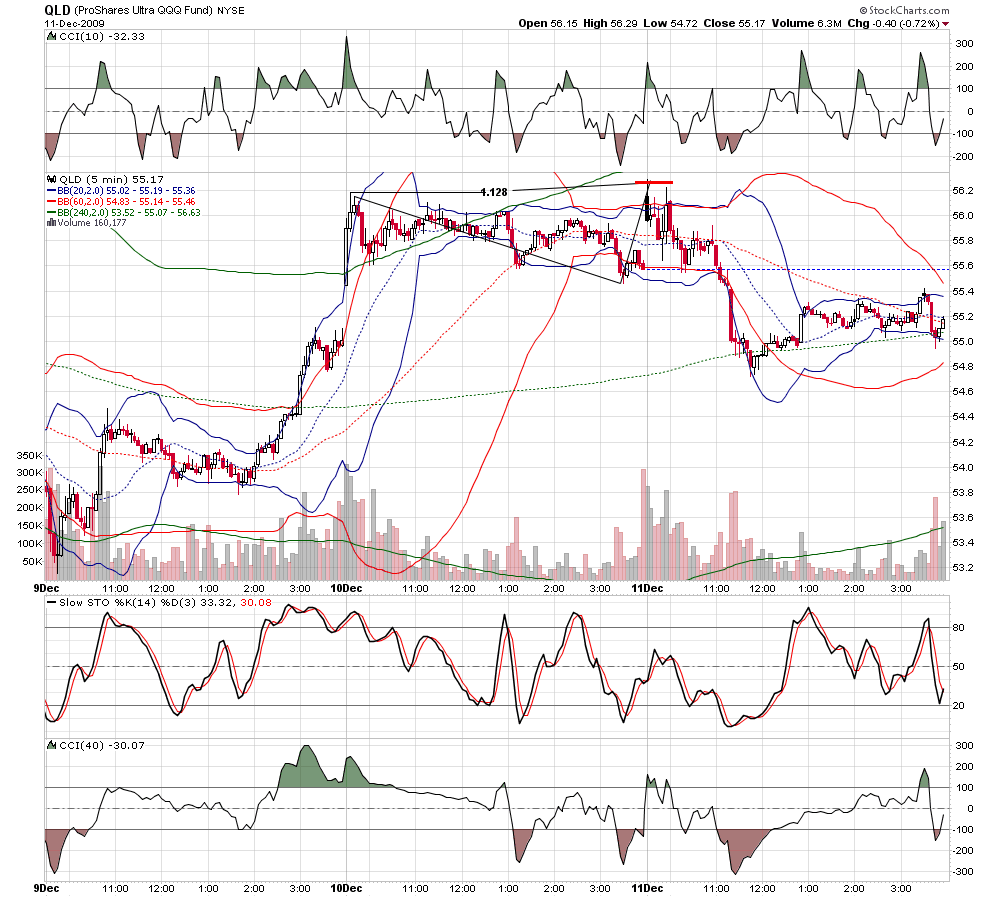
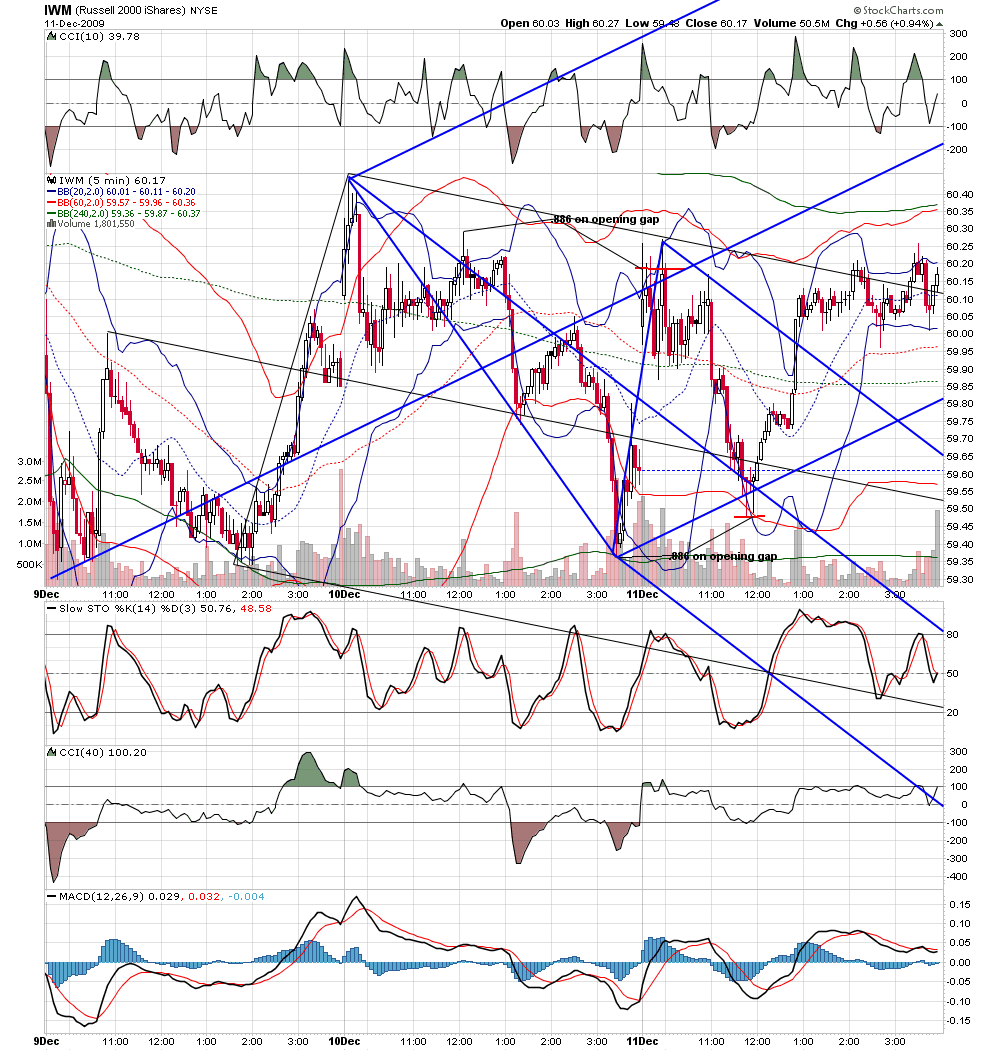
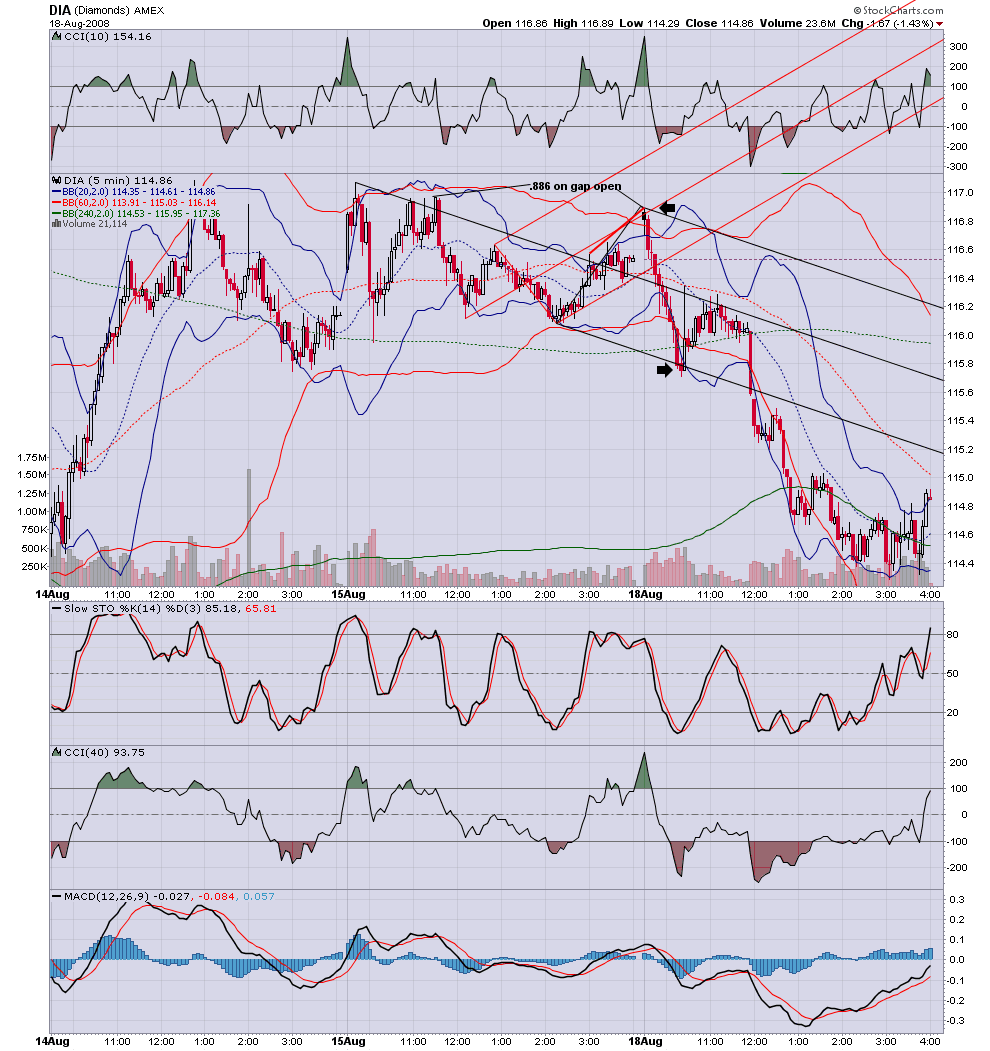
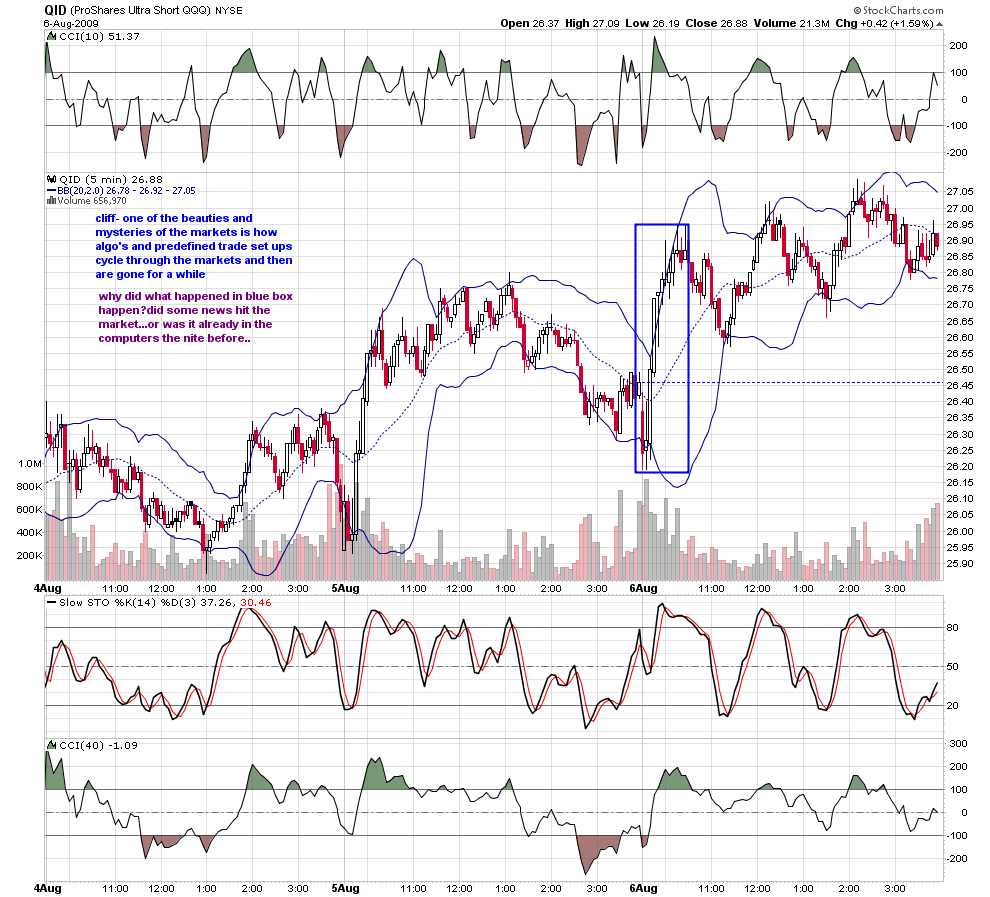
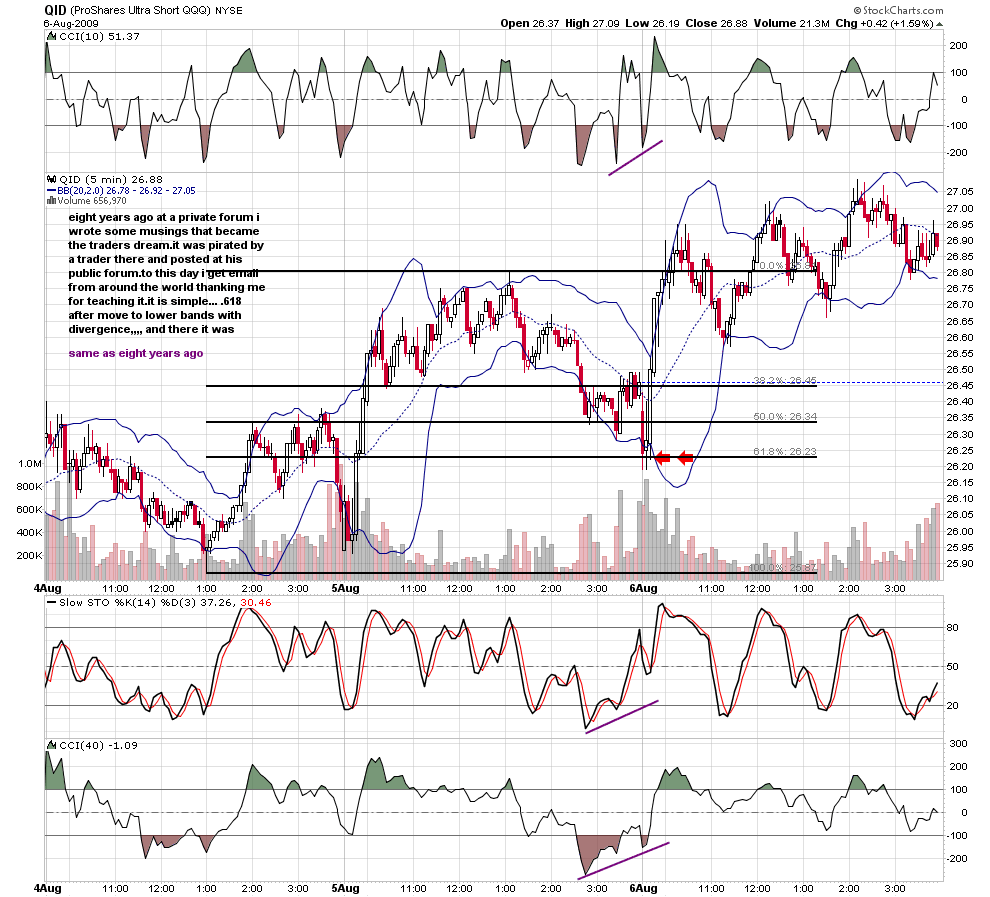
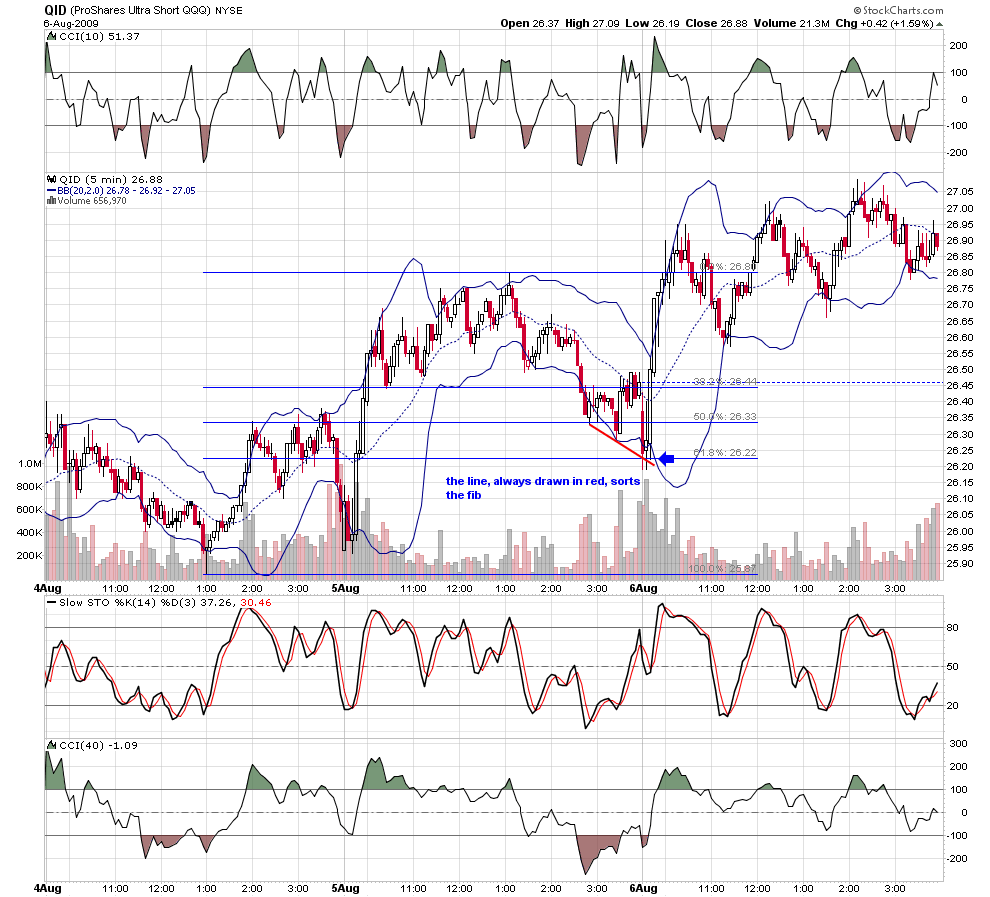
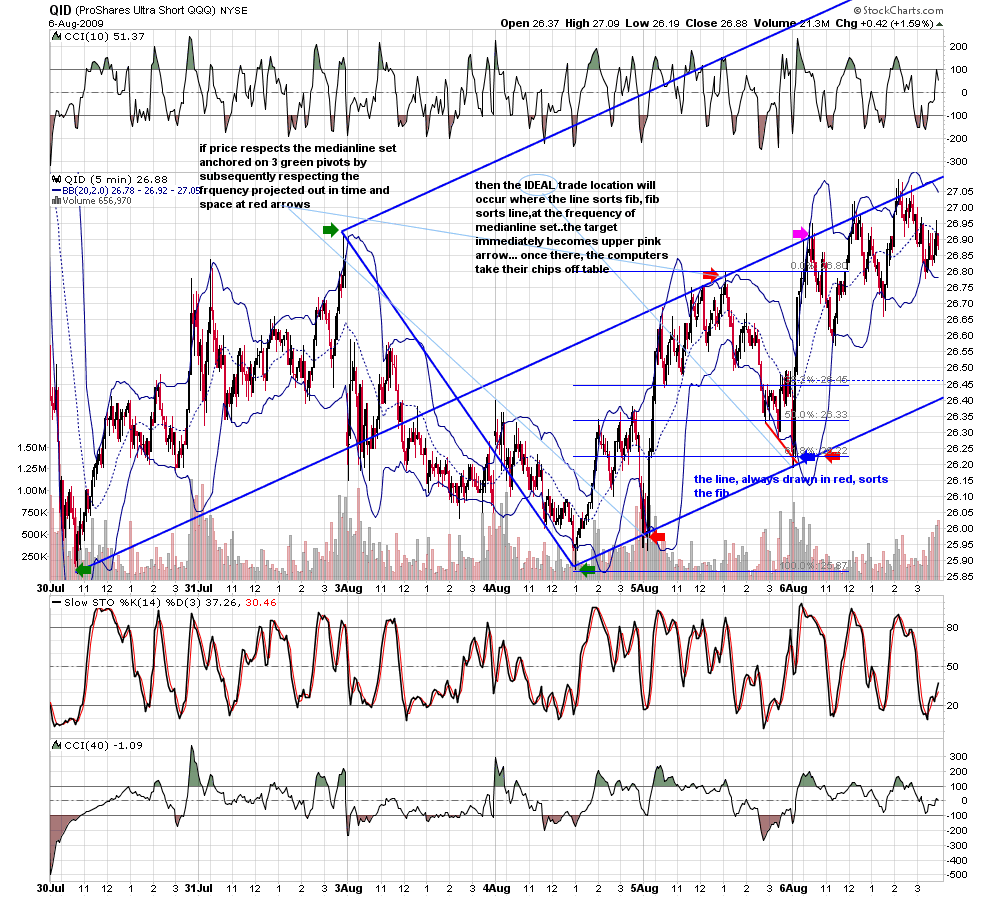
blue-i thought i would dump some charts to show you how often the computers are playing a game that few see....
Click image for original size
Click image for original size
Click image for original size
Click image for original size
Click image for original size
Click image for original size
Click image for original size
Click image for original size
Click image for original size
Click image for original size

Click image for original size
i can not beat the high frequency computers.... nor can i beat the cost of overtrading.... so my niche is to try to captures swings.... here is how i explained a trade to an 84 yr old gentleman.... should give you some context for how i use medianline sets.... often, the are the LAST tool on my charts...
Click image for original size
Click image for original size
Click image for original size
Click image for original size
Thx pal! Sorry to coax you out of the Jims room, but i just thought you had a lot to offer! Again thx!
Thanks for those Roofer....with thousands of stocks how do you stock folks actually monitor all of them in real time and THEN take advantage of the fib levels, lines and what not ? It seems that there can be so many areas to watch and then if you throw in multiple stocks it would almost seem impossible.....
I know I'm a pain in the neck with this question but you stock folks have me puzzled.....With so many Fib areas , then trendlines, then median lines.....then you may get a gap on so many stocks at the open.....so how do you decide in real time what to actually trade ? I have enough trouble with the S&P...I can only imagine the stress from following even a small basket of 10 stocks...
Now we need Jim Kane here to help me with the actual math....10 stocks, at least 7 fib areas plus the .86 and such, then trendlines, then medianlines for each, then gaps......YIKES.that is a ton of combinations...!!!
Perhaps this is the reason I wanted you guys to post trades as they were happening.....you know where I'm going with this.....perhaps you can straighten me out..
Bruce
Bruce,
I can't speak for roofer, but he has said many times he is looking at a small, core group he likes to watch, so many times you'll see a lot of the same issues in his posts over time.
Here's what I do. I use TeleChart to create watchlists. I start with say a sort based on highest volume, optionable, and maybe a few other simple criteria. When I hit the spacebar it goes to the next issue. I can do 100-500 stocks in an amazingly short period of time. I also set up the program with two charts, say daily and weekly of the same issue, side by side. I can also use the mouse wheel to quickly scroll timeframes from daily to yearly, to see 'context'.
I am scanning, by eye (the way I prefer, I want to see and interact with the data, not use a scanning program, which could never see what my eye can see after about 34,000 hours of screen time), looking for one of two very specific setups (there are variations of the setups, but I can see them all in an instant). If it looks like it is in the process of potentially setting up, I hit the letter 'F' and it flags it. Once through as many stocks as I can stand, I transfer all the flagged ones to a watch list.
Now, say I have 100 in my watchlist. I can go through those at night, and do it in ten minutes. I just hit the spacebar and look, decide if it is getting closer or if it has jumped out of the track to the potential trade area, in which case I just delete if from the list. Meanwhile, for everything that is getting close and looks good, maybe ten at any given time, I go to my charting platform, QCharts, and do all the work. This will define my PTA (potential trade area) very precisely. I can do a watchlist in QCharts for let's say these ten. I can link a chart, with my work on each of them, and just click on any tickers in the list (or just arrow down the list) and see each chart one after the other. This takes minutes at the most.
Now, let's say one is getting close to the PTA. I set an alert in QCharts just above the PTA (for a long setup), and once that price level is hit, QCharts pops up an alert. I then drop down in timeframe and keep that specific chart up, waiting for my entry trigger. All in all a smooth, easy, efficient process worked out over many years.
Personally, I like to follow just the ES and maybe CL intraday (and sometimes gold and ZN), and then do the higher timeframe setups on most of the liquid commodities. I don't follow as many stocks as I have at times in the past. I tend to do that a lot more when I have a student who is a swing trader in stocks, and we are looking at various stocks all the time, and then I see setups and can't help but follow them. There is only so much time.
If I didn't try to follow the ES and CL intraday tick for tick, and work up all the other commodities, I can easily watch 500 stocks broadly, 100 stocks semi-closely, and a top 10 or so very closely using this system. I hope this helps, Bruce.
Love your insight Jim! Always have, always will, ... Like P.T. EMINI , your comments are always well thought out and insightful( whether i happen to agree or not) thx
Thanks, kool. The cool thing is it isn't about agree or disagree, right or wrong, it's about two hands pushing on each other such that both hands get stronger. I post my thoughts, you post yours, PT, VO, Bruce, roofer, whoever, and we all debate the ideas and discuss the merits and downsides, and we all grow. That's what makes this forum great, in my opinion. BTW, I love to read your posts. The things we could discuss in an afternoon charting together...
I hear ya pal.. feel the same way 2
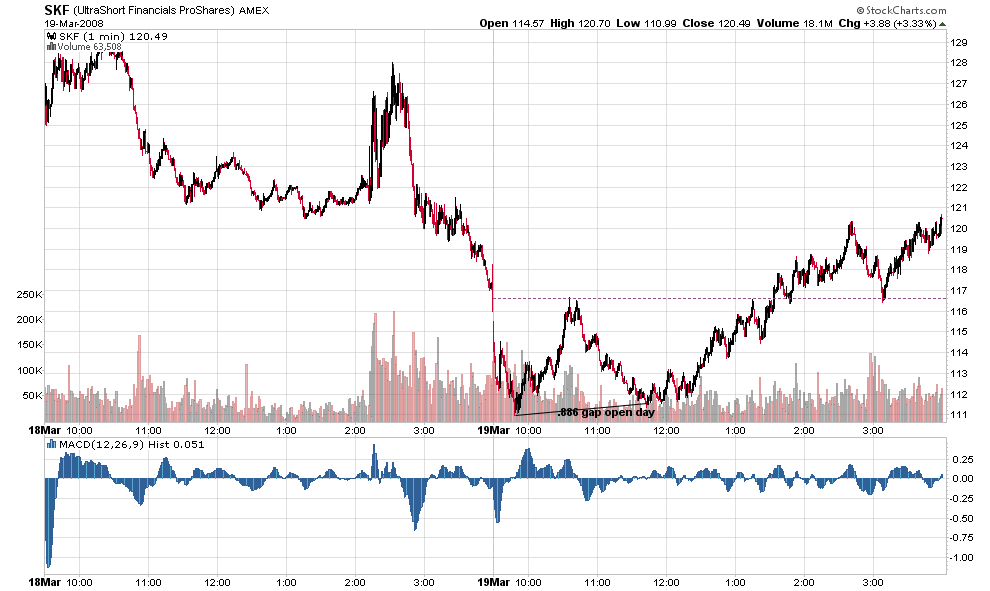
quietly, without fanfare, the computers end the year playing the same game....,886 on opening gap
Click image for original size
Emini Day Trading /
Daily Notes /
Forecast /
Economic Events /
Search /
Terms and Conditions /
Disclaimer /
Books /
Online Books /
Site Map /
Contact /
Privacy Policy /
Links /
About /
Day Trading Forum /
Investment Calculators /
Pivot Point Calculator /
Market Profile Generator /
Fibonacci Calculator /
Mailing List /
Advertise Here /
Articles /
Financial Terms /
Brokers /
Software /
Holidays /
Stock Split Calendar /
Mortgage Calculator /
Donate
Copyright © 2004-2023, MyPivots. All rights reserved.
Copyright © 2004-2023, MyPivots. All rights reserved.