Negative divergencies
Ive been playing this game off and on for over 20 years now and i thought id just about seen it all, but a question for you veteran players. I dont know if ive ever seen such a strong and long lasting advance as what weve seen this year in the face of such massive negative divergencies! We all know divergencies can last a while , but i can show you charts where this year they started in august somewhere around 980-1000! Thats 5 freakin months so far! Anybody ever remember such long divergencies? Makes me feel sorry for newer players (and some veterans too!) trying to trade off of just technical indicators! lol.. thoughts? comments?
Do you have a chart showing this?
As i say ,i can show you a dozen.. heres just one.. note the divergence on the vaunted rsi and the macd. both from early Aug!...
Click image for original size
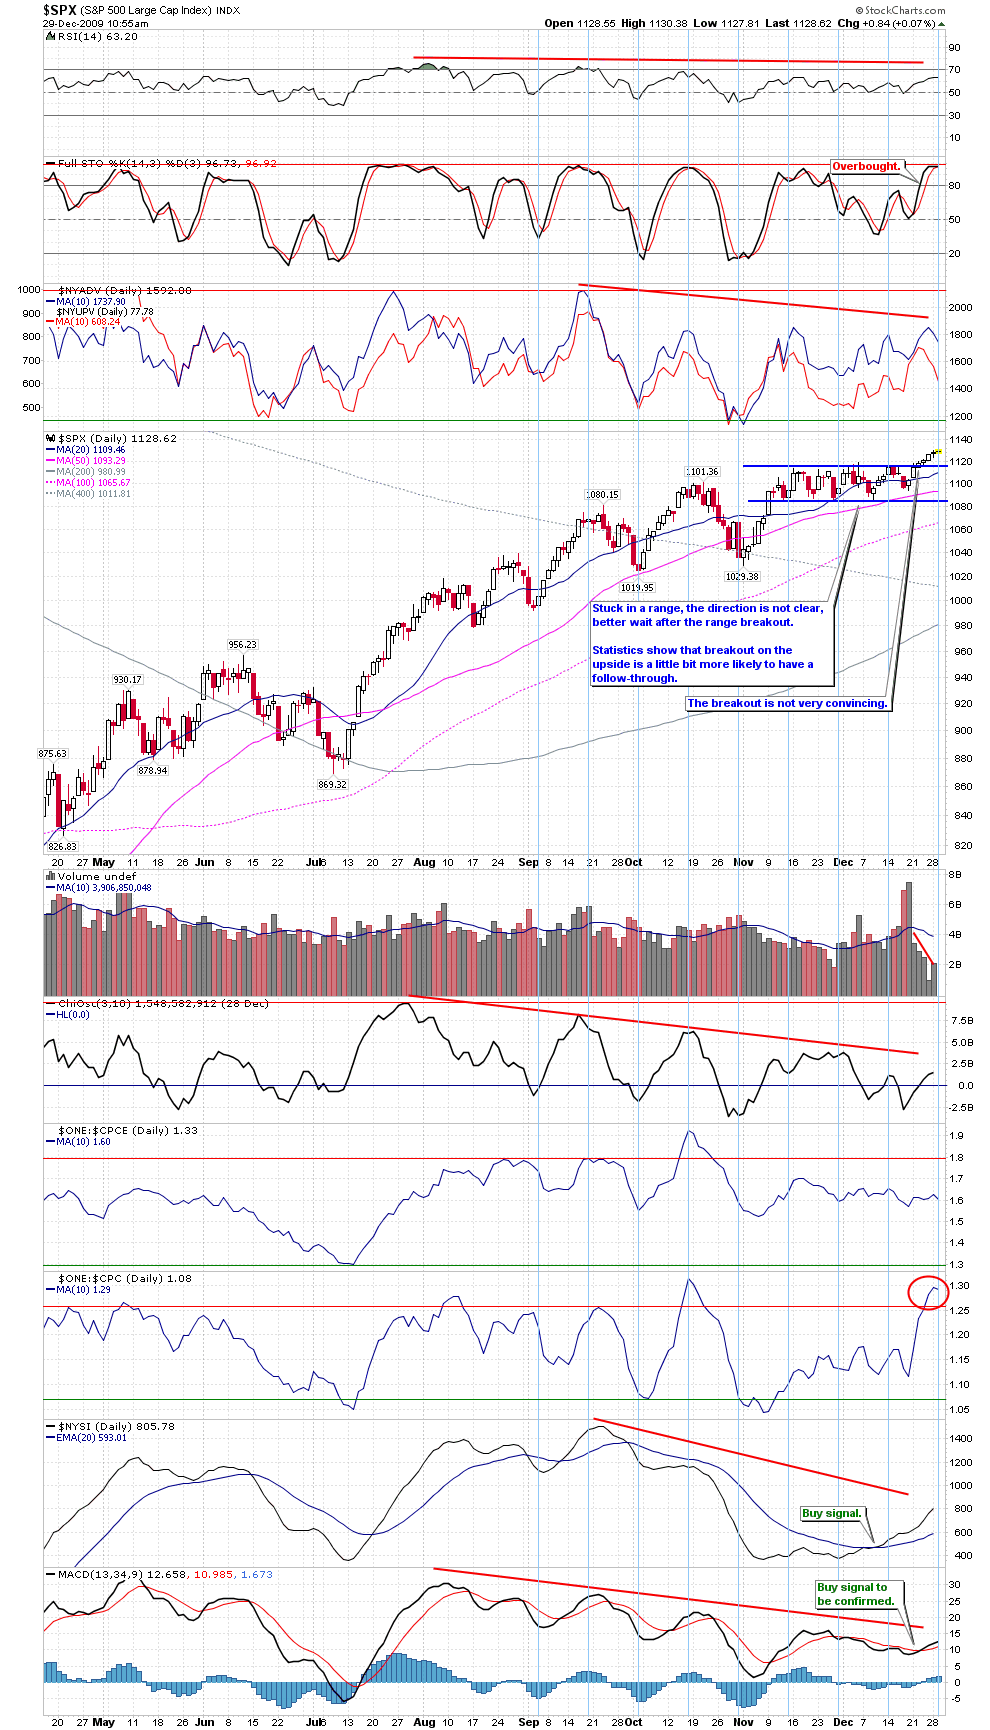
Iknow some may attibute this behavior to the 'light volume' most of the time period , but somehow i dont buy into that. Thats 5 months and nearly 150 handles. I find that beyond unsual, maybe even flat out crazy! (chart courtesy of Cobra) ps: its not as pronounced but even the stoch's have the same divergence!
I find this behavior both fascinating... and in explicable! It means something im just not sure what!
Hey Kool, here's my take on it!
First, what is divergence? It is nothing more than indicator lag. For example, the market moved say 5 points in 3 hours, then pulls back. Then continues to move another 5 points in 45 minutes. The indicator is going to show divergence as it will not be as quick as the price. The market moved the same amount in half the time. It's really that simple.
The market has moved 150 handles as you say with multiple divergences. This is a strong move with little pullback so any divergence has to be taken with a grain of salt.
We see this on any trending day on an intraday basis. It is very common to see oscillators diverge all the way up (or down) in a trending market. I think there was a post on the TI thread about someone selling and getting stopped 6 times in a row. TI uses divergences. Divergence does not a signal make! (don't forget about hidden divergence that = continuation)
Stochs, RSI, MACD, etc will stay in the overbought or oversold area giving multiple divergences while a strong trend is underway.
Price is the number one indicator and I myself do not fight it. I don't use indicators in my trading, just price. I have been doing this for 14 years and let the indicators go a few years back. NIce observations though!
HOpe this helps!
JCX
THX for the reply! Not sure i 100% agree. Afterall we had at least 2-6% declines in that period , which is fairly decent. But good food for thought! Thx again!
Originally posted by koolblueYeah, I noticed this too, kool. What I think it means/shows won't be a popular opinion. I think it shows outright manipulation, the lack of a 'balanced' market with the usual broad range of participants. But, that's just my opinion. I've seen many behaviors since March that I have not seen before. But, JCX does make a good point. The only issue I have with it is that, as you've mentioned, we've not seen this before, and there have been long, strong trending periods not too disimilar to now (Mar '03 low to Mar '04, for example).
I find this behavior both fascinating... and in explicable! It means something im just not sure what!
Very astute JIM! Thats actually what crossed my mind this holiday as i perused the longer term charts. Goldman sucks and the ppt? Who knows? It just seems that less and less real buying is occurring and soon only one poor jerk in Hoboken N.J. will be buying this thing , while the other 300 million of us will begin to sell.. lol. AN exagerration of course . But i agree, ive seen plenty of trending markets but i dont know if ive even seen these kind of massive divergenies, for this long of a period! Could it be a result of the historic decline we saw down to 666? Or a warning sign of epic proportions? Either way, i think were going to get our answer early in 2010! All i really know is , i have my sixth sense telling me this may be historic much like the march low was (in several indicators) and some thing historic may be coming next!
Good thoughts from both Kool and Jim. The only part I want to add is the pullbacks were all higher lows in a nice uptrend and relative to the 666 low, not more than a blip. Also as noted, see the oscillators are making lower lows while price is making higher lows (hidden divergence) that = continuation and so far has been spot on.
I have to agree with the market manipulation but that's ok with me. The trick is to be on the right side of the money no matter the reason!
As long as support holds in the overall uptrend, divergences are just potential warning signs along the way. One thing for sure we will all be watching to see how this plays out but I do have some higher targets we have not achieved yet.
JCX
Nice work, kool.
Emini Day Trading /
Daily Notes /
Forecast /
Economic Events /
Search /
Terms and Conditions /
Disclaimer /
Books /
Online Books /
Site Map /
Contact /
Privacy Policy /
Links /
About /
Day Trading Forum /
Investment Calculators /
Pivot Point Calculator /
Market Profile Generator /
Fibonacci Calculator /
Mailing List /
Advertise Here /
Articles /
Financial Terms /
Brokers /
Software /
Holidays /
Stock Split Calendar /
Mortgage Calculator /
Donate
Copyright © 2004-2023, MyPivots. All rights reserved.
Copyright © 2004-2023, MyPivots. All rights reserved.