The trading Matrix
This quick thread is based around the ideas of Dr. Brett. I want to see if they hold up over time and the affect the overnight session has on the day session in the ES. Any and all ideas are welcome.
Basic premise I'm working with for today is this.
1)If the overnight high is contained within yesterdays day session and that high acts as support then we will go on to test the R1 level and the previous days high.
2)If the overnight high fails we will test the overnight midpoint and the S1 level and the previous days lows...
3)If the overnight low holds we will test the Overnight midpoint and the r1
Yesterday in the ES we have a high of 1176.50 a low of 1160.25 and a settlement of 1162.75. So the standard pivots are as follows:
R1 = 72.75
pv = 66.50
s1 = 56.50
The current overnight high is 1168.25 and the low is 1158.25.
We also need to incorporate the following statistics that Dr. Brett uses these being the Pivot being hit 75% of the time and R1 or S1 hitting 70%. He also uses an 85% probability of the previous days RTH high or low being broken. Some damn good stats if they are true.
On charts and in text I'll be using the following:
ONH = Overnight High
ONL = Overnight Low
ONM = Overnight midpoint
PDL = previous days low
PDH = previous days high
EDIT********************************
The overnight session can only do a few things that we can base our daily matrix around and that is:
Make a HH and HL then the RTH
Make a LL and LH then RTH
Make an outside bar to RTH
Make an inside bar to RTH
No differnt then comparing RTH to RTH really
***************************************************
I'd prefer to keep this to concepts and not specific trades. I have a nasty habbit of mixing trades in posts and also mixing trade concepts. So please feel free to slap me around if I get out of context for this thread. Of course post whatever you think that helps in understanding the matrix as I am not the best communicator in posts.
Bruce
I thought I had Uploaded a chart... Try again here woops, I see now, I had to select "share"
Click image for original size
Interesting Paul....now you have me thinking if we can apply this rule to the RTH session and it's highs and lows. Dr B says inside bars only form about 12- 15 % of the time so I'm wondering if this method can help fiqure out which high or low will get broken first too! Thanks for the concept..
wow,
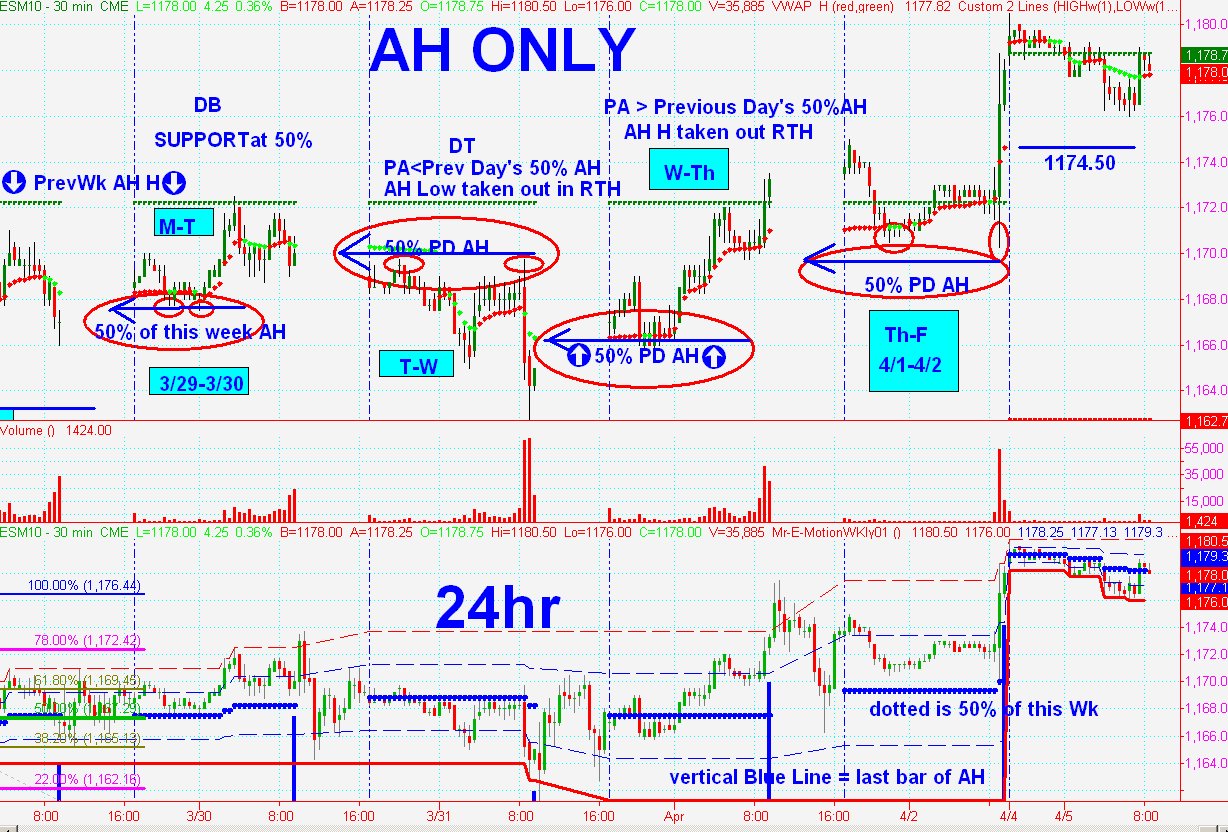
nobody recognized that the RTH Low was equal to the previous Day's 50% retracement.
Yeah. Uh-Huh.
nobody recognized that the RTH Low was equal to the previous Day's 50% retracement.
Yeah. Uh-Huh.
That's a nice start Paul...for me I was watching the overnight low from Sunday night and the key 1175 number...with all that going I still missed the long...
Monday was a unique (and for me, untested) situation due to the abbreviated Friday session, but that session was technically ALL AH action). All I did was apply the 50% of the previous day measure.
Monday's PA after 11:00am is one thing that continues to compel me to figure out a "methode de trade" that is only during the 6am to 11 am window (unless there are specific conditions in place; exactly what those conditions are, I do not know yet.)
Monday's PA after 11:00am is one thing that continues to compel me to figure out a "methode de trade" that is only during the 6am to 11 am window (unless there are specific conditions in place; exactly what those conditions are, I do not know yet.)
Emini Day Trading /
Daily Notes /
Forecast /
Economic Events /
Search /
Terms and Conditions /
Disclaimer /
Books /
Online Books /
Site Map /
Contact /
Privacy Policy /
Links /
About /
Day Trading Forum /
Investment Calculators /
Pivot Point Calculator /
Market Profile Generator /
Fibonacci Calculator /
Mailing List /
Advertise Here /
Articles /
Financial Terms /
Brokers /
Software /
Holidays /
Stock Split Calendar /
Mortgage Calculator /
Donate
Copyright © 2004-2023, MyPivots. All rights reserved.
Copyright © 2004-2023, MyPivots. All rights reserved.