No Indicator Mumbo Jumbo
Originally posted by BruceM
I see no such pattern Red......
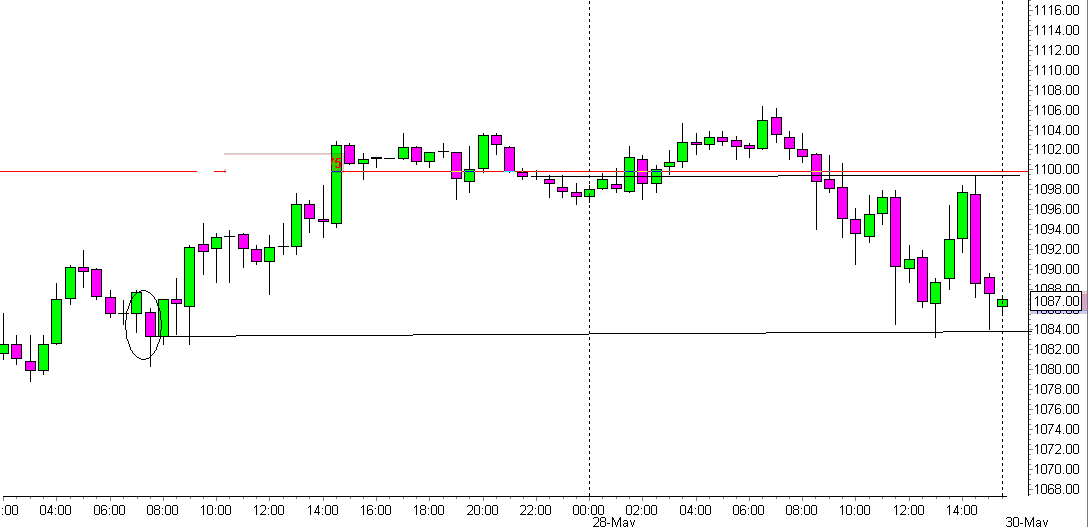
The above posted chart is a 30 min from Thursday 27/5 and not friday (Please check posting date). The bearish seperating line wis formed between 8:00est and 8:30est candle
My bad AK; but I still don't show the pattern 8:00/8:30am est
5/27/10
5/27/10
Here you go....
Click image for original size
http://www.mypivots.com/Board/Topic/4072/21/candle-pattern
4th post in this link gives a further explanation
4th post in this link gives a further explanation
Emini Day Trading /
Daily Notes /
Forecast /
Economic Events /
Search /
Terms and Conditions /
Disclaimer /
Books /
Online Books /
Site Map /
Contact /
Privacy Policy /
Links /
About /
Day Trading Forum /
Investment Calculators /
Pivot Point Calculator /
Market Profile Generator /
Fibonacci Calculator /
Mailing List /
Advertise Here /
Articles /
Financial Terms /
Brokers /
Software /
Holidays /
Stock Split Calendar /
Mortgage Calculator /
Donate
Copyright © 2004-2023, MyPivots. All rights reserved.
Copyright © 2004-2023, MyPivots. All rights reserved.