ES Short Term Trading 5-12-10
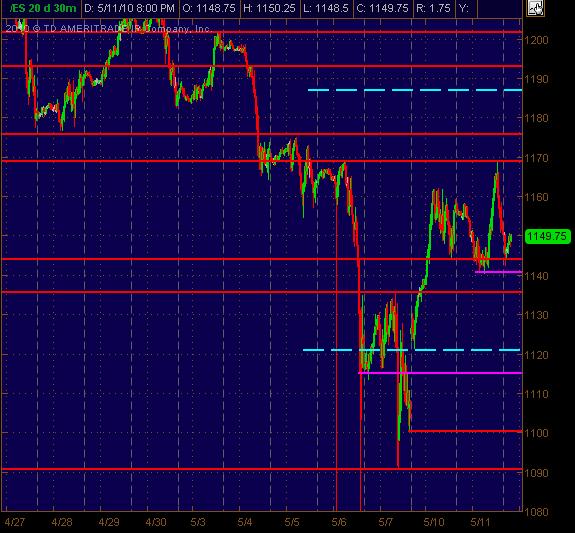
1140-1142 area seems like it needs to hold for longs (even w/a quick small flush, stop run) … if it breaks and holds, further pushes down to next Support levels are a high probability, especially if overnight trading doesn’t rally much from the RTH close … Daily S1 is also at 1139
1160-1162 is initial likely resistance if price moves up … and it seems that we’re in a choppy or range swing of prices right now
1170 is possible but don’t see it quite getting there or exceeding it … this is based on how price trended up Tuesday and then retraced so much of the move.
I’m biased long looking at the charts and some stock charts ... from 1140 to and up thru 1150
Tossing out both a 30min S/R chart along with a 5min chart to drill down to more micro-S/R areas
Hope this is helpful as a map for the day (barring another weird giant news event which seems to be the typical gig lately)
Click image for original size
Originally posted by feng456
plan was followed to the letter.
Hi feng456,
None of us have any clue what plan you are talking about.
If you going to keep hijacking these short term trading threads, then the very least you can do is to contribute your trading plan for the day
Click image for original size
Very similar to yesterday`s trading.
1169-1170 is shaping up to be a significant resistance area.
After breaking below 1156-1157 area I mentioned yesterday, this morning the Market established accepted value there.
All my EMA`s are pointing up, got burned last thurs. trying to fade too early, I plan on waiting for EMA`s to rollover before I short.
NYAD already at 1900, so granted, the upside does appear to have less reward than the downside. On the flipside, with such a broad market strength, any downside will also be limited, as there will be dip buyers waiting in the wings.
Originally posted by phileo
Originally posted by feng456
plan was followed to the letter.
Hi feng456,
None of us have any clue what plan you are talking about.
If you going to keep hijacking these short term trading threads, then the very least you can do is to contribute your trading plan for the day
I think that feng asked us in a previous topic a week or two ago if he could just post whether he had followed his plan or not. He feels that if he is publicly declaring his success at following (or not) the plan that it will make him more likely to follow it because we might berate him for not following it. Is that accurate feng?
Bruce,
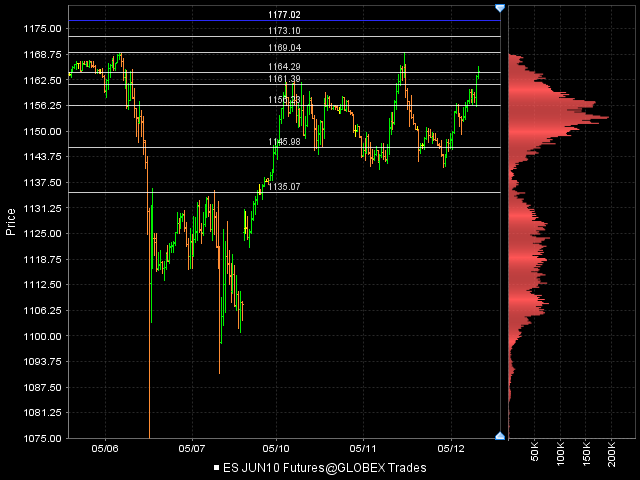
I see volume histo large at 63.00. (one day, today)
Interpret this as "defending" 63.00 as support?
it's very peculiar because there are several prices just below that where there is virtually NO histogram of volume.
(and air)
does this mean anything in your interpretation of volume histo?
I see volume histo large at 63.00. (one day, today)
Interpret this as "defending" 63.00 as support?
it's very peculiar because there are several prices just below that where there is virtually NO histogram of volume.
(and air)
does this mean anything in your interpretation of volume histo?
Click image for original size
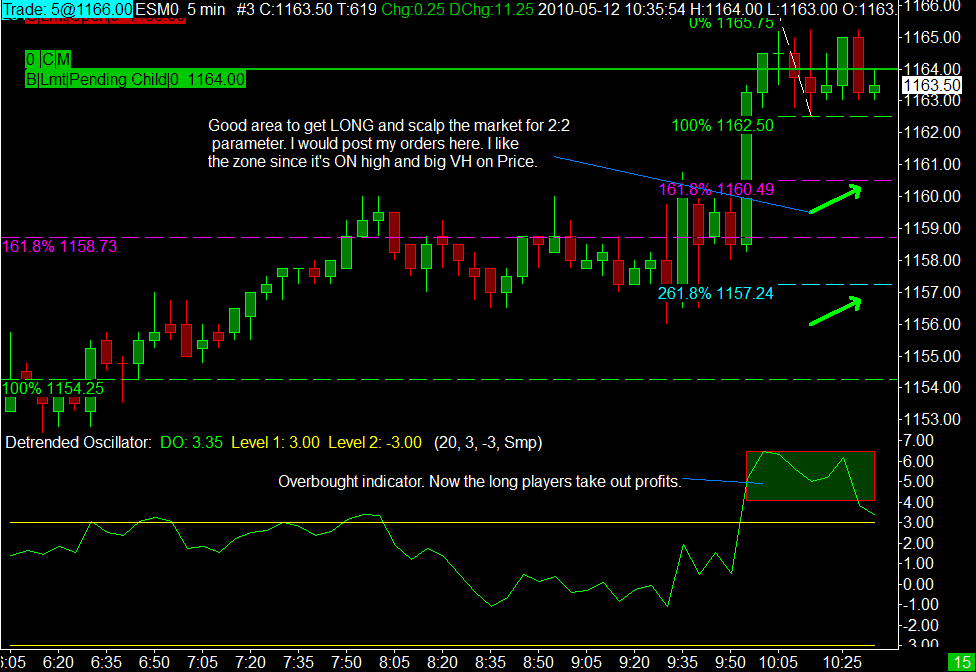
short 1162.25. THis was a prior resistance line that I highlighted in my chart.
plus the EMA`s are rolling over.
plus the EMA`s are rolling over.
Bruce, never mind... LOL
It couldn't have been more than 30 seconds after I posted previous comment that the support broke, air filled.
It couldn't have been more than 30 seconds after I posted previous comment that the support broke, air filled.
out 1162.5, -0.25pts loss.
tricky sideways market... where have all the sellers gone
tricky sideways market... where have all the sellers gone
Originally posted by johnpr2010
Click image for original size
good stuf johnpr2010, you have a better read on the market than i do today....
dip buyers were all over that mini-pullback to 1160.75 like a pack of hungry wild dogs...
I am done for the day I already got my 2 points on scalping methodology since the market is sideways is goint to be very boring to be here until the afternoon. See ya tomorrow!...
Click image for original size
Emini Day Trading /
Daily Notes /
Forecast /
Economic Events /
Search /
Terms and Conditions /
Disclaimer /
Books /
Online Books /
Site Map /
Contact /
Privacy Policy /
Links /
About /
Day Trading Forum /
Investment Calculators /
Pivot Point Calculator /
Market Profile Generator /
Fibonacci Calculator /
Mailing List /
Advertise Here /
Articles /
Financial Terms /
Brokers /
Software /
Holidays /
Stock Split Calendar /
Mortgage Calculator /
Donate
Copyright © 2004-2023, MyPivots. All rights reserved.
Copyright © 2004-2023, MyPivots. All rights reserved.