ES Short Term Trading 5-12-10
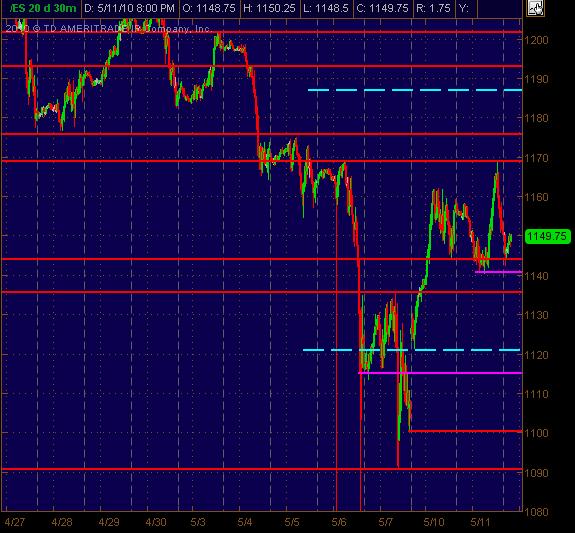
1140-1142 area seems like it needs to hold for longs (even w/a quick small flush, stop run) … if it breaks and holds, further pushes down to next Support levels are a high probability, especially if overnight trading doesn’t rally much from the RTH close … Daily S1 is also at 1139
1160-1162 is initial likely resistance if price moves up … and it seems that we’re in a choppy or range swing of prices right now
1170 is possible but don’t see it quite getting there or exceeding it … this is based on how price trended up Tuesday and then retraced so much of the move.
I’m biased long looking at the charts and some stock charts ... from 1140 to and up thru 1150
Tossing out both a 30min S/R chart along with a 5min chart to drill down to more micro-S/R areas
Hope this is helpful as a map for the day (barring another weird giant news event which seems to be the typical gig lately)
Click image for original size
Click image for original size
Emini Day Trading /
Daily Notes /
Forecast /
Economic Events /
Search /
Terms and Conditions /
Disclaimer /
Books /
Online Books /
Site Map /
Contact /
Privacy Policy /
Links /
About /
Day Trading Forum /
Investment Calculators /
Pivot Point Calculator /
Market Profile Generator /
Fibonacci Calculator /
Mailing List /
Advertise Here /
Articles /
Financial Terms /
Brokers /
Software /
Holidays /
Stock Split Calendar /
Mortgage Calculator /
Donate
Copyright © 2004-2023, MyPivots. All rights reserved.
Copyright © 2004-2023, MyPivots. All rights reserved.