ES Short Term Trading 5-12-10
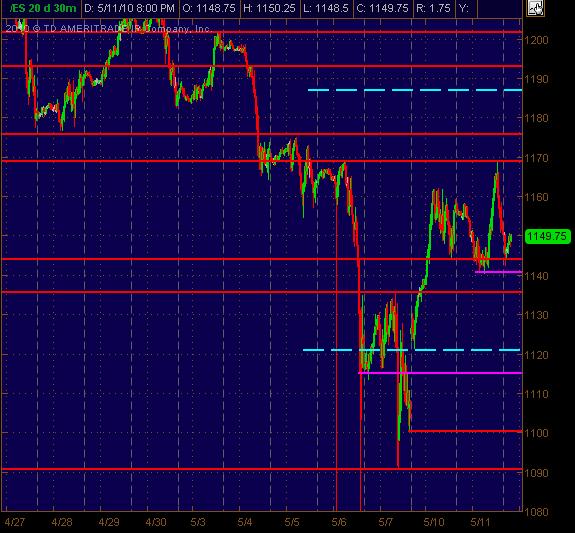
1140-1142 area seems like it needs to hold for longs (even w/a quick small flush, stop run) … if it breaks and holds, further pushes down to next Support levels are a high probability, especially if overnight trading doesn’t rally much from the RTH close … Daily S1 is also at 1139
1160-1162 is initial likely resistance if price moves up … and it seems that we’re in a choppy or range swing of prices right now
1170 is possible but don’t see it quite getting there or exceeding it … this is based on how price trended up Tuesday and then retraced so much of the move.
I’m biased long looking at the charts and some stock charts ... from 1140 to and up thru 1150
Tossing out both a 30min S/R chart along with a 5min chart to drill down to more micro-S/R areas
Hope this is helpful as a map for the day (barring another weird giant news event which seems to be the typical gig lately)
Click image for original size
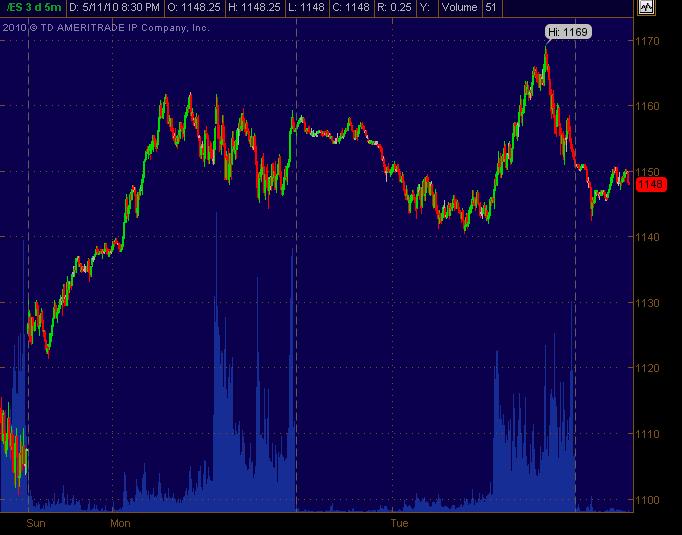
Here's the 5min chart ... look at it from a perspective of price swings and clusters of highs/lows to see smaller time frame potential S/R levels ... since I don't have any drawn on the 30min chart above. Again, I think MP is doing a good job of describing the current market. This is simply another angle to meld with it and other analysis.
Click image for original size
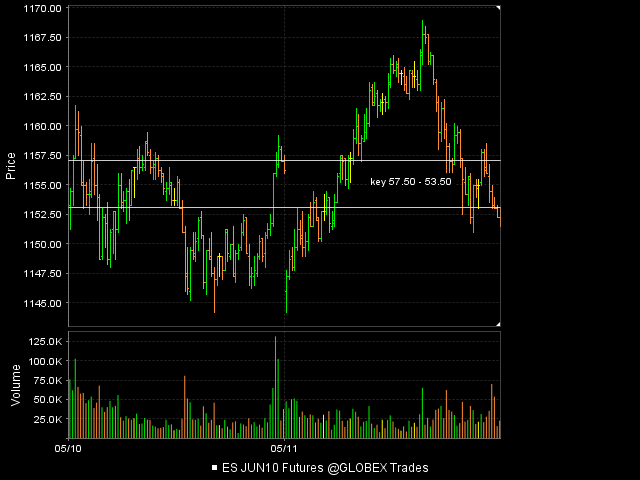
1140 - 1142 Monkey has that
1147 - Peak Volume in Tuesdays O/N so far
1154 - 1156 *******all the volume is in there for Monday and Tuesday. Looks like we are heading that way as I type - 3:30 a.m.
1164 was peak volume before it flipped on Tuesday.
1147 - Peak Volume in Tuesdays O/N so far
1154 - 1156 *******all the volume is in there for Monday and Tuesday. Looks like we are heading that way as I type - 3:30 a.m.
1164 was peak volume before it flipped on Tuesday.
That key 54 - 56 is also the midpoint of the entire Mon-Tuesday Range and daily PV and has now become the HV of the O/N...still early though...so that's a big number today
I favor selling the rallies for a trade back to that zone or to buy below for the retest...we need to assume we are consolidating instead of trading for the trend and that they will try and pull it back to the center of 54 - 56. Eventually it will snap and they will run outthe Monday -Tuesday high or low as that is broken a tremendous amount of times.
LV is at 51.25 in O/N so far and I won't be surprised if we see that again as S&P seems to be strongest.
From here on I'm going to assume that most know thatthe previous days highs and lows and O/N highs and lows are automatic key numbers so I personally am not going to mention them unless they line up or have some other relevance
Well, I log back on this morning and 1140 held overnight and mkt. has rallied up to 1160. That was pretty much what I was expecting ... it seems more and more activity is happening outside of RTH.
At this point, some of the "bull juice" I was looking at has been used up and really don't see it getting to or past 1170.
Biased short now on rallies or into any decent resistance/reversal/MP level(s) [kinda what Bruce mentioned] ... as I'd mentioned, seems we're in a choppy/swinging type market which favors fading after decent price moves.
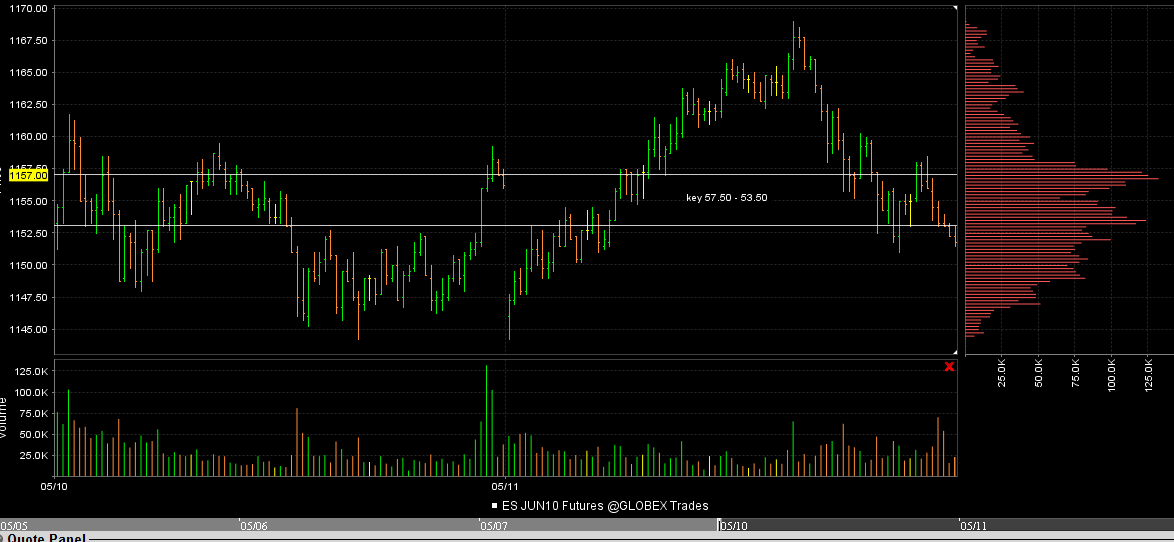
Here is the two day as per volume..the actual zone is more like 57.50 - 53 and you willnotice lower histogram as price gets higher...so I'd like to be selling above 57 's to trade back into the 55 area which splits the zone....in general sell the rallies
Click image for original size
perhaps a chart with the histogram would help - brain freeze today
Click image for original size
plan was followed to the letter.
excuse me for asking, but what plan:}
Bruce, you mentioned yesterday that Monday was neutral day, are you calling it "neutral" simply because it was an inside day, a day that did not challenge or break previous day's H or L?
RE today,
5 day average of the RTH H versus the open comes in today at 1169.60
5 day average of the RTH L versus the Open comes in today at 1146.60.
There have been 2 consecutive days that the H of the day has exceeded the 5 day average of the H versus the Open. In the past, I have noticed that when there are 2 consecutive days like this, the first test of the 5day average of the L versus the open is good for at least a 2pt bounce (2 to 3 pts, and sometimes it is the beginning of a 6 to 8 point leg).
BTW anyone can calculate this.
Average(High-Open,5),
Average(Open-Low,5)
RTH values.
Rmember, these are just "average" performance stats. When price reaches either, I examine PA, looking for 1-2-3 buy or sell in 1 minute charts. (although I will say that with the 2 cosec days described above I have been known to simply Buy (under current conditions, the first test of the L versus the open.)
Click image for original size
Emini Day Trading /
Daily Notes /
Forecast /
Economic Events /
Search /
Terms and Conditions /
Disclaimer /
Books /
Online Books /
Site Map /
Contact /
Privacy Policy /
Links /
About /
Day Trading Forum /
Investment Calculators /
Pivot Point Calculator /
Market Profile Generator /
Fibonacci Calculator /
Mailing List /
Advertise Here /
Articles /
Financial Terms /
Brokers /
Software /
Holidays /
Stock Split Calendar /
Mortgage Calculator /
Donate
Copyright © 2004-2023, MyPivots. All rights reserved.
Copyright © 2004-2023, MyPivots. All rights reserved.