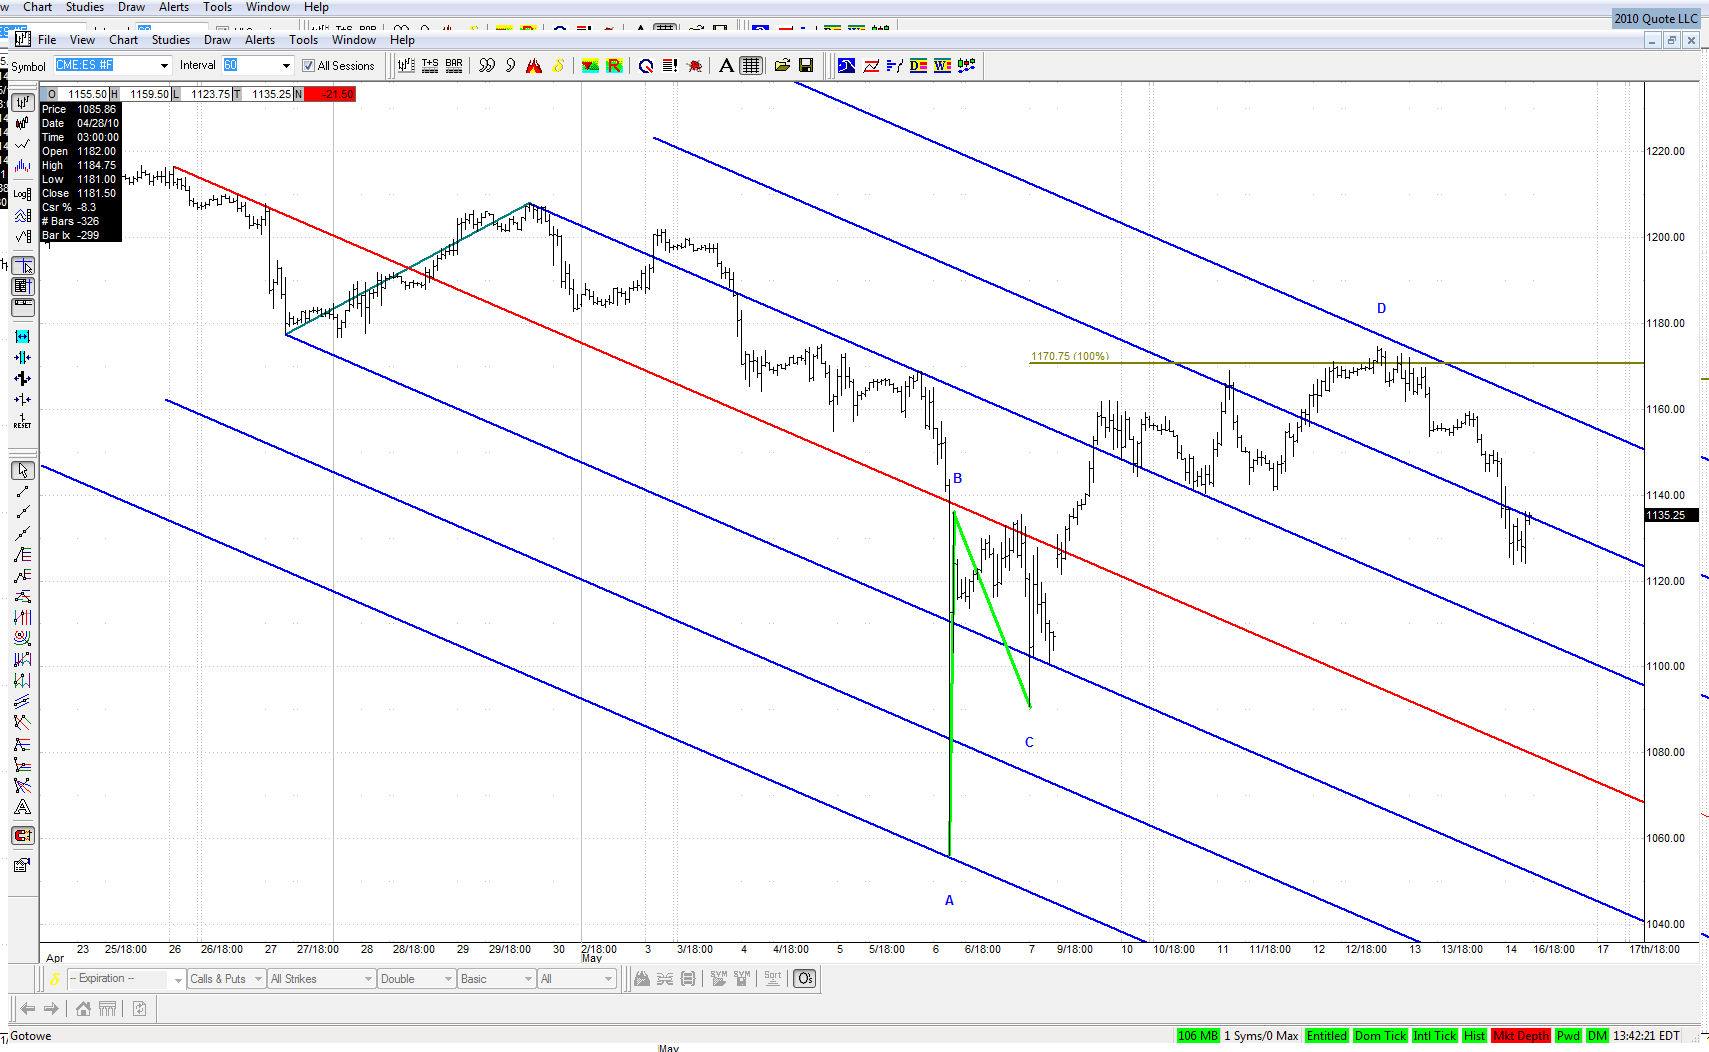
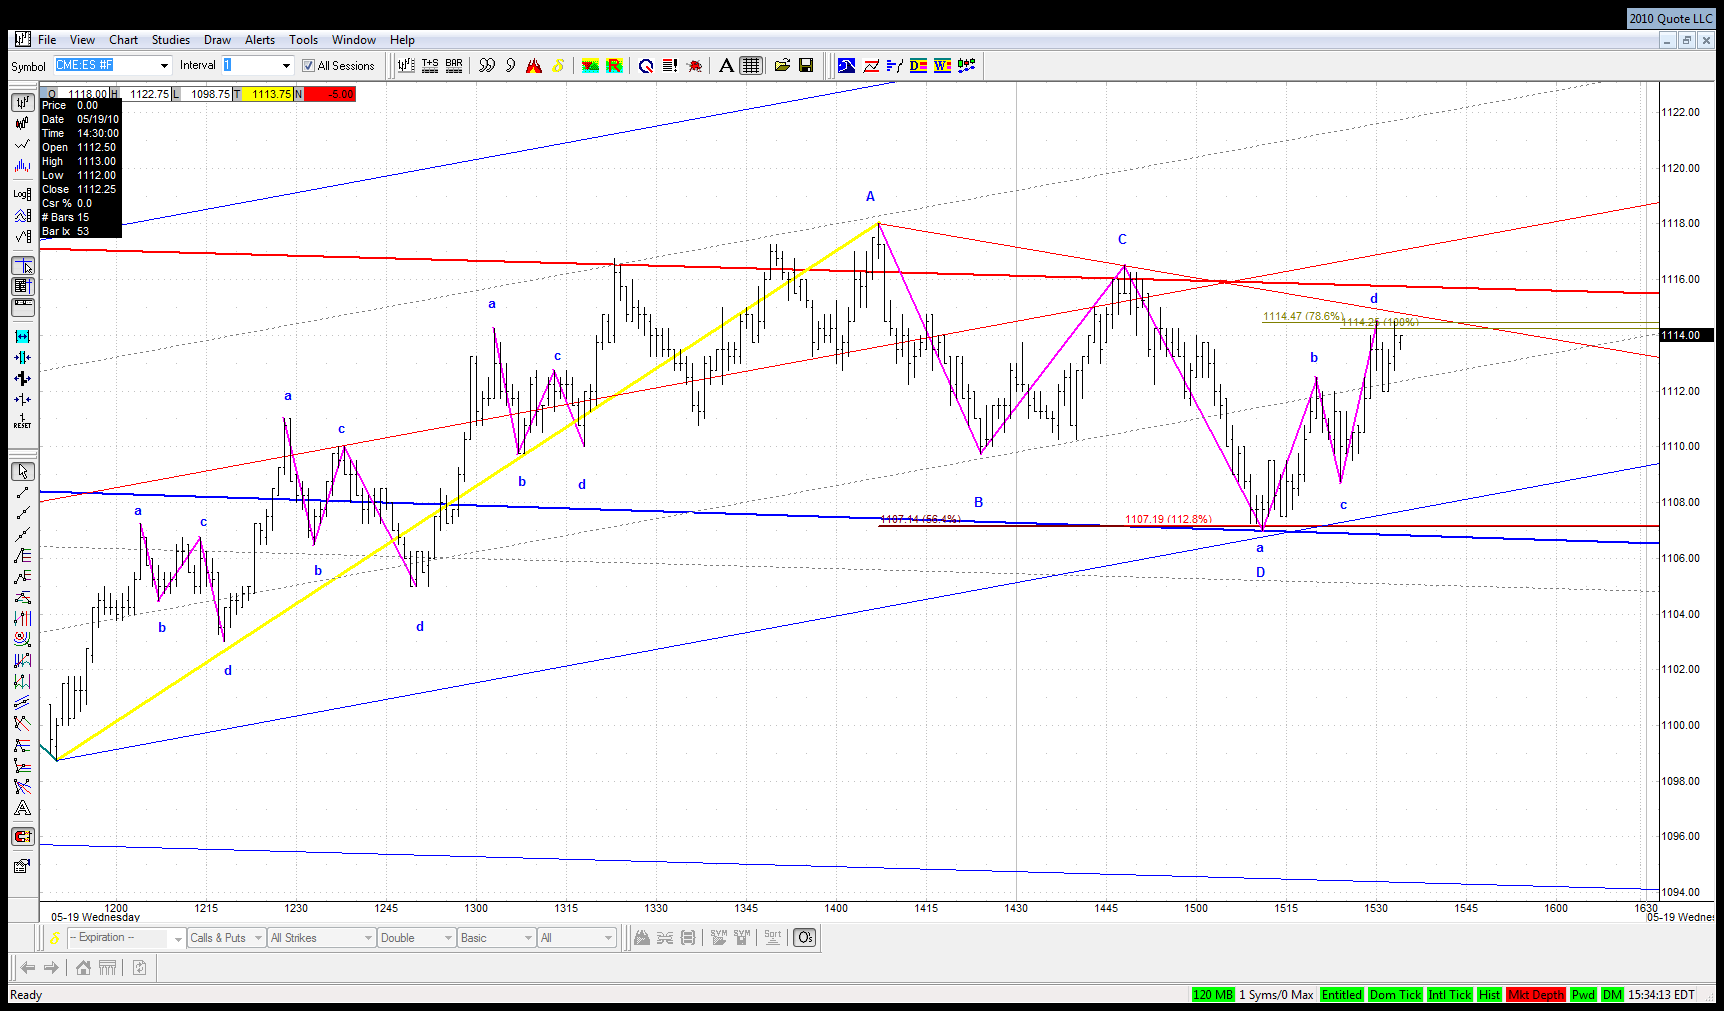
The developments of the last 2 trading days make me consider the whole rise from the post crash bottom to the last week's high as a W2 Kane ABCD:
Timewise it doesn't look good because it rarely happens in a zigzag that CD leg lasts 80 times longer that AB leg. But if it comes to proportions - it's almost perfect: AB and CD legs are nearly equal and whole ABCD retraces between .685 and .786 of the preceding leg down from the top.
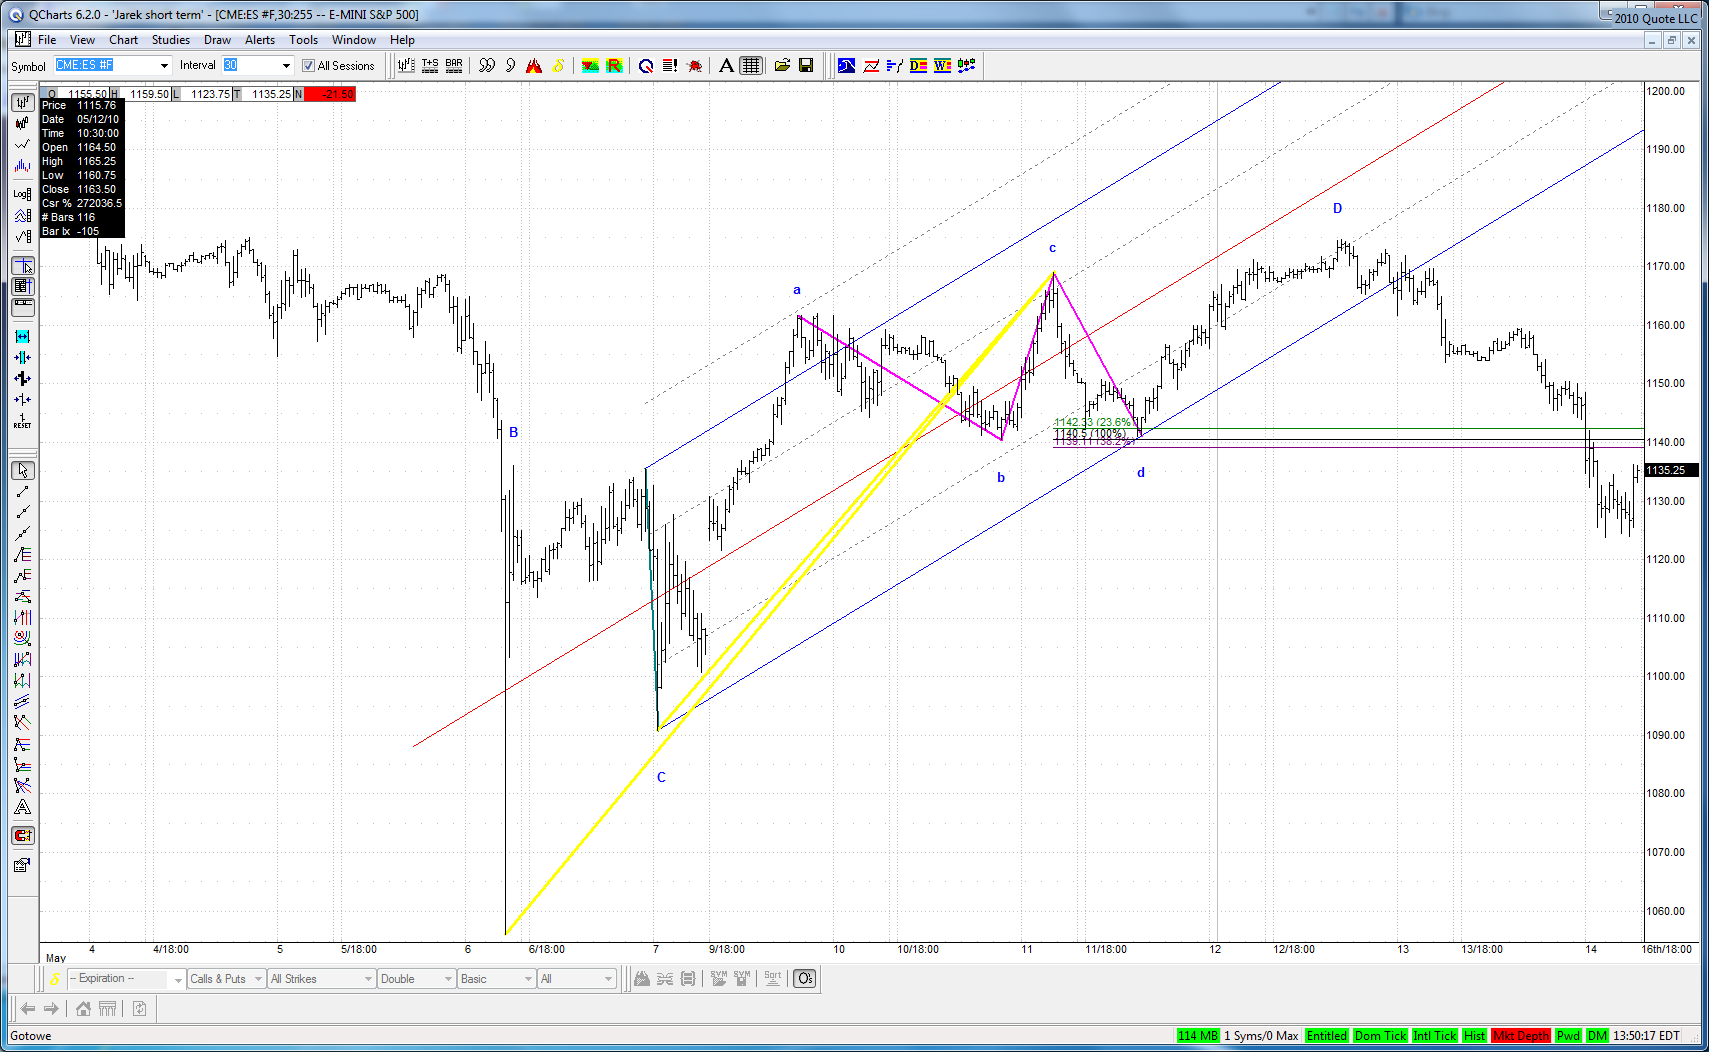
Initially I thought that whole zigzag should finish at May 11th high. Now I see that high as a C point of a W4 correction in the CD leg:
The behaviour of the market in the next couple of days should help us jugde whether this interpretation is correct. This is rather important because in such case we should expect a drop to at least 1020 (1.272 external retracement of the ABCD) and probably much lower if W3 down has just started.
JI
jimkane
Rep: 3,058
Posts: 33,089
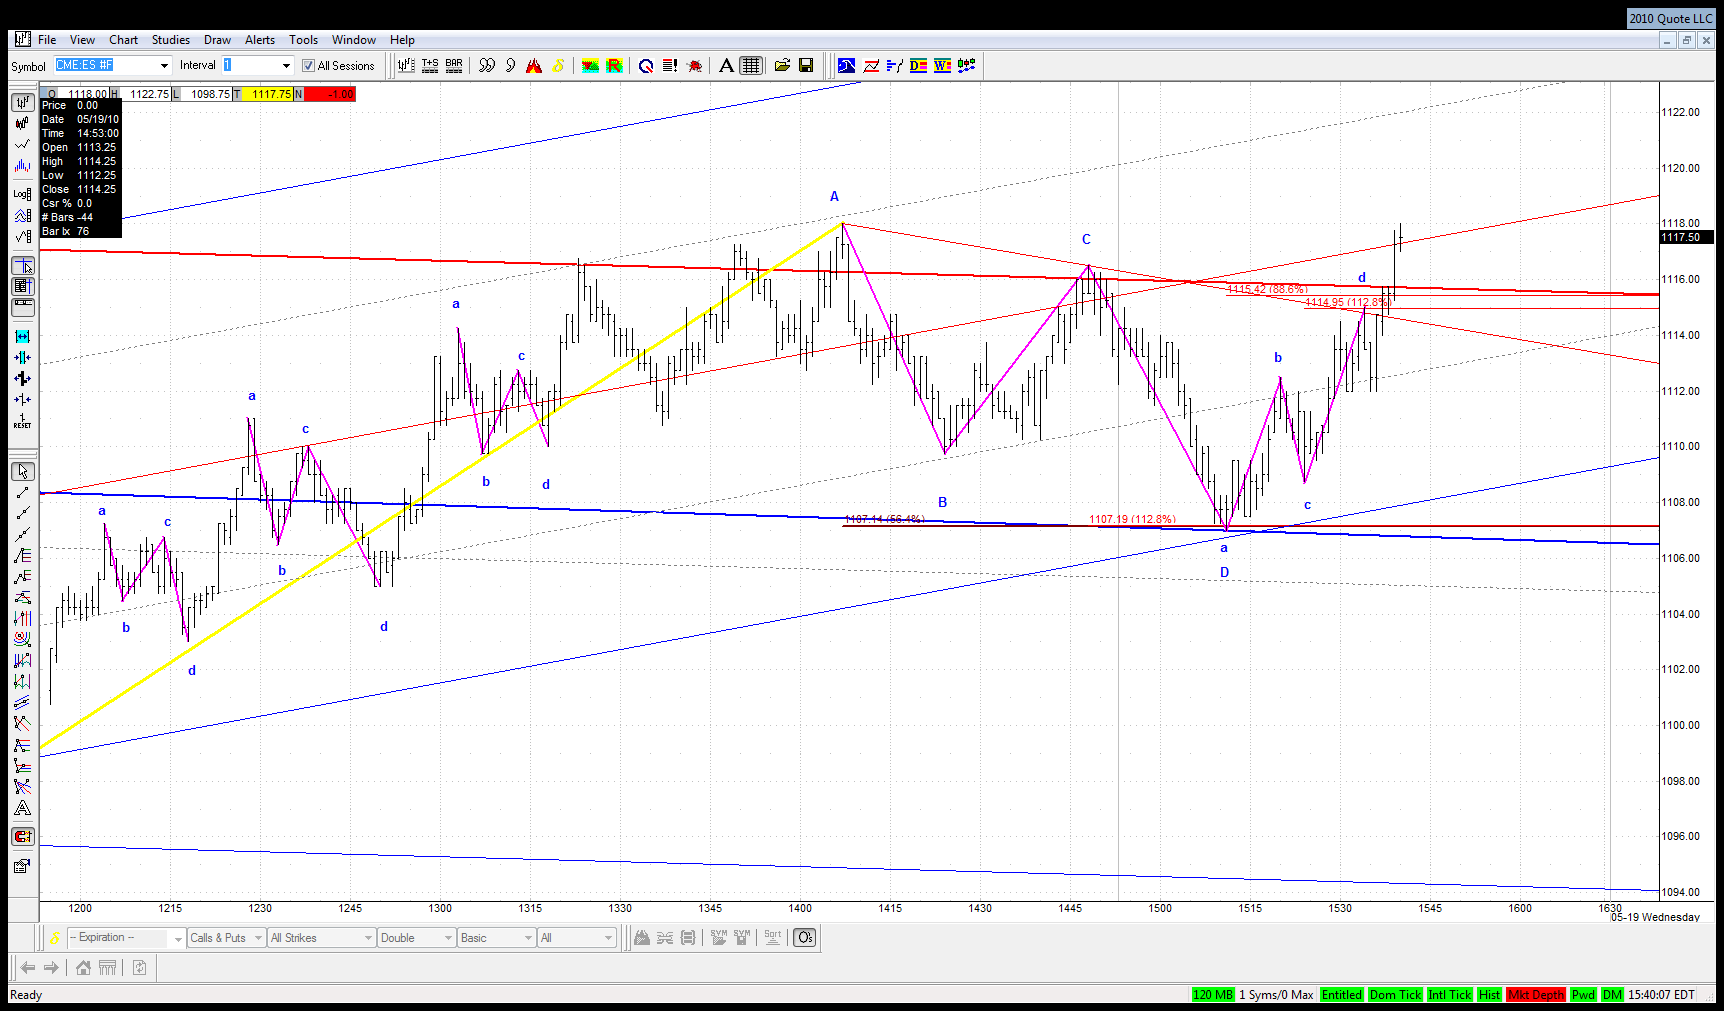
That's the ABCD I mentioned in my last post, and the results from your last chart are what I said I thought would happen.
JA
jarek
Rep: 94
Posts: 3,474
Originally posted by jimkane
That's the ABCD I mentioned in my last post, and the results from your last chart are what I said I thought would happen.
I haven't noticed your post in the rush of my own charting and posting :-)
JA
jarek
Rep: 94
Posts: 3,474
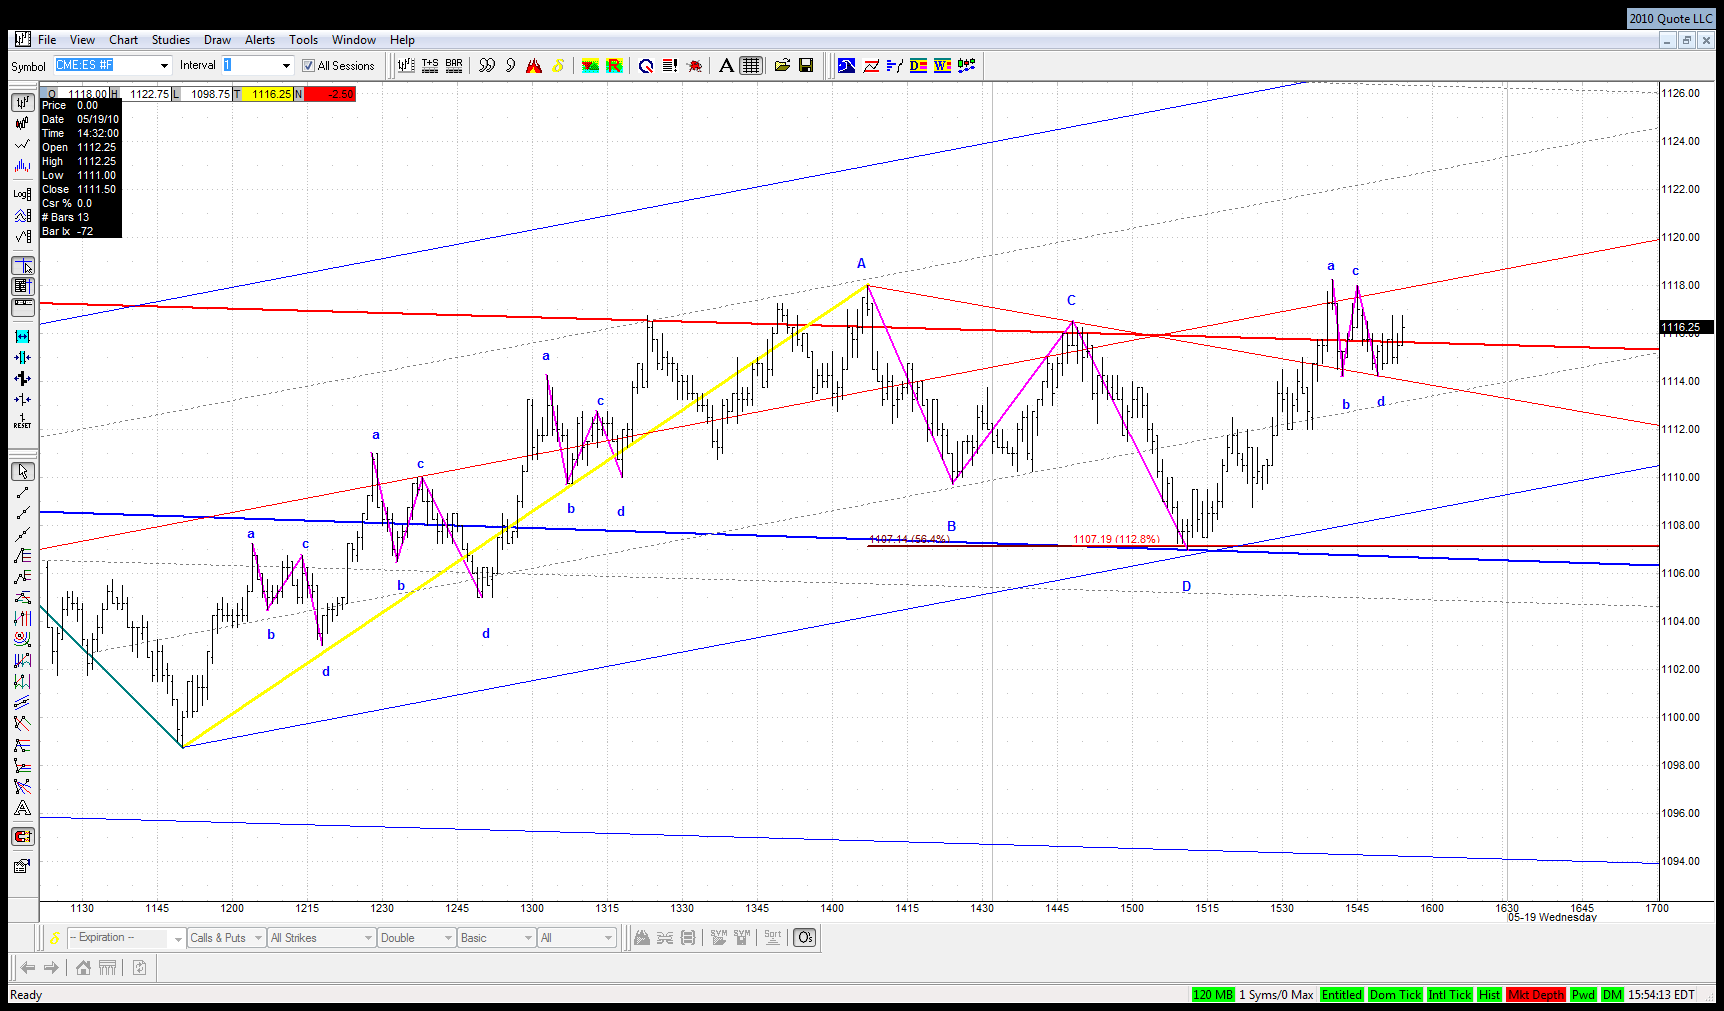
This last one failed meaning that correction of at least the first leg off the big ABCD has already started
JI
jimkane
Rep: 3,058
Posts: 33,089
On a day like this, when you see early on it may be like this (we had a day like this not too long ago), one can look to just bang each one of them just to where they start to fade, and then wait for the next one. It's a 'sub-strategy' I keep in mind when I see this developing.
JA
jarek
Rep: 94
Posts: 3,474
Look at what happened to gold today. Looks like yesterday's spike was nothing more than a shakeout of shorts