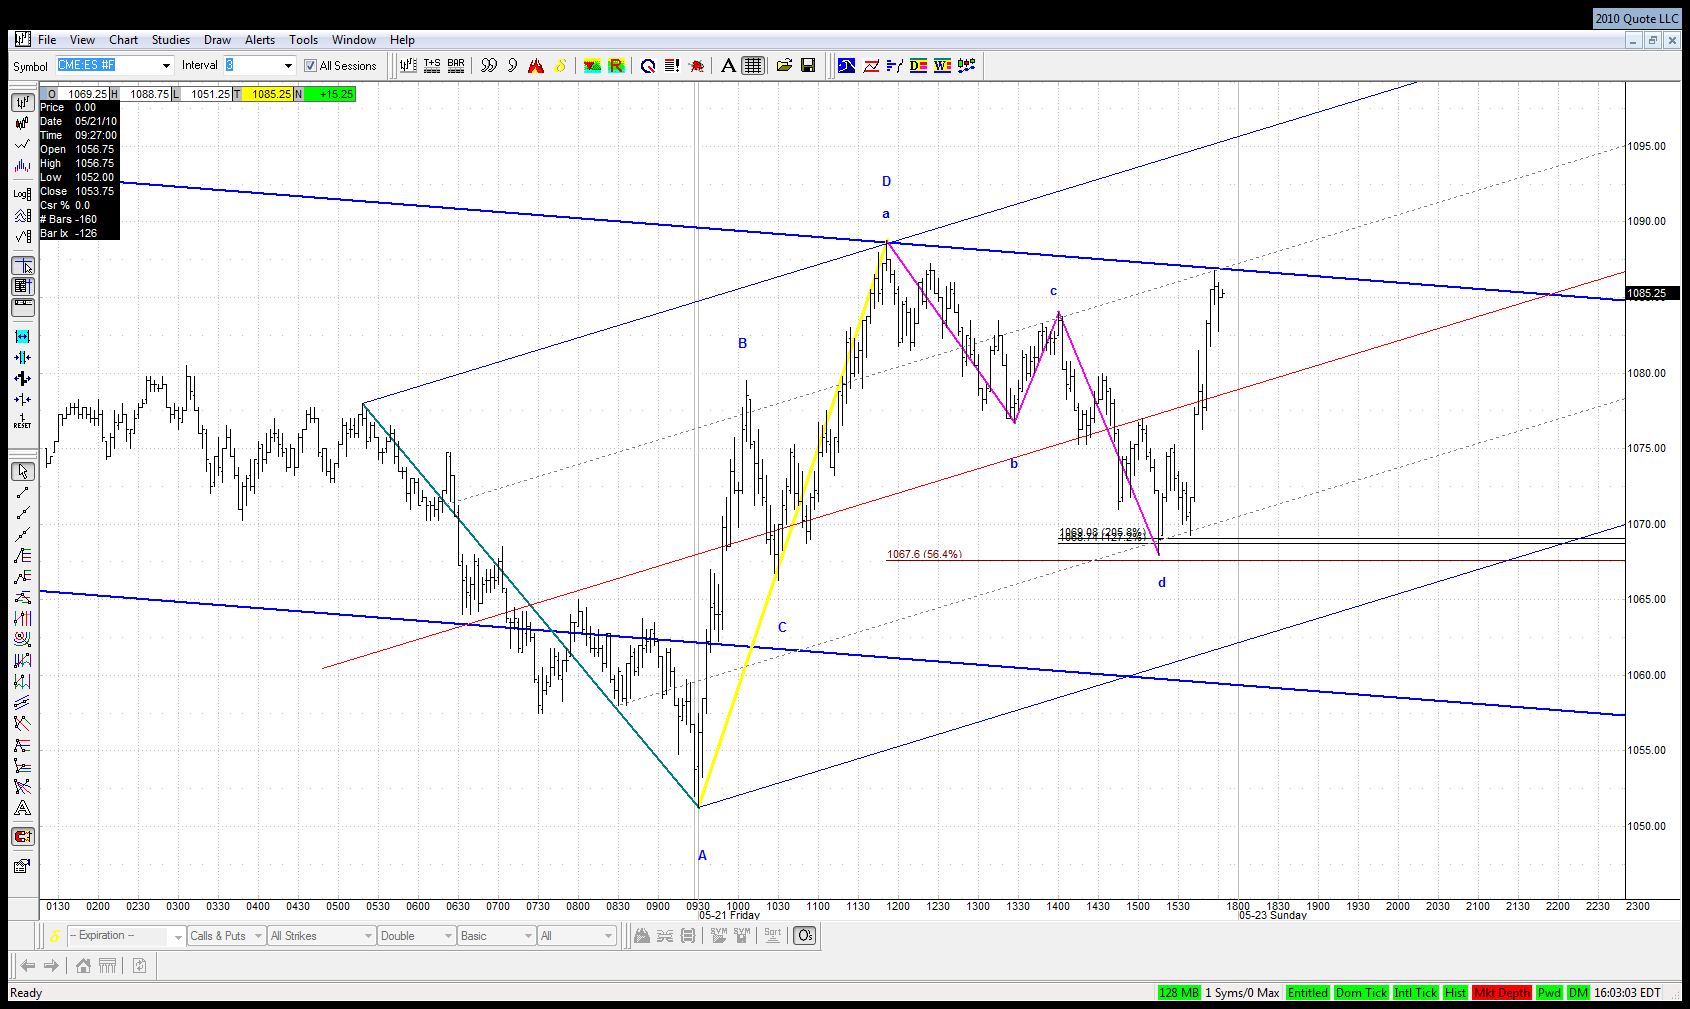
Click image for original size
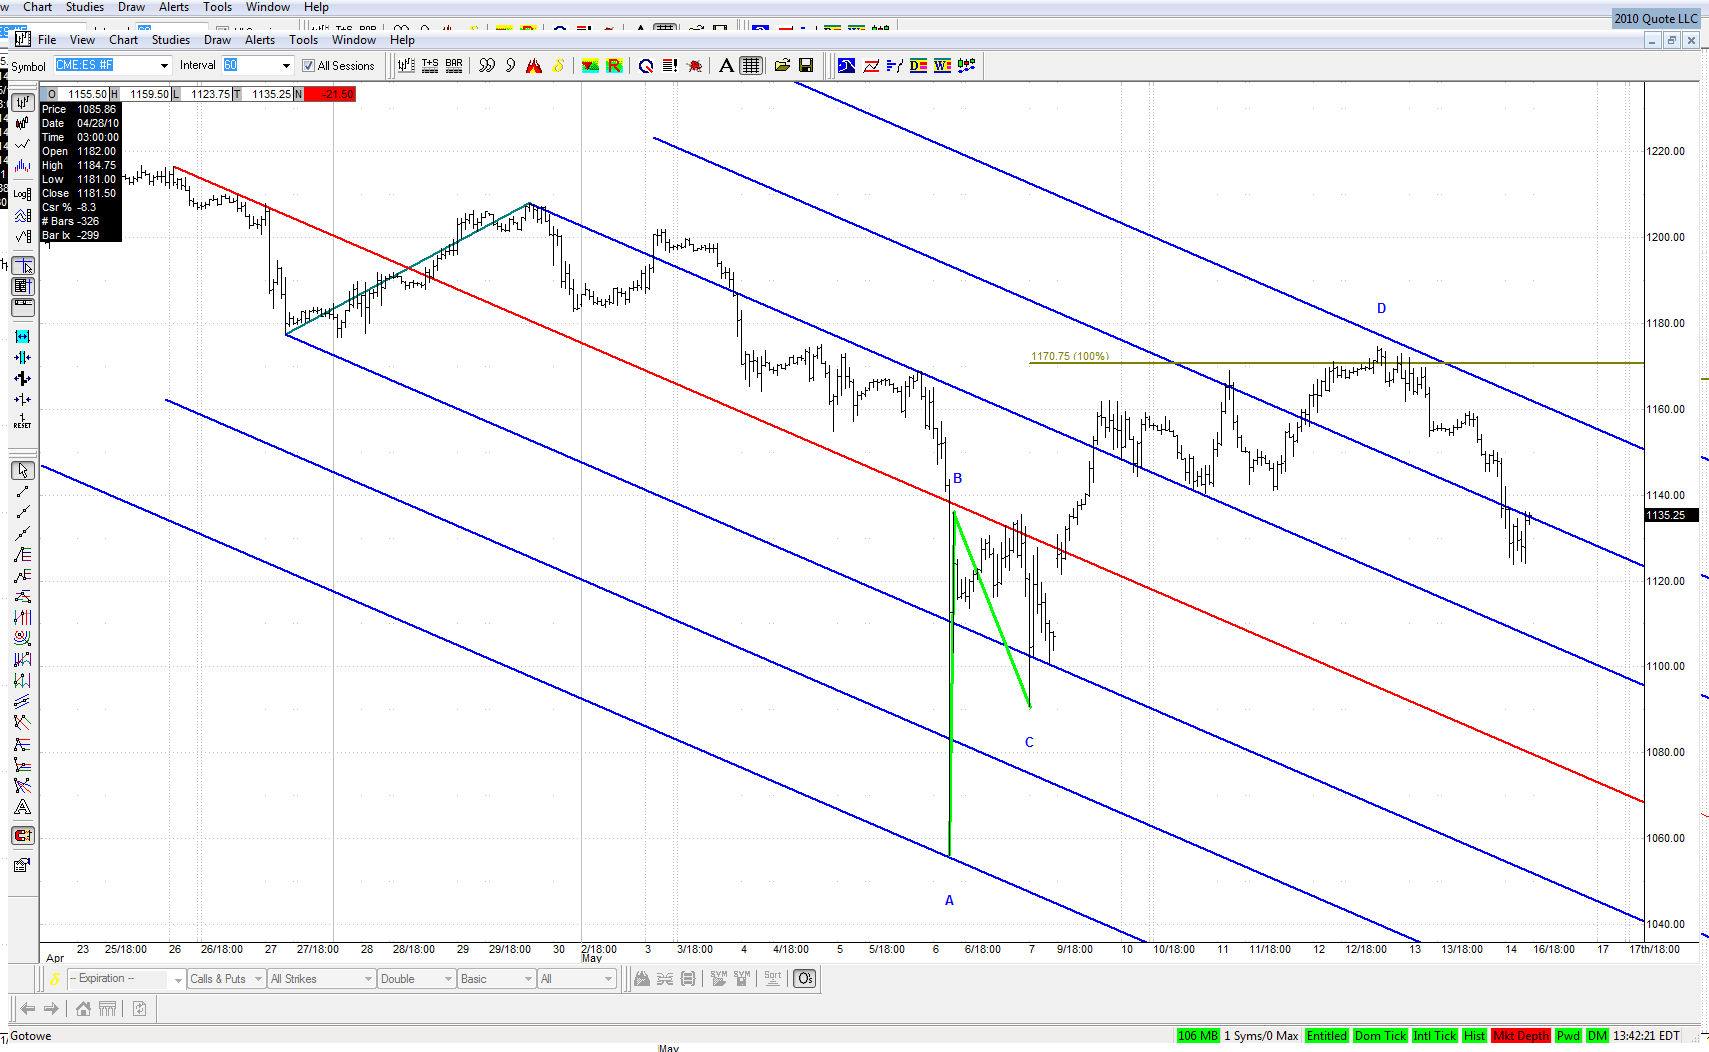
Timewise it doesn't look good because it rarely happens in a zigzag that CD leg lasts 80 times longer that AB leg. But if it comes to proportions - it's almost perfect: AB and CD legs are nearly equal and whole ABCD retraces between .685 and .786 of the preceding leg down from the top.
Initially I thought that whole zigzag should finish at May 11th high. Now I see that high as a C point of a W4 correction in the CD leg:
Click image for original size
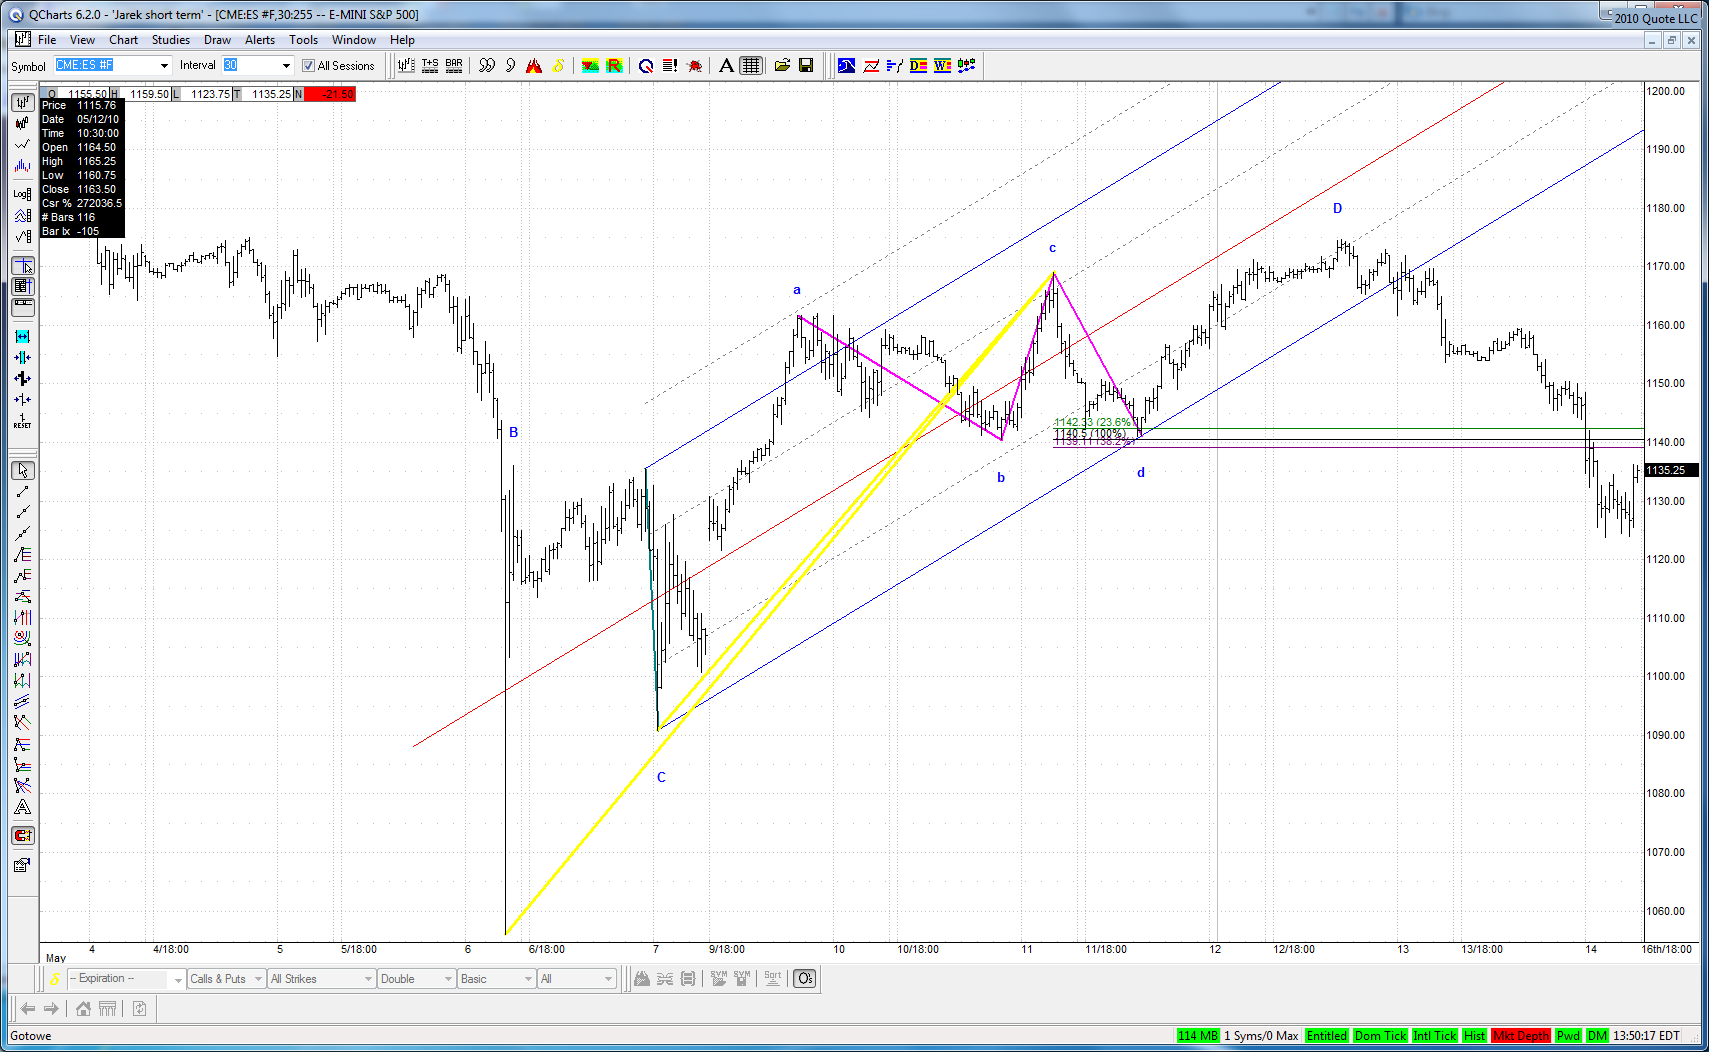
The behaviour of the market in the next couple of days should help us jugde whether this interpretation is correct. This is rather important because in such case we should expect a drop to at least 1020 (1.272 external retracement of the ABCD) and probably much lower if W3 down has just started.