ES Short Term Trading 5-18-10
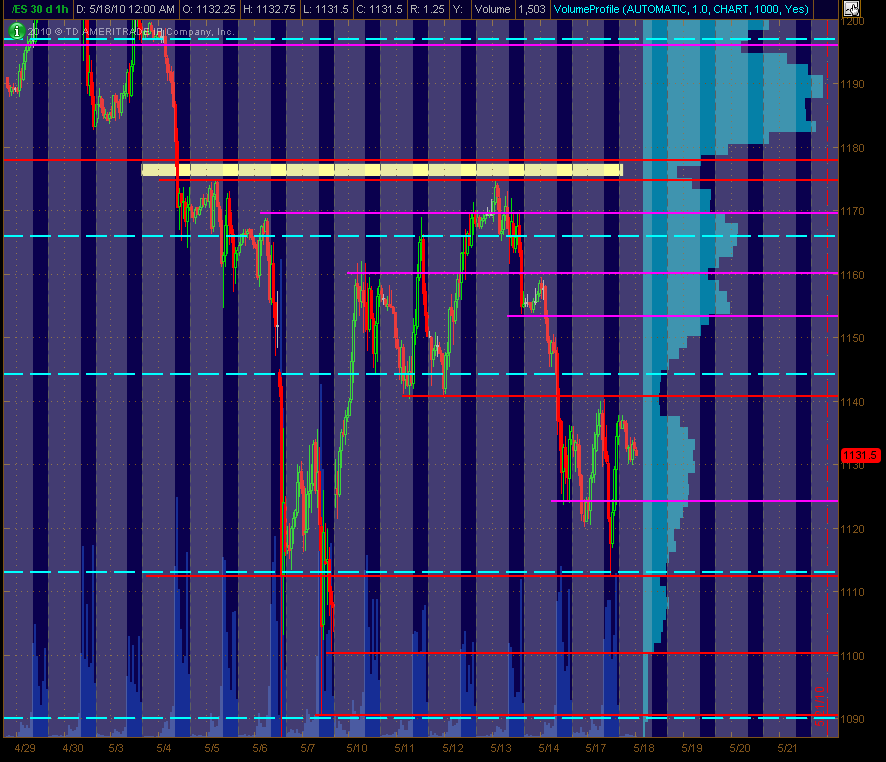
Here's my 30m ES chart with S/R levels based on price action ... Red are potential significant levels with Magenta as semi-significant ones. The Cyan dashed lines are the Weekly Pivots. This is a map for trading coming into Tuesday for me. There's also a Volume Provile of the past 30 trading days shown on the right side of the chart. Hope it's helpful to all.
Click image for original size
sure seems like this is gonna be a big descision area for today this 29.50....a failure to hold will go get that 18 - 20 and possibly quickly.....standing aside still..lets hope some of the air traders step up and go retest the36 area....not air there just a key point too..
If it can hold then we have achance to go back up to 44 again today...but it will back and fill a bunch..
If it can hold then we have achance to go back up to 44 again today...but it will back and fill a bunch..
For example if everyone is reporting **** numbers and the market persists up, no matter how much I might want to be bearish or believe the market is primed to sell off I won't because the market continues up. I find this to be a very important indicator if understood. Which I don't fully but the more I watch and try to anticipate how the market will react to upcoming news based on the chart position the easier it is. In my opinion if the news we get is negative right now and the market remains flat or positive I would look to that as bullish behavior given the way the chart looks. When the market sold off from 1217 down to 1180. The Fed was reporting the next day. It was fairly certain they were going to keep the rates the same. Which the market would Buy into. So it was opportunity to add to your short position if you already had one and believed it was still poised to go down. I'm still learning how to understand how the market will anticipate news and buy and sell into support and resistance. So if you believe the market is bullish right now I would look for the market to react to negative news by selling down to support and then rallying up to have bullish closes. I'm long right now. I could be wrong and if so another lesson learned in trying to blend everything.
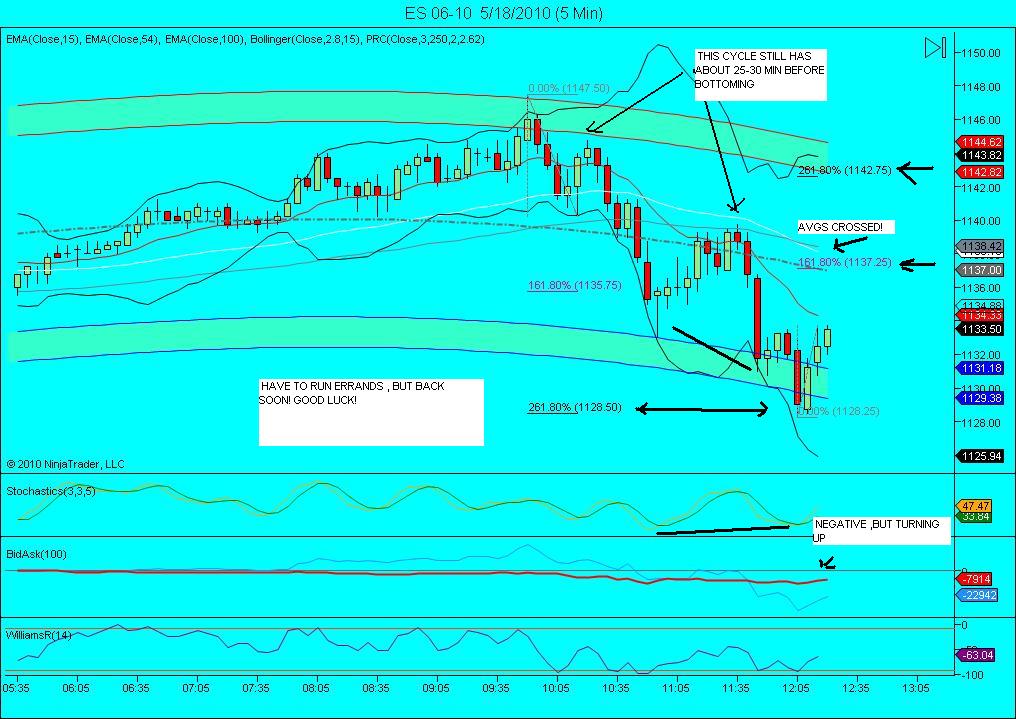
bare bones first initial move off the 1128.25 low is to 1131.75, so 1134 seems like a decent target.. course i'll likely exit earlier as i usually do!
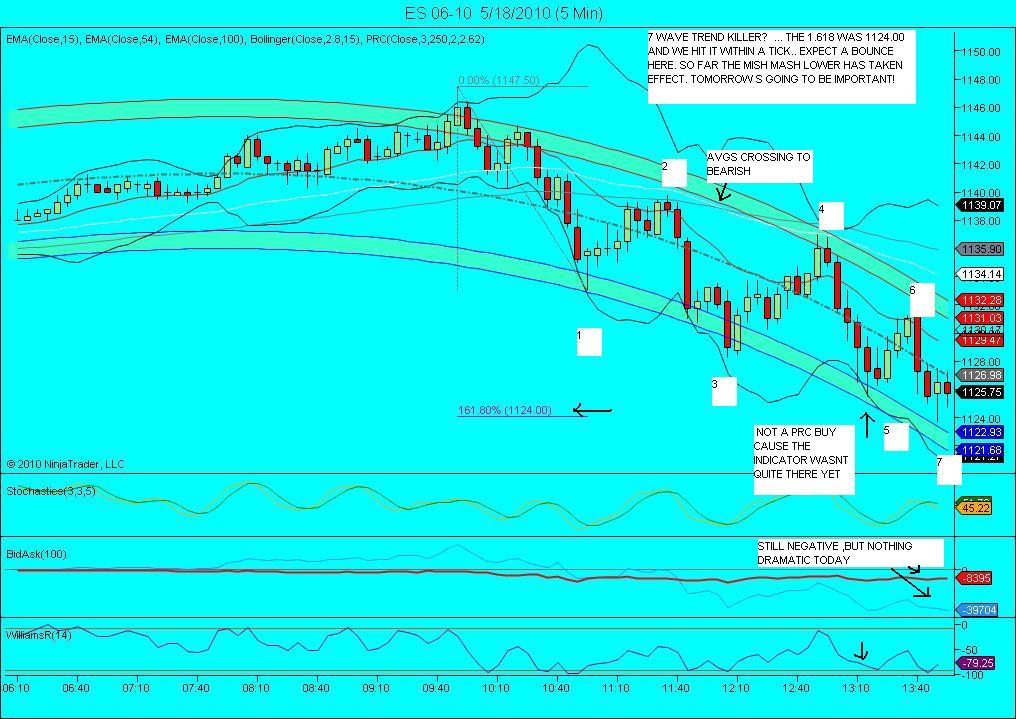
Wow! things move so fast its hard to trade and post! out at 33! plus 4 on 2 es! That of course was a 5 min prc buy. wow! Now can they go to the 2.618? i think around 37.50? ....
Click image for original size
THIS IS A RUMOR. I haven't seen it reported but it did coincide with the very recent drop.
drop from 36 may have coincided with rumors that germany to ban short-selling on some bonds
now I see it or some sort of headline on reuters
http://www.reuters.com/article/idUSBAT00546220100518
drop from 36 may have coincided with rumors that germany to ban short-selling on some bonds
now I see it or some sort of headline on reuters
http://www.reuters.com/article/idUSBAT00546220100518
just now, cnbc has picked up about the short-sell ban in germany
Hey Bruce. I just want to let you know that I will be sending you an email shortly after I write this. Please check your junk box. No rush.
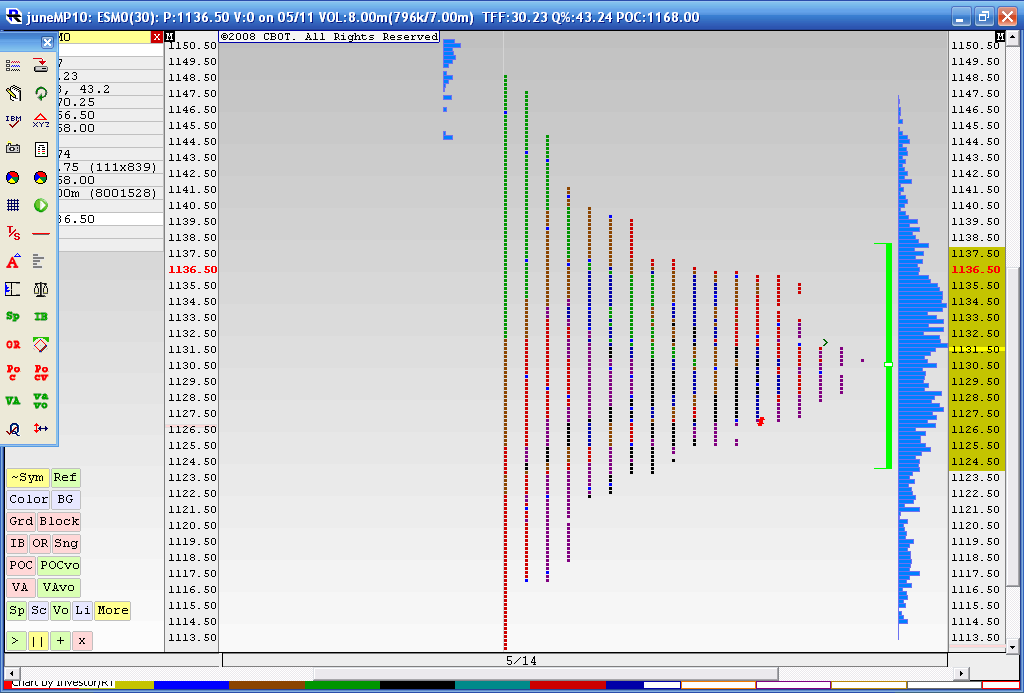
a look at the symetric distributionthat is shaping up over Friday, Monday and todays trade.....these don't last forever and eventually snap.....big node still in the 28 - 31 area and at the 24 .50 area we are at the lower value area based on Volume....
Click image for original size
Click image for original size
I got killed today. I was to scared to pull the trigger when I should made up for it pulling it when I shouldn't. Same old mistake
Emini Day Trading /
Daily Notes /
Forecast /
Economic Events /
Search /
Terms and Conditions /
Disclaimer /
Books /
Online Books /
Site Map /
Contact /
Privacy Policy /
Links /
About /
Day Trading Forum /
Investment Calculators /
Pivot Point Calculator /
Market Profile Generator /
Fibonacci Calculator /
Mailing List /
Advertise Here /
Articles /
Financial Terms /
Brokers /
Software /
Holidays /
Stock Split Calendar /
Mortgage Calculator /
Donate
Copyright © 2004-2023, MyPivots. All rights reserved.
Copyright © 2004-2023, MyPivots. All rights reserved.