ES Short Term Trading 5-18-10
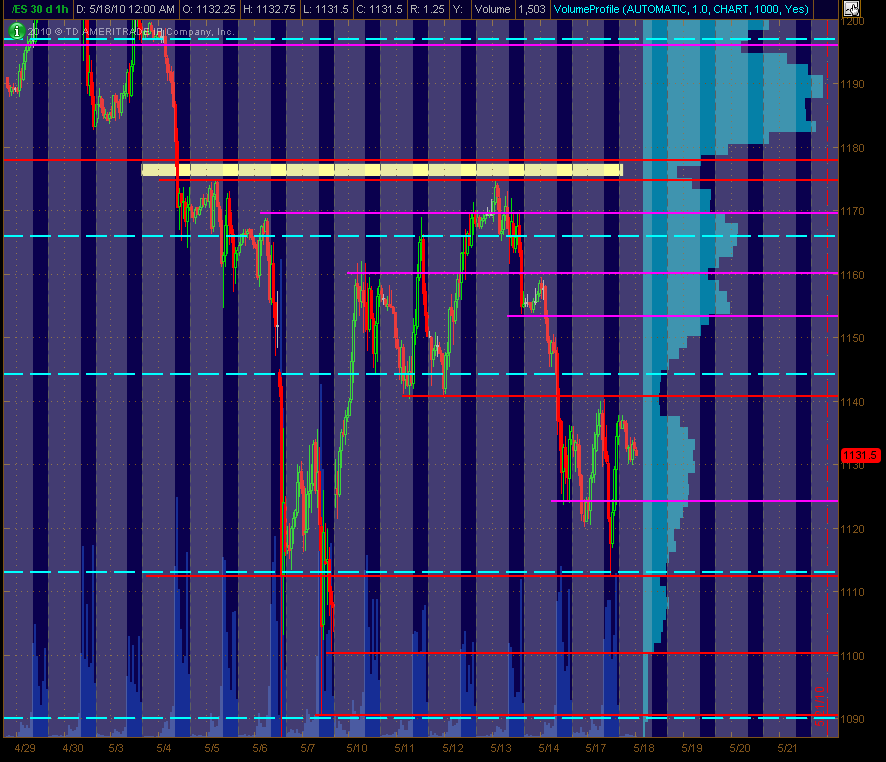
Here's my 30m ES chart with S/R levels based on price action ... Red are potential significant levels with Magenta as semi-significant ones. The Cyan dashed lines are the Weekly Pivots. This is a map for trading coming into Tuesday for me. There's also a Volume Provile of the past 30 trading days shown on the right side of the chart. Hope it's helpful to all.
Click image for original size
for anyone who has read Brooks PA book, looks to me like (5min 24 hour pricesa) there is a small trendline overshoot in place),
description: draw trendline at highs in an ascending market, buying enthusiasm reaches anxiety driven capitulation and price breaks above the (overshoots) the ascending trendline), retracement that follows usually attracts additional buyers and retests H of the overshoot.
5 min trendline (which was overshot) drawn from H at 3:30am H at 8:05.
weakness concided with early reports of SEC findings
cnbc reports that
SEC review of Flash Crash has been released. It will take 30 days before any mandates about new trading rules are implemented,
no details on trading rule changes have been disseminated yet..
cnbc reports that
SEC review of Flash Crash has been released. It will take 30 days before any mandates about new trading rules are implemented,
no details on trading rule changes have been disseminated yet..
Thank you Toby Crabel...no brainer today...high $ticks on the 15 minute ORB that created air pocket to the upside....so we take the short...
I liked Al's book for reference, good ideas...I would have liked to see him actually trade it though...still can't fault the guy ....but they should have made the text bigger and put the explanations on the same pages as the chart examples....It would have been a much easier read..
44 .25 will take my runners if they can't take 37 soon...not sure how much they are jerk it around our key 44 - 46 zone
yes..I just pointed that site out for reference thinking you might enjoy it...we'll watch the 20th and see......I wonder if he has a track record of his calls anywhere??
Originally posted by rburns
Bruce Ttheory has been calling for a top May 20. We will see after that date:}
1/2 the gap fillers want that 37 area too....we'll see..as much as I like that number , it won't come easy...they may bring it up first to shake us out
an old mentor use to keep track of how many bars off the 5 minute they made consecutive Lower lows and lower highs.....in a strong trend it was 9 as an extreme.....so we can't expect it to just drop from the sky without back and fill
Bruce, nice trade
Bruce wrote,
"Thank you Toby Crabel...no brainer today...high $ticks on the 15 minute ORB that created air pocket to the upside....so we take the short..."
if you have a little time could you explain, or direct me to topic.
-RE: Brooks, Book was a travesty, and even the definitions in the glossary were/are a joke for the most part. I have found a couple of things I like, the trendline overshoot is one of them, but all in all, I honestly do not think that he can recognize all the formations he claims to have recognized in the afterglow of dry ink on the chart (ex post facto).
The first 15 minutes is considered the "Opening range" for many longer term players.....although popularized by Toby Crabel , he was actually taught the idea from my first mentor...Kent Calhoun ( not Ken)..
I paid that guy $3085 back in 1996 and I'd drive him crazy with questions...he had some ego and that was a lot of cash for me back then ..especially to pay to a vendor
Calhoun got beat up on Misc.invest.futures newsgroup and got fined by the CFTC but he taught me many things.....
Anyway, you will find that these first 15 minute bars can be faded given the right context and targeting the midpoint is fairly safe
so the context for me is the Key zone, the air pockets...the plus 4 from the pitbull thread, the retest of an overnight high after the break out etc...
On the flipside, when they truely break it out, it will keep running into a plus 8 or 10 area in this volatility
Volume is symetric so that 44 is the magnet...we need to see it break and go get an hour range to see if attracts sellers or buyers now...hpefully sellers on the downsdie
Thanks for explanation of OR15.
I have studied OR15m for a few years but I had never correlated $TICK. I don't have crabels book, but a few years ago I bought reprint of TASC articles. ONly rule I semi have been able to follow is after NR7, willing to play 15m breakout, but exit at .618 extension of the 15m OR.
RE today's market, as I have stated, I look at NQ for guidance on whether there is speculative bullishness (NQ outpacing ES) or fear selling (NQ underperforming ES). Today, after first bounce, NQ crapped out. Now I'm scratching my chin.
gap fill sure looks likely
I'm flat at the gap...this was second campaign....short..they have the 29.50 below but I'm not convinced of this selling as true
38.75 needs work and air above...
38.75 needs work and air above...
I got killed today. I was to scared to pull the trigger when I should made up for it pulling it when I shouldn't. Same old mistake
Emini Day Trading /
Daily Notes /
Forecast /
Economic Events /
Search /
Terms and Conditions /
Disclaimer /
Books /
Online Books /
Site Map /
Contact /
Privacy Policy /
Links /
About /
Day Trading Forum /
Investment Calculators /
Pivot Point Calculator /
Market Profile Generator /
Fibonacci Calculator /
Mailing List /
Advertise Here /
Articles /
Financial Terms /
Brokers /
Software /
Holidays /
Stock Split Calendar /
Mortgage Calculator /
Donate
Copyright © 2004-2023, MyPivots. All rights reserved.
Copyright © 2004-2023, MyPivots. All rights reserved.