ES Short Term Trading 5-18-10
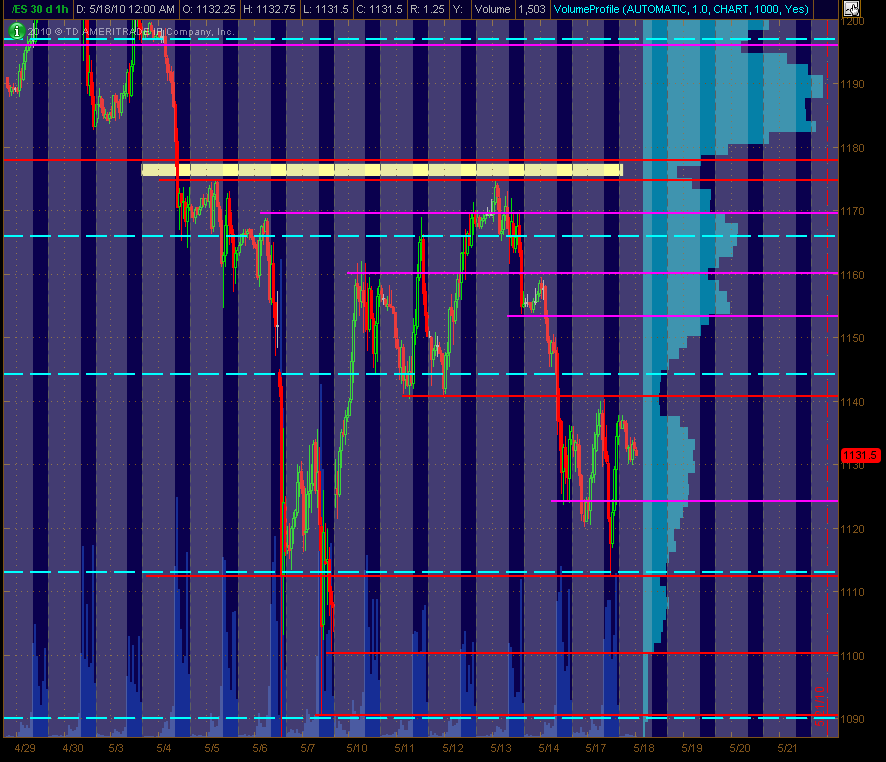
Here's my 30m ES chart with S/R levels based on price action ... Red are potential significant levels with Magenta as semi-significant ones. The Cyan dashed lines are the Weekly Pivots. This is a map for trading coming into Tuesday for me. There's also a Volume Provile of the past 30 trading days shown on the right side of the chart. Hope it's helpful to all.
Click image for original size
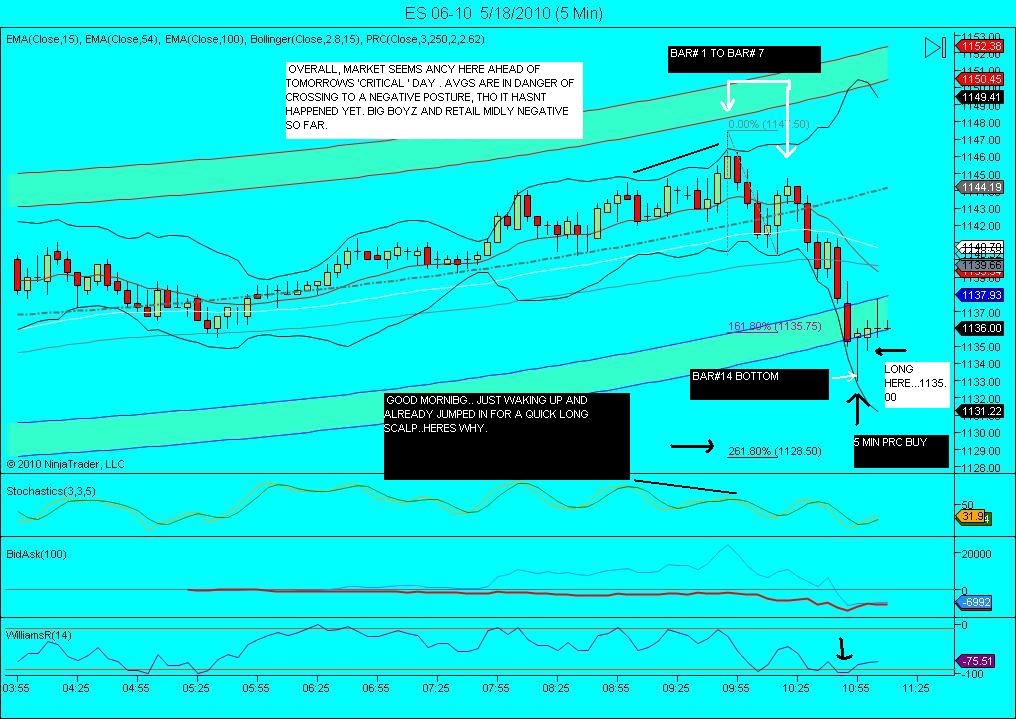
Now thats the way to wake up! Out at 1138.75, plus 3.75 on 2 es
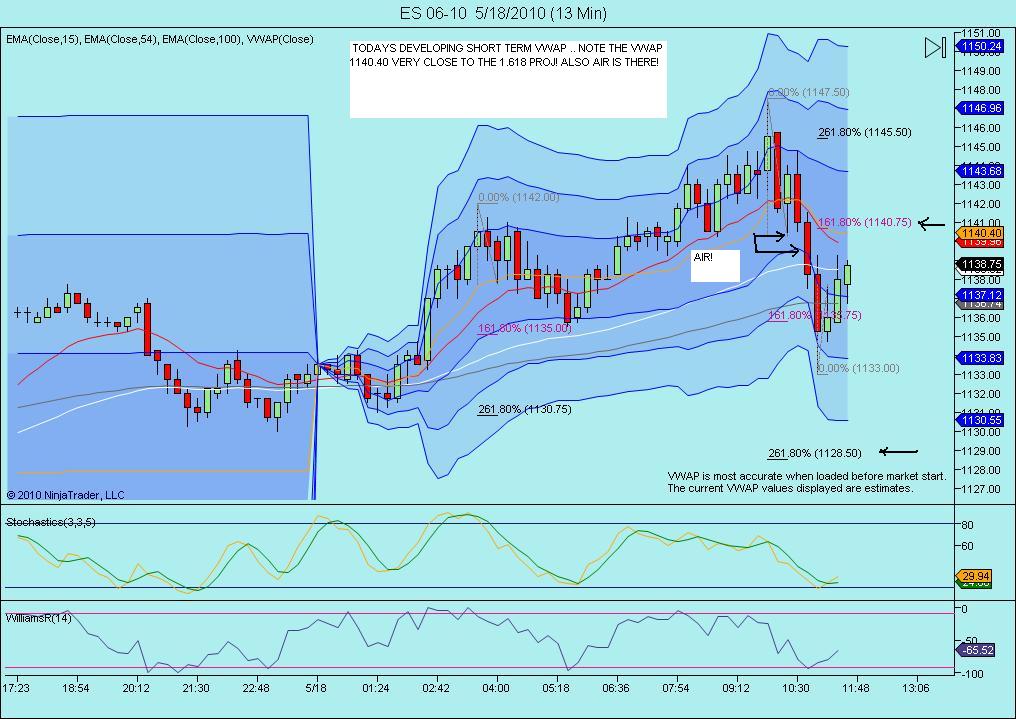
hope somebody took advantage of that 1144 air fill and sold for a quick couple handles! Bruce and i have targeted that for DAYS! T hat was a gimmee!
Click image for original size
Click image for original size
I sure would like to claim bragging rights and say I was long for that but yesterday and the weekend we took a quick trip back to CT to see some family.....
It's very hard to change a trading mentality I believe...at least for me...my short term thinking just doesn't seem to allow me to hold for too long......I guess another trading goal gets added to the list....
Now we need to see what happens on the 29 .50 number if it hits here...no trades as it's past the key fade times...for me
Originally posted by koolblue
hope somebody took advantage of that 1144 air fill and sold for a quick couple handles! Bruce and i have targeted that for DAYS! T hat was a gimmee!
Here's a link to Al Brook's book that Paul9 and BruceM were discussing if anybody is interested:
Reading Price Charts Bar by Bar: The Technical Analysis of Price Action for the Serious Trader
Reading Price Charts Bar by Bar: The Technical Analysis of Price Action for the Serious Trader
Man, i wish i could adopt your longer term trading Bruce! Id be a whole lot richer! lol. anyway i had an order to sell at 1140.50, just under the area i showed on the charts , but missed it! Only got to 39.75. But at least others can see how i think and pick my scalps!.. btw , id also love to see that 1128.50-1129.50 zone , Bruce!
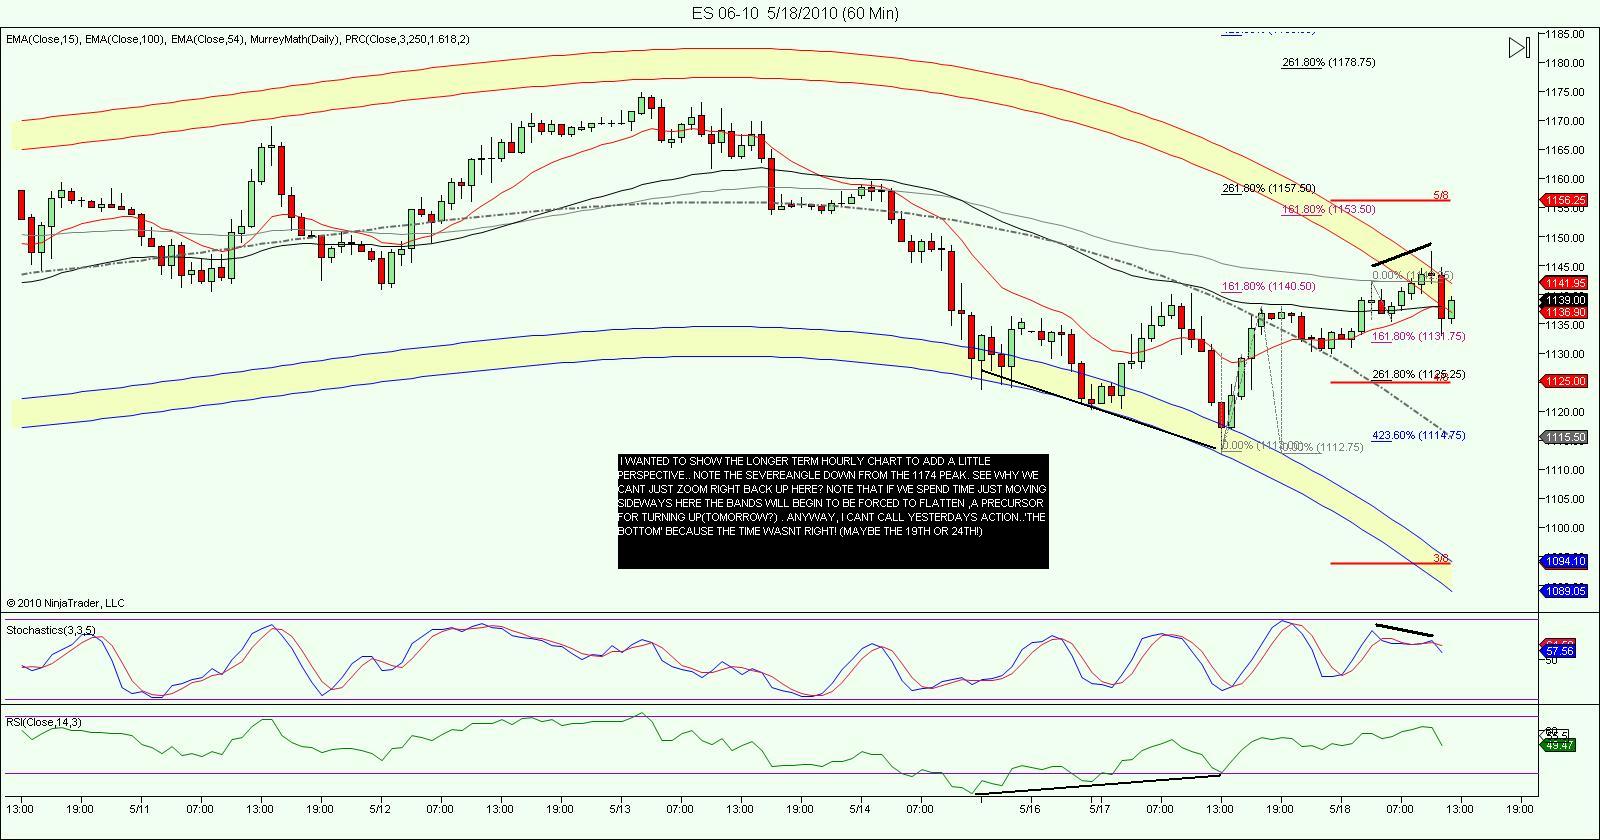
Well this is kinda interesting . were at the prc bands on the hourly, so some retracement can be expected(or at least not shoot up to the mid 50's). on the short term 5 min chart we are at the lower band and its really begun to flatten out after being in a good uptrend off yesterdays low! The avgs are very close to a bearish posture(5 min) and unless we quickly spend a lot of time above 1139 they should go negative. Analysis: Upside seems temporarily capped here , i think we may get up down mish mash(basically sideways to lower) today as the market prepares for its next big move!(likely tomorrow!) . If none of this occurs , i'll deny it!/...lol
long here at 1129.00 (bingo on the 1128.50 projection)
I got killed today. I was to scared to pull the trigger when I should made up for it pulling it when I shouldn't. Same old mistake
Emini Day Trading /
Daily Notes /
Forecast /
Economic Events /
Search /
Terms and Conditions /
Disclaimer /
Books /
Online Books /
Site Map /
Contact /
Privacy Policy /
Links /
About /
Day Trading Forum /
Investment Calculators /
Pivot Point Calculator /
Market Profile Generator /
Fibonacci Calculator /
Mailing List /
Advertise Here /
Articles /
Financial Terms /
Brokers /
Software /
Holidays /
Stock Split Calendar /
Mortgage Calculator /
Donate
Copyright © 2004-2023, MyPivots. All rights reserved.
Copyright © 2004-2023, MyPivots. All rights reserved.