MyPivots
Sign In
MO
MonkeyMeat
Rep: 12,738
Posts: 1,334
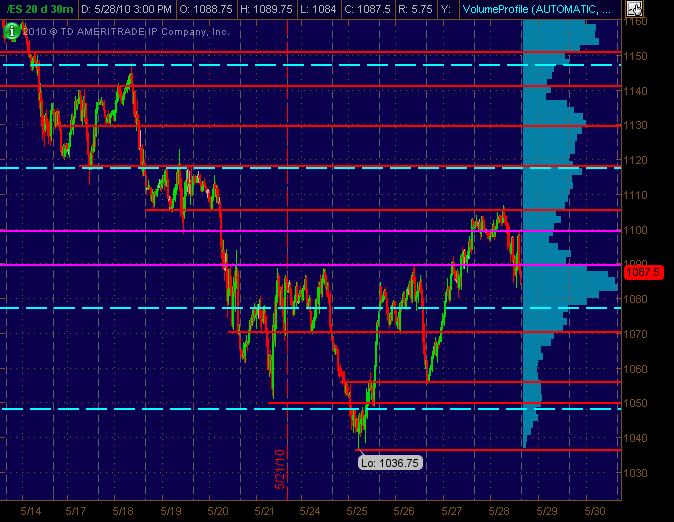
Tossing out two 30m (20 day) charts here with the Red lines as potential significant S/R price action levels with the Magenta lines "semi-significant." The dashed Cyan lines are the Weekly Pivot levels. Also, there's a Volume Profile on the right vertical side of the charts that can be useful.

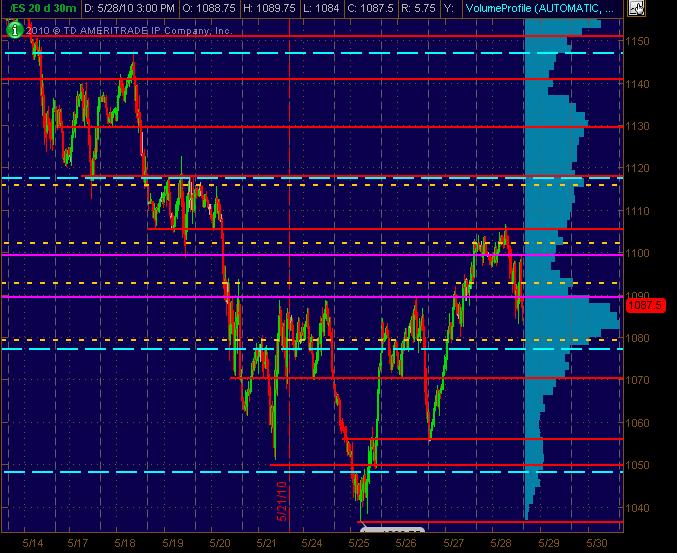
The 2nd chart adds the Daily Pivots in dashed Yellow. Yeah, yeah, yea ... I know, tons of lines so that any will "work." That's not the point. It's a MAP. And it's also about clusters of lines that are in the same price "zone" give or take a few ticks or points (depending on the volatility).


Click image for original size


Click image for original size


Hope y'all find this at least semi-useful and look forward to postings of everyone elses analysis of drawn-charts and significant numbers!
PA
PAUL9
Rep: 14,898
Posts: 1,170
#3: 87.50 was The close of the last regular RTH session, 87.50 today is a gap fill from Friday's close
AK
ak1
Rep: 858
Posts: 740
Shorting 1093
FE
feng456
Rep: 994
Posts: 340
Another ratchet level and more air below...
PT
pt_emini
Rep: 5,707
Posts: 1,940
Originally posted by ak1

And 1093.00 hopefully today


Great call on the 93 level ak1 !

I just went short on the 93.25 number so we will see in the fullness of time
PT
pt_emini
Rep: 5,707
Posts: 1,940
Originally posted by feng456

well in and out in 10 seconds. i wish it was like this all the time...sigh.


Good Job feng !

Now, look at the 30 and 60 minute candles. This is a good example of the trailing stop, timed exit concept I was trying to convey to you over the weekend. Hold the winning trades open and let the candle body fill in... in this case that was a 13 point run from open to close in your favor feng !!!

FE
feng456
Rep: 994
Posts: 340
yea wouldve been nice to hold that long for sure. needs a lot of investigating and backtesting one of these days to fine tune the money management.

Originally posted by pt_emini

Originally posted by feng456

well in and out in 10 seconds. i wish it was like this all the time...sigh.


Good Job feng !

Now, look at the 30 and 60 minute candles. This is a good example of the trailing stop, timed exit concept I was trying to convey to you over the weekend. Hold the winning trades open and let the candle body fill in... in this case that was a 13 point run from open to close in your favor feng !!!


BR
BruceM
Rep: 216,211
Posts: 19,895
so far that looks like a failed hour breakout into that third ratchet, I expect 87.50 to at least fill in
BR
BruceM
Rep: 216,211
Posts: 19,895
so Feng as long as we can add and subtract we can make money...87.50 plus 6.25 is 93.75.....lots of other numbers there too...it all fits together

Nice fade ak1 and PT!!!
PT
pt_emini
Rep: 5,707
Posts: 1,940
feng, you gotta get past the need to be right & for instant gratification. There's a difference between being right and making money.

I read George Soros quoted recently, and this is a paraphrase on my part:

It doesn't matter how often your right, in the big scheme of things what matters is how much money you made when you were right and how much you lost when you were wrong.
BR
BruceM
Rep: 216,211
Posts: 19,895
it would be a fairly strong trend to not test and fill in 87.50..that would be the second one...the classic stair step trends don't happen too much anymore.
BR
BruceM
Rep: 216,211
Posts: 19,895
AK1,

I can't get the context of your first set of numbers so I will be starting with the second ones you have labeled at that swing low..

The key is that you need to expecting a swing low based on your work so lets assume that.

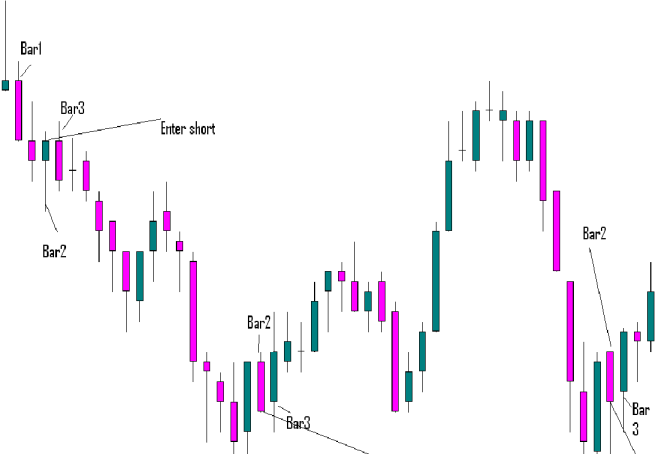
You get the up close which comes right before bar 2. Then bar 2 attempts to test the swing low so you go long on the break of the bar two high which was bar 3. The great thing is that it would take and outside bar down on bar 3 to stop you out on the same bar as your entry.

the next swing low you have labeled does the same thing. the one before bar two gives you the up close, then you getthe test down with bar two, so you go long on the break of bar two's high at bar three..

The two swing highs in between these lows could have been trade in the same way...At those swing highs you get a down close, followed by an upwards test, so you would go short on the break of the low of the up close bar.....hope you see those...it's a simple pattern once you start looking for them...they can work on all time frames
Originally posted by ak1

DT please help so that Bruce's concept can be shared

Click image for original size