ES Short Term Trading 6-1-10
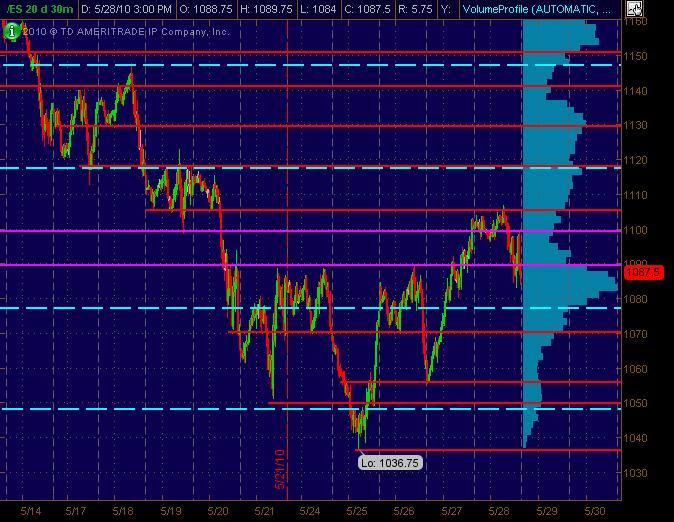
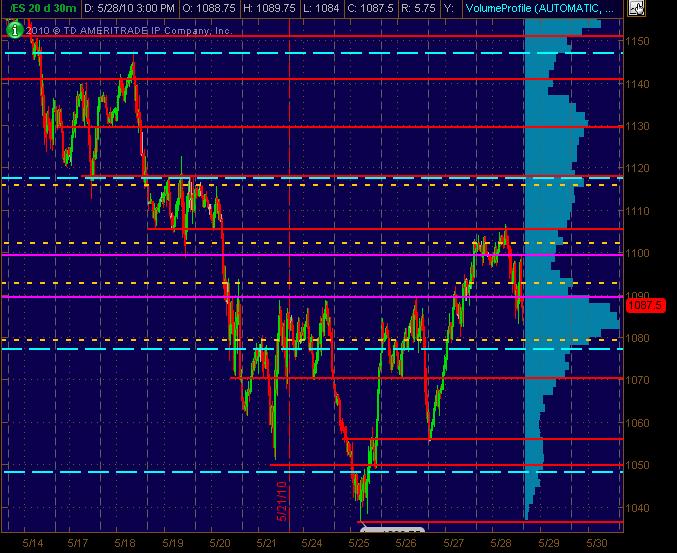
Tossing out two 30m (20 day) charts here with the Red lines as potential significant S/R price action levels with the Magenta lines "semi-significant." The dashed Cyan lines are the Weekly Pivot levels. Also, there's a Volume Profile on the right vertical side of the charts that can be useful.
The 2nd chart adds the Daily Pivots in dashed Yellow. Yeah, yeah, yea ... I know, tons of lines so that any will "work." That's not the point. It's a MAP. And it's also about clusters of lines that are in the same price "zone" give or take a few ticks or points (depending on the volatility).
Hope y'all find this at least semi-useful and look forward to postings of everyone elses analysis of drawn-charts and significant numbers!
The 2nd chart adds the Daily Pivots in dashed Yellow. Yeah, yeah, yea ... I know, tons of lines so that any will "work." That's not the point. It's a MAP. And it's also about clusters of lines that are in the same price "zone" give or take a few ticks or points (depending on the volatility).
Click image for original size
Click image for original size
Hope y'all find this at least semi-useful and look forward to postings of everyone elses analysis of drawn-charts and significant numbers!
Thanks Bruce, low of the highest bar or the low of the 1st 5 min red bar. And high of the lowest bar or high of the 1st green bar. Please clarify
Yipee 1076, so the hunch paid off and the error is corrected
let me look at your chart but in general you want to sell the low of a green bar ...as the buying pressure gets exhausted on that last test up ...when hunting for a swing high
when looking for a swing low you want to get an up close bar and then a downward test and a down close bar...you would buy above the high of the down close bar...hope I'm not messing u up
when looking for a swing low you want to get an up close bar and then a downward test and a down close bar...you would buy above the high of the down close bar...hope I'm not messing u up
Thanks Bruce, low of the highest bar or the low of the 1st 5 min red bar. And high of the lowest bar or high of the 1st green bar. Please clarify
there are variations AK1...if you get a swing high but it closes poorly you can sell that low too
bruce i did read your suggestions. i hadnt slept for 24 hours so had to do that for a bit...
Sorry it took me so long to get those charts converted to images and upload them.
It's fairly easy to do if you need to do it ak1 or anyone else. There's a great free image editing program called Paint.Net:
http://www.getpaint.net/
Install that and then start that program. Once you've copied or cut an image into the clipboard just paste it into that program. Then click File > Save and give it a name. Then just use the green upload bar below the Message edit area to upload the image. You can PM me directly if you have any problems with it.
Thanks DT, looking forward to your input Bruce
AK1,
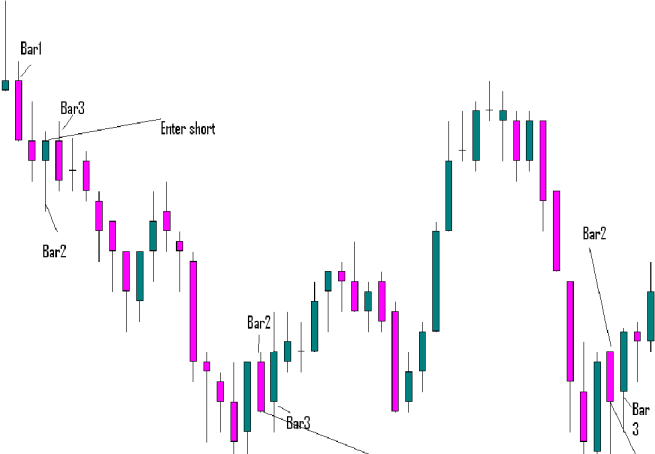
I can't get the context of your first set of numbers so I will be starting with the second ones you have labeled at that swing low..
The key is that you need to expecting a swing low based on your work so lets assume that.
You get the up close which comes right before bar 2. Then bar 2 attempts to test the swing low so you go long on the break of the bar two high which was bar 3. The great thing is that it would take and outside bar down on bar 3 to stop you out on the same bar as your entry.
the next swing low you have labeled does the same thing. the one before bar two gives you the up close, then you getthe test down with bar two, so you go long on the break of bar two's high at bar three..
The two swing highs in between these lows could have been trade in the same way...At those swing highs you get a down close, followed by an upwards test, so you would go short on the break of the low of the up close bar.....hope you see those...it's a simple pattern once you start looking for them...they can work on all time frames
Originally posted by ak1
DT please help so that Bruce's concept can be shared
Click image for original size
Emini Day Trading /
Daily Notes /
Forecast /
Economic Events /
Search /
Terms and Conditions /
Disclaimer /
Books /
Online Books /
Site Map /
Contact /
Privacy Policy /
Links /
About /
Day Trading Forum /
Investment Calculators /
Pivot Point Calculator /
Market Profile Generator /
Fibonacci Calculator /
Mailing List /
Advertise Here /
Articles /
Financial Terms /
Brokers /
Software /
Holidays /
Stock Split Calendar /
Mortgage Calculator /
Donate
Copyright © 2004-2023, MyPivots. All rights reserved.
Copyright © 2004-2023, MyPivots. All rights reserved.