ES Short Term Trading 6-1-10
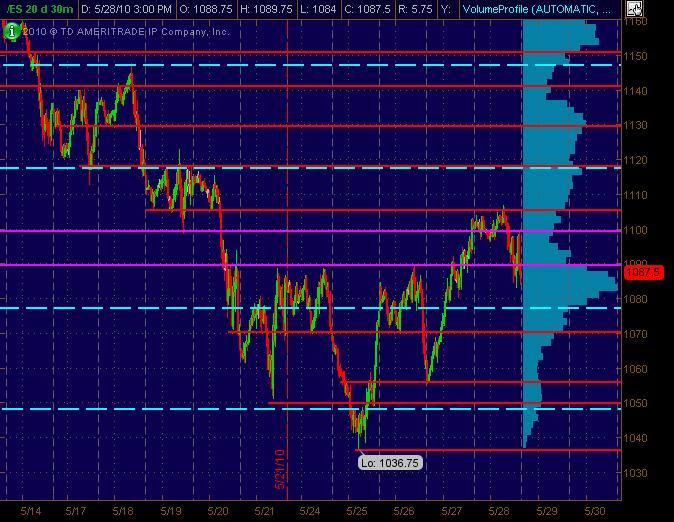
Tossing out two 30m (20 day) charts here with the Red lines as potential significant S/R price action levels with the Magenta lines "semi-significant." The dashed Cyan lines are the Weekly Pivot levels. Also, there's a Volume Profile on the right vertical side of the charts that can be useful.
The 2nd chart adds the Daily Pivots in dashed Yellow. Yeah, yeah, yea ... I know, tons of lines so that any will "work." That's not the point. It's a MAP. And it's also about clusters of lines that are in the same price "zone" give or take a few ticks or points (depending on the volatility).
Hope y'all find this at least semi-useful and look forward to postings of everyone elses analysis of drawn-charts and significant numbers!
The 2nd chart adds the Daily Pivots in dashed Yellow. Yeah, yeah, yea ... I know, tons of lines so that any will "work." That's not the point. It's a MAP. And it's also about clusters of lines that are in the same price "zone" give or take a few ticks or points (depending on the volatility).
Click image for original size
Click image for original size
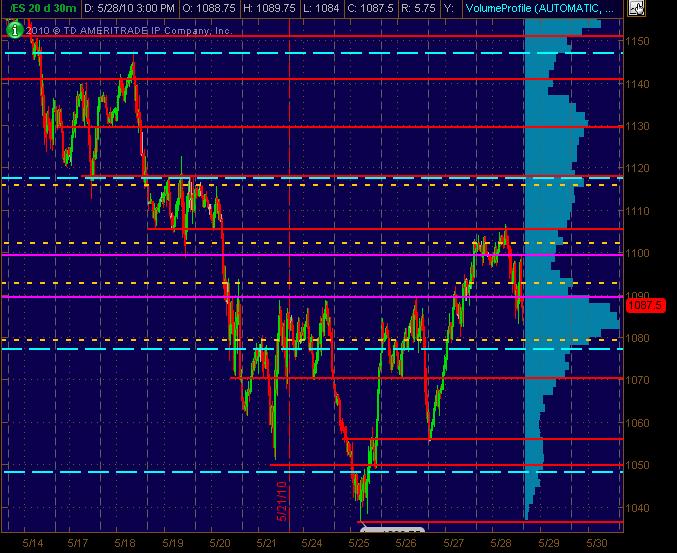
Hope y'all find this at least semi-useful and look forward to postings of everyone elses analysis of drawn-charts and significant numbers!
I know many here like to look at old Points of control etc....this site here may have some good ideas for those who dabble in that...many have probably been there before
http://enthios.com/
http://enthios.com/
Have shorted 1092
cool..ledge at 82.75 too....lets hope we stay neutral and we should get those targets...may be a sturggle...so lots of targets downsdie
SPX 5min. "abandon baby" rare signal...1:30pm est....
Look at their hurry to get to 1076 to complete the error
wahoo !!!! look out below...!! here was the gap..scroll the chart over....trailing now
Click image for original size
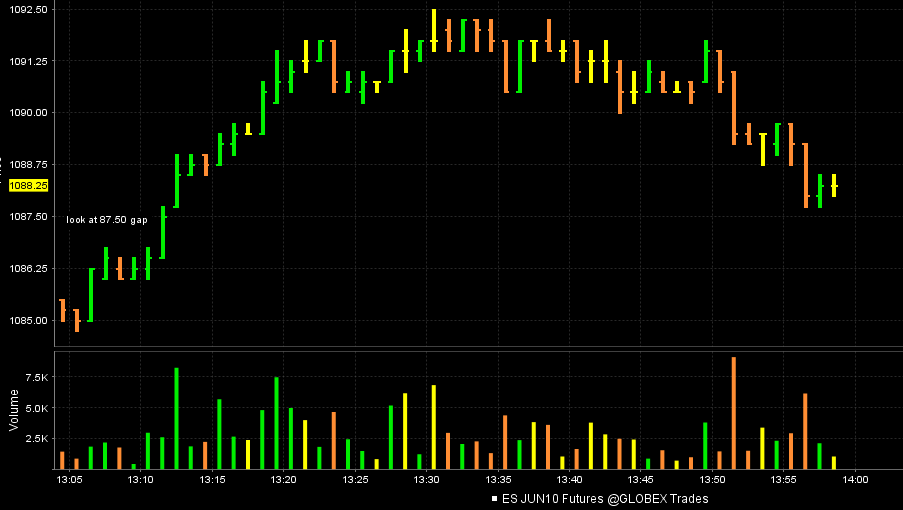
Flat at 1084
this coiled up nicely....only good target for me left is that 82.75 ledge and of course 81.25....if 92.50 holds we should go get 75 and lower...even O/N low but that's a stretch....they want us to suffer inside this 60 minute range
lets not sound the bear alarm just yet
lets not sound the bear alarm just yet
ledges done...below 82.75...perfect...81.50 print...close enough ...for now!!!
AK1,
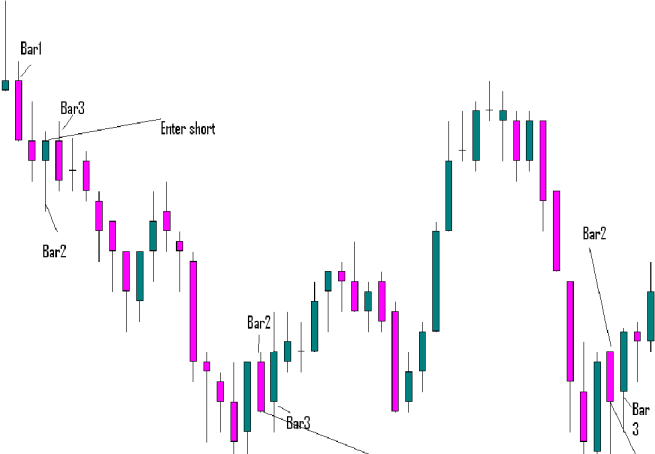
I can't get the context of your first set of numbers so I will be starting with the second ones you have labeled at that swing low..
The key is that you need to expecting a swing low based on your work so lets assume that.
You get the up close which comes right before bar 2. Then bar 2 attempts to test the swing low so you go long on the break of the bar two high which was bar 3. The great thing is that it would take and outside bar down on bar 3 to stop you out on the same bar as your entry.
the next swing low you have labeled does the same thing. the one before bar two gives you the up close, then you getthe test down with bar two, so you go long on the break of bar two's high at bar three..
The two swing highs in between these lows could have been trade in the same way...At those swing highs you get a down close, followed by an upwards test, so you would go short on the break of the low of the up close bar.....hope you see those...it's a simple pattern once you start looking for them...they can work on all time frames
Originally posted by ak1
DT please help so that Bruce's concept can be shared
Click image for original size
Emini Day Trading /
Daily Notes /
Forecast /
Economic Events /
Search /
Terms and Conditions /
Disclaimer /
Books /
Online Books /
Site Map /
Contact /
Privacy Policy /
Links /
About /
Day Trading Forum /
Investment Calculators /
Pivot Point Calculator /
Market Profile Generator /
Fibonacci Calculator /
Mailing List /
Advertise Here /
Articles /
Financial Terms /
Brokers /
Software /
Holidays /
Stock Split Calendar /
Mortgage Calculator /
Donate
Copyright © 2004-2023, MyPivots. All rights reserved.
Copyright © 2004-2023, MyPivots. All rights reserved.