Recognizing Trend Days
Click image for original size

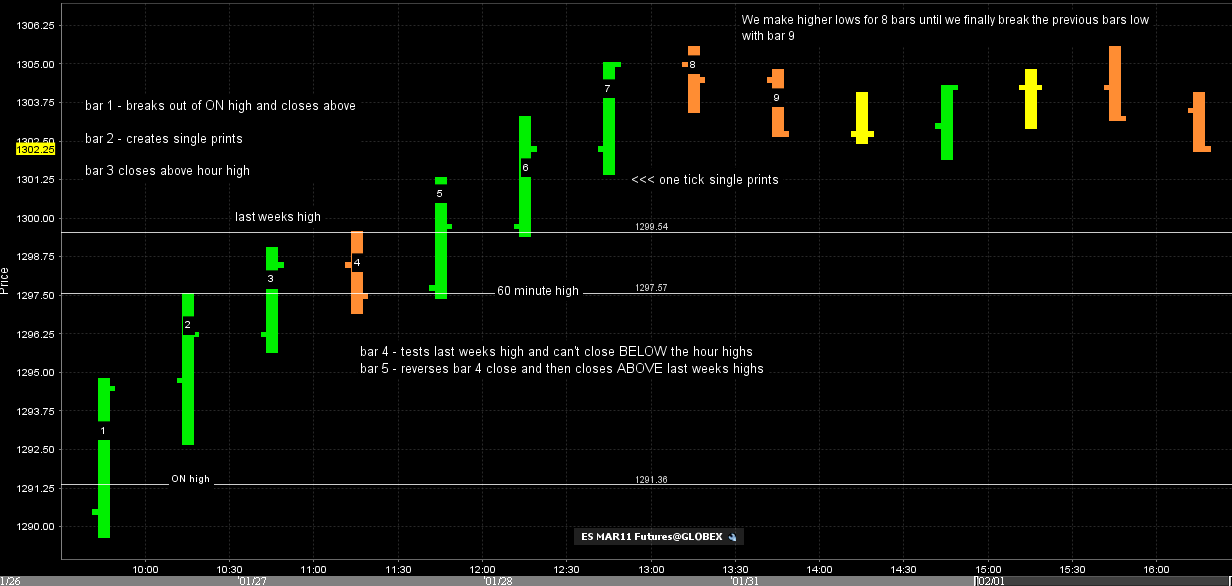
Here's how market wizard Linda Raschke describes trend days:
http://www.traderslog.com/capturing-trend-days/
- Price opens near LoD
- Price closes near HoD
- shallow retracements
- breakout strategies in favour of trend consistently works
Click image for original size
My additional observations of trend days:
- price is moving away from VWAP, which itself is trending
Click image for original size
- TICK is biased, ie. on a downtrend day, there are few +ve TICK extremes, and the ones that do occur are on lower highs.
Click image for original size
By definition, a trend day must be trending for the majority of the day. Therefore, if there is no successful breakout of the 1st hr IB, or if the IB breakout fails, chances are that it is not a trend day.
Click image for original size
I am by no means an expert on trend days (just an observer!). I don't have any mechanical criteria that you can enter into an automated trade system to tell you definitively whether the day will be a trend day or not. Everything is all about probabilities. I look at the 5IB initially, and build on the ongoing assessment of whether it is a trend day or not.
Click image for original size
I invite everyone to take a look at these charts, and study for some common patterns to help better identify trend days...
here is some after the fact notes I made from todays partial trend day....these are common things that happen when we trend early in the day...still difficult to recognize as it unfolds though....this is based on some work I'm doing with the 30 minute closes in the ES
Click image for original size
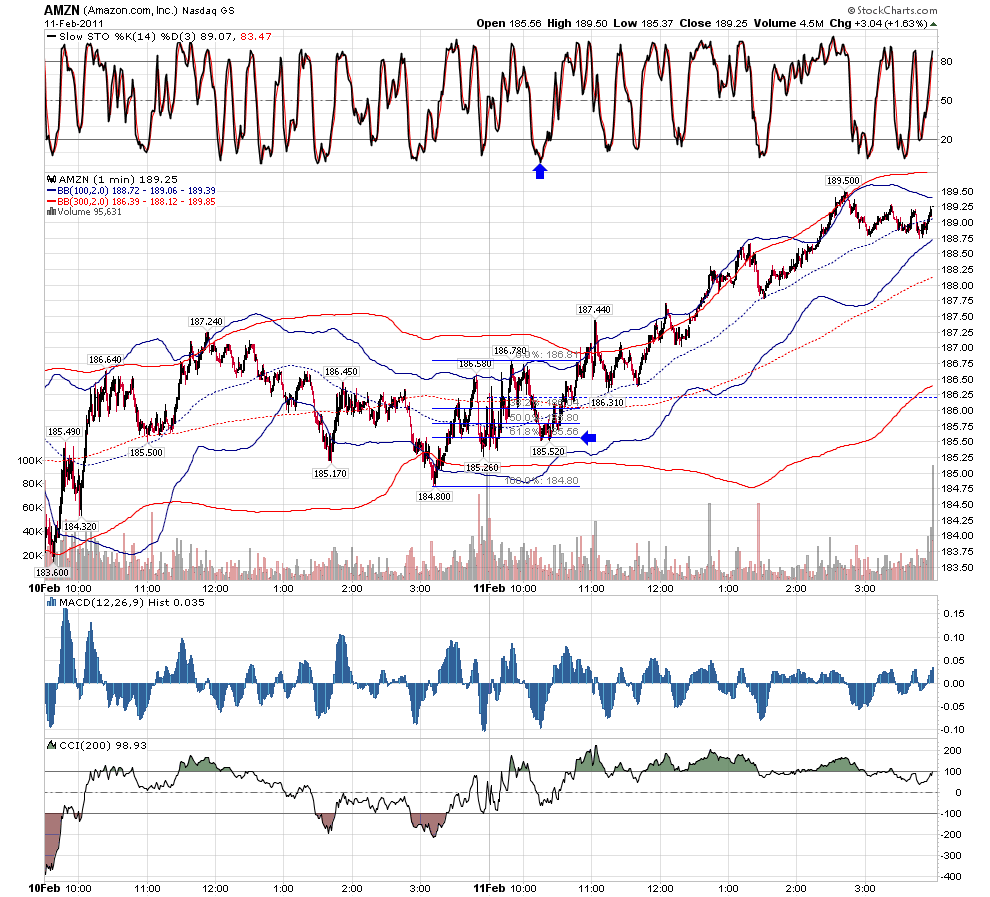
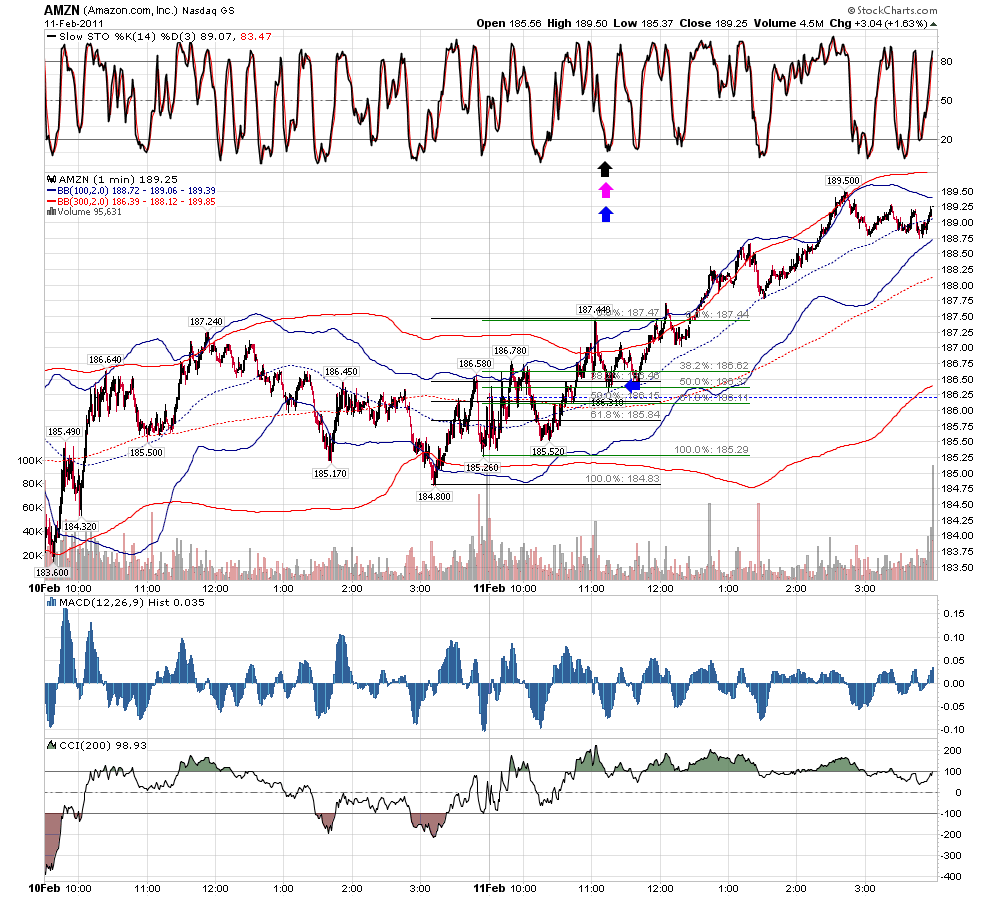
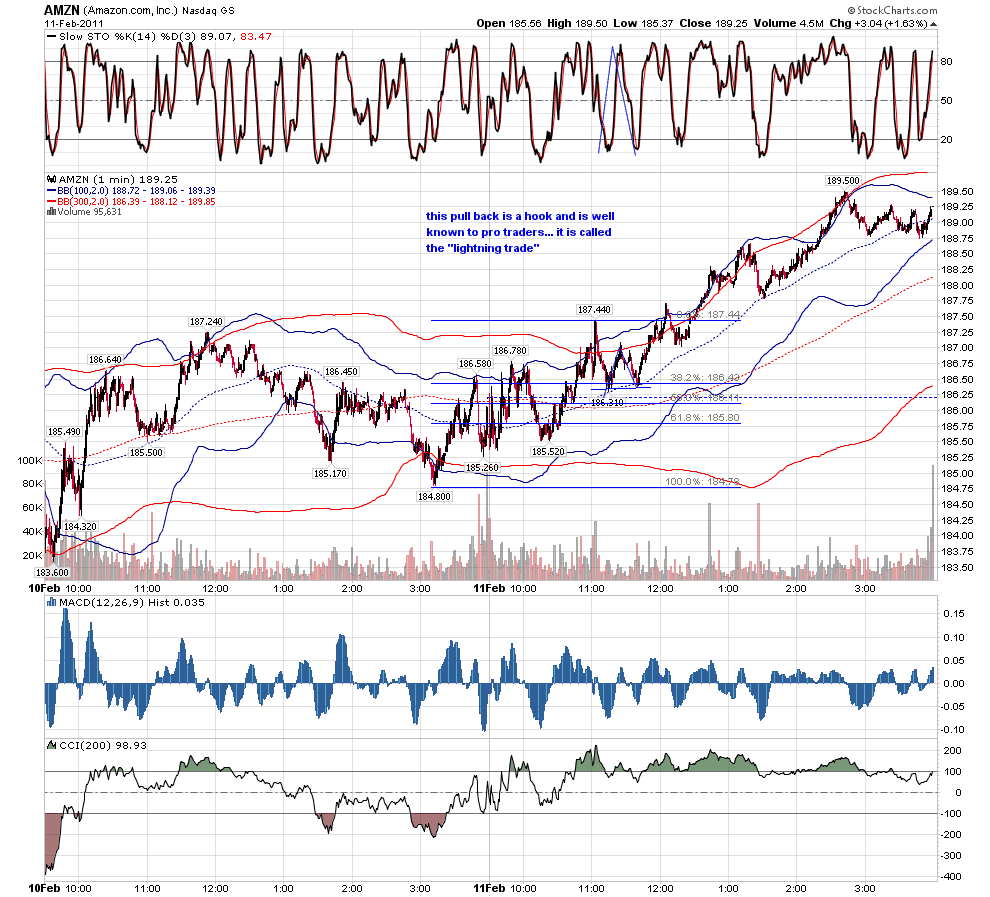
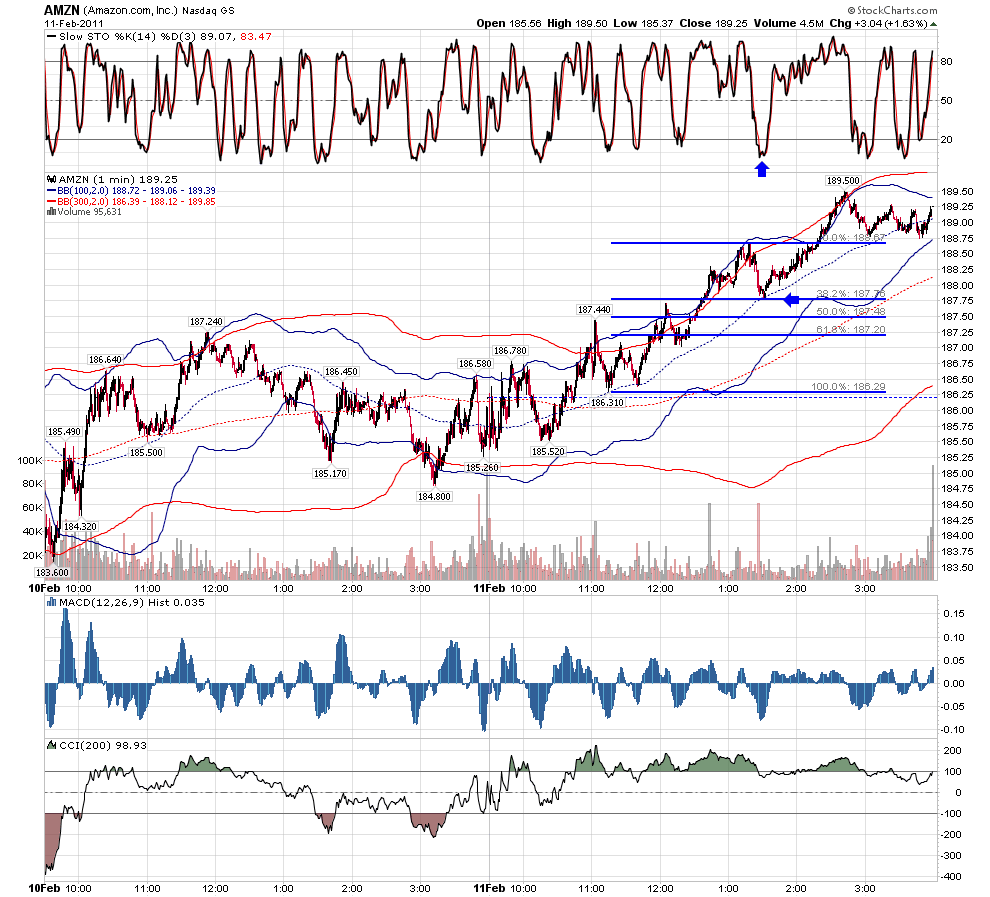
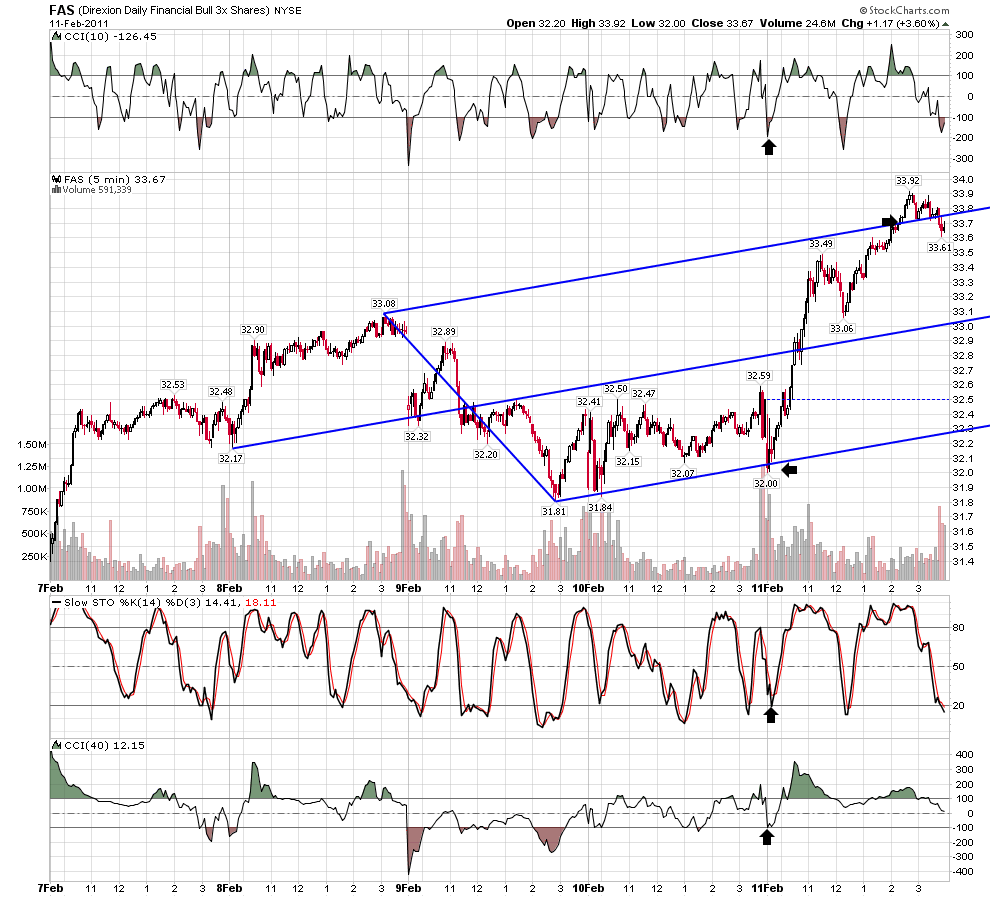
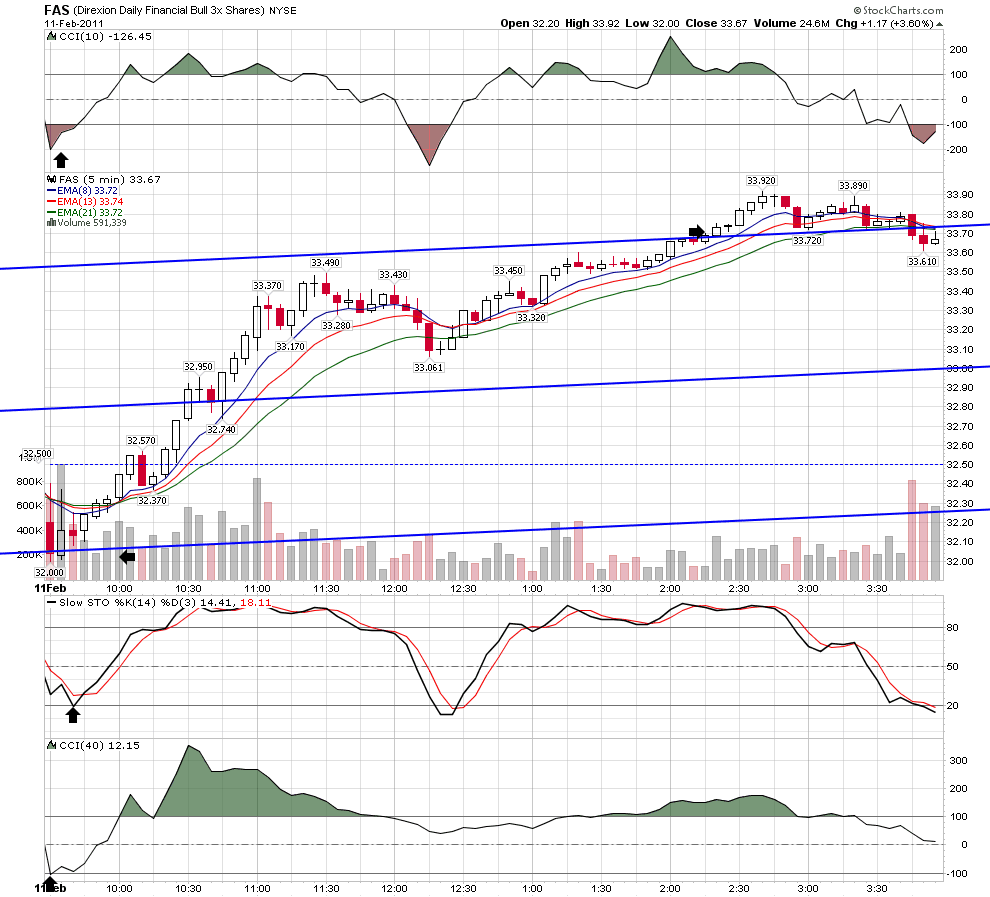
i trade the geometry of the markets... if i am trading what i think is a trend day i want 3 things... a target given by the larger geometry.... on my one minute chart, every pullback to be to fib with the stoch at the same time to be below 20... and as these pullbacks happen, for the ma's to stay aligned on the 5min.charts
Click image for original size
Click image for original size
Click image for original size
Click image for original size
Click image for original size
Click image for original size

Click image for original size
Click image for original size

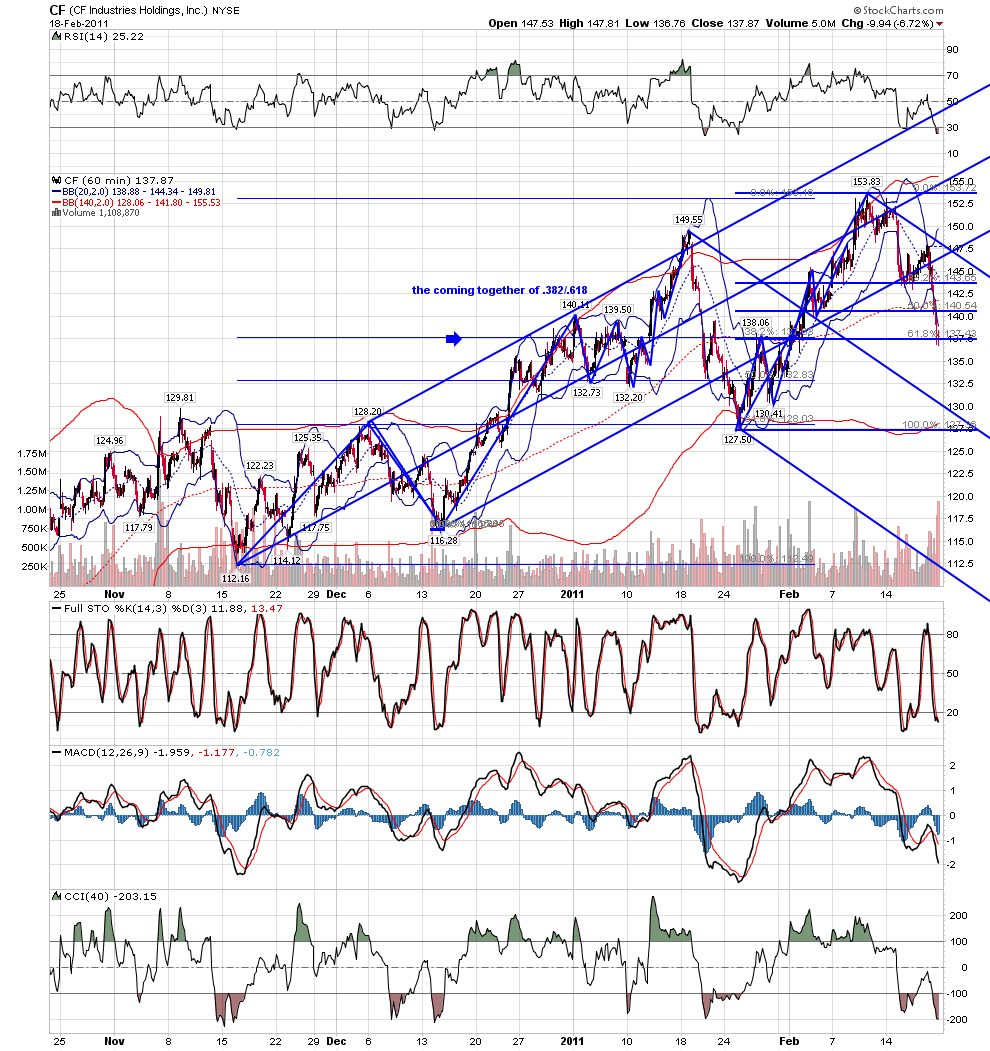
now lets flip the concept... is there enough interest in this topic that i show exactly how what looked like the beginning of a trend day reversed exactly where it did in ABX?and since i know how much traders here hate hindsight, let it be known that i was very vocally pushing the short side in gold stocks from that reversal moment at the kane forum...
Click image for original size

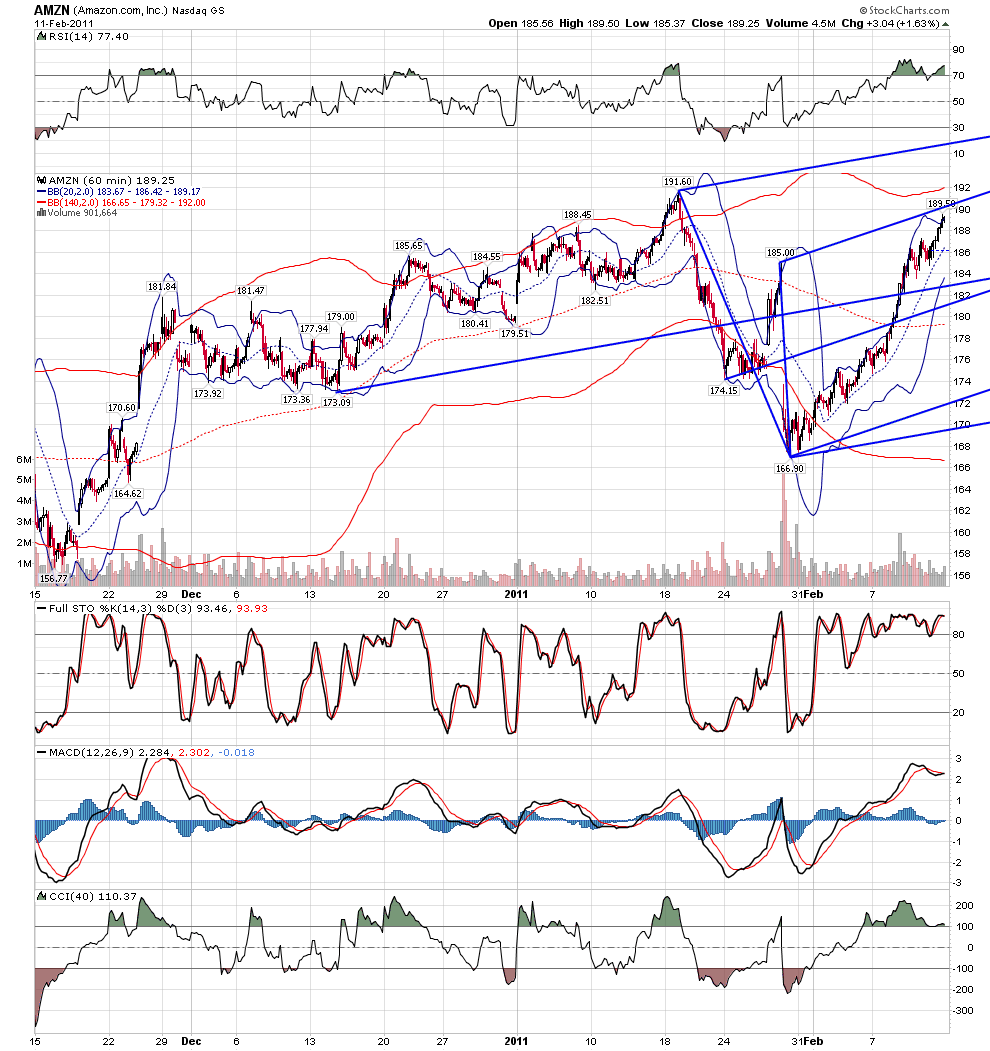
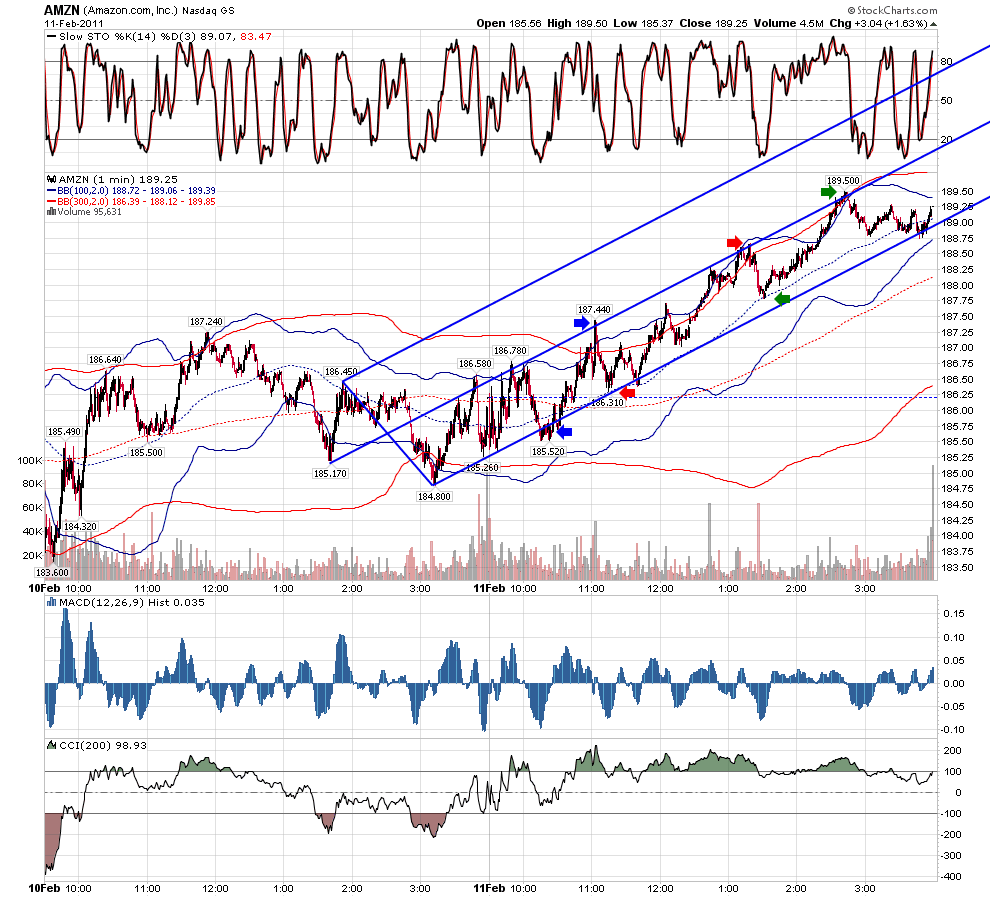
my apologies with the AMZN example.... but in showing the '' launching geometry'' i would have cut too close to showing what jim has asked not be shown publicly... here is a better example.... it is crucial that a trend day launch from a key pivot based on the geometry of markets... all medianline traders recognize this...and once price climbs above the medianline, as long as the ma's stay aligned, the target is the upper line.i e from the perspective of the traders of geometry, trend days most often launch from key geometry that also has a clear target given by the geometry sitting above.
Click image for original size

Click image for original size
Click image for original size
here is another example from today... i know what i show does not fit the explanation of others who teach trend days...but i trade the geometry of the markets...and i have seen this countless times....
Click image for original size

Click image for original size
yes!
Originally posted by roofer
now lets flip the concept... is there enough interest in this topic that i show exactly how what looked like the beginning of a trend day reversed exactly where it did in ABX?and since i know how much traders here hate hindsight, let it be known that i was very vocally pushing the short side in gold stocks from that reversal moment at the kane forum...
Click image for original size
Originally posted by roofer
my apologies with the AMZN example.... but in showing the '' launching geometry'' i would have cut too close to showing what jim has asked not be shown publicly... here is a better example.... it is crucial that a trend day launch from a key pivot based on the geometry of markets... all medianline traders recognize this...and once price climbs above the medianline, as long as the ma's stay aligned, the target is the upper line.i e from the perspective of the traders of geometry, trend days most often launch from key geometry that also has a clear target given by the geometry sitting above.Click image for original size
Click image for original size
I currently use a pitchfork and market structure in my trading.I would be interested in learning more about this, can you PM me and let me know where you were taught this?
your help would be appreciated.
a public reply. much of what i learned about medianlines was from tim morge in the time period when he was trading from home in 2001-2 and doing a 6-8 page post daily for free about how he was using his tools...those of us who had the priviledge to read the work from that time remember being stunned into silence by the clarity and clarity of purpose of the work... we were in awe. if tim had chosen to put those posts together as a book i think it would have become the definitive book on medianlines...the few key concepts i learned from that time are what i use today.i do not know what tim teaches today as part of his private forum. i am not a member.
Nice to see some structure put into the type of day. Questions to ask as the day starts, Is it trending or range bound? As a day trader understanding the trend early in the session is crucial to effective day trading. We can ride the trend days or take profits according to Support & Resistance on a range day.
Emini Day Trading /
Daily Notes /
Forecast /
Economic Events /
Search /
Terms and Conditions /
Disclaimer /
Books /
Online Books /
Site Map /
Contact /
Privacy Policy /
Links /
About /
Day Trading Forum /
Investment Calculators /
Pivot Point Calculator /
Market Profile Generator /
Fibonacci Calculator /
Mailing List /
Advertise Here /
Articles /
Financial Terms /
Brokers /
Software /
Holidays /
Stock Split Calendar /
Mortgage Calculator /
Donate
Copyright © 2004-2023, MyPivots. All rights reserved.
Copyright © 2004-2023, MyPivots. All rights reserved.