ES short term trading 7-23-10
Upside numbers
1007 - 1009
1001
1095
1091 *****
Downside
1085
1080
73 - 76**********
62- 65
1007 - 1009
1001
1095
1091 *****
Downside
1085
1080
73 - 76**********
62- 65
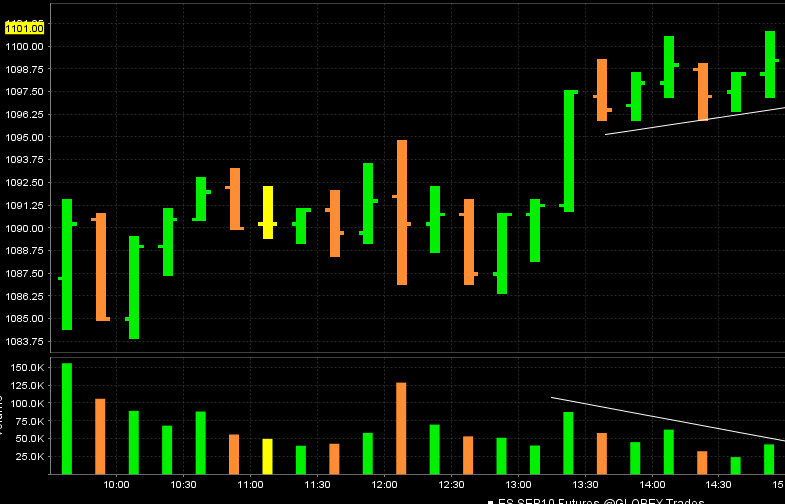
here is a peak at the volume I mentioned and the ledge below
Originally posted by BruceM
volume diverged ...we had more volume on the 12 noon bar than any bar since///
Click image for original size
I wasn't around on Friday but I'd like to share some observations on the trading day after I've studied the action.
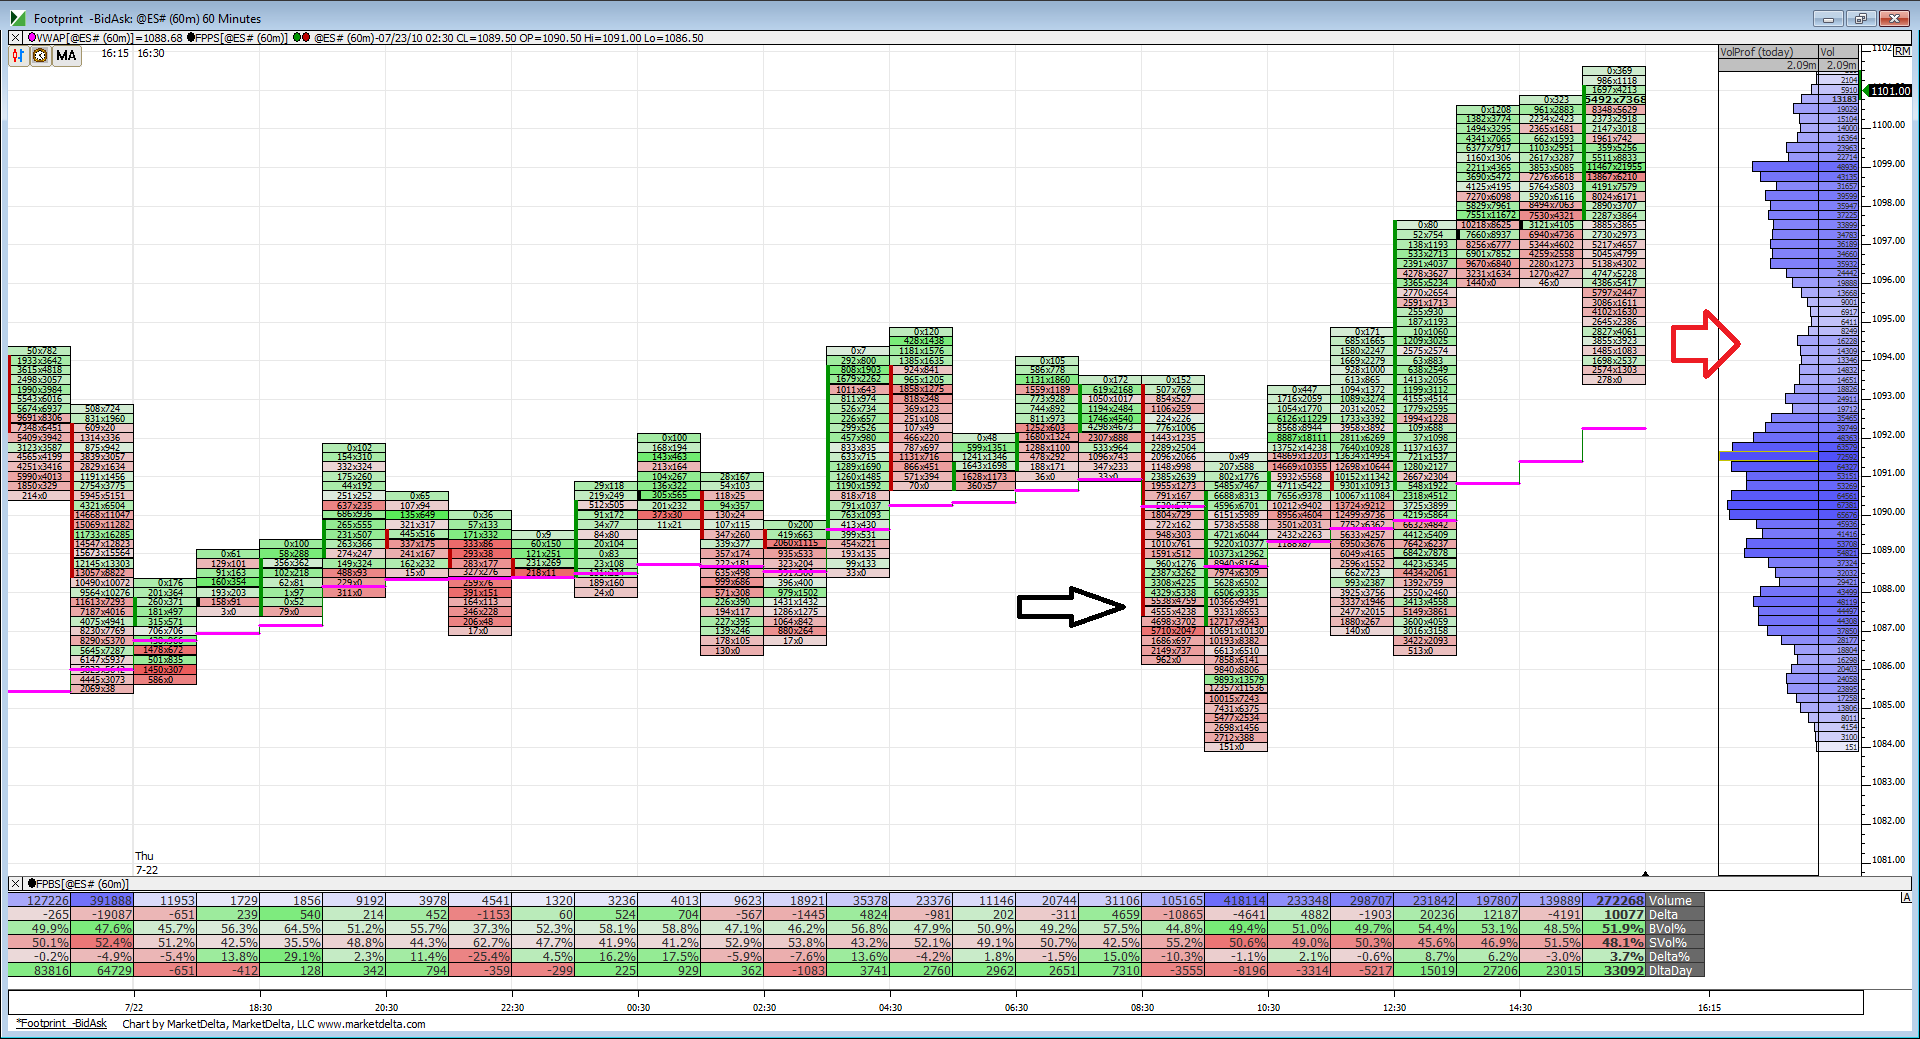
Here is a 60-min foot print chart of the entire session on Friday beginning with the globex open Thursday evening, you can see the Thu 7-22 on the starting grey divider.
The first thing which jumped out at me was only one close on a 60 min basis under VWAP for the whole session. (Marked by black arrow).
Second is the area marked by red arrow. Notice how the last 60 minutes on Friday traded down and into this low volume valley before heading to its closing highs. I'm not really sure what that means exactly but from a MP perspective it seems the breakout from earlier in the day left the valley needing more time with prices in it. (Does that make sense Bruce?)
That volume build between 1099-1096 shows acceptance of price but volume quickly fell off above 1100.
Clearly VWAP supported the bullish case today even though it was a fight in the morning session of RTH.
Click image for original size
Emini Day Trading /
Daily Notes /
Forecast /
Economic Events /
Search /
Terms and Conditions /
Disclaimer /
Books /
Online Books /
Site Map /
Contact /
Privacy Policy /
Links /
About /
Day Trading Forum /
Investment Calculators /
Pivot Point Calculator /
Market Profile Generator /
Fibonacci Calculator /
Mailing List /
Advertise Here /
Articles /
Financial Terms /
Brokers /
Software /
Holidays /
Stock Split Calendar /
Mortgage Calculator /
Donate
Copyright © 2004-2023, MyPivots. All rights reserved.
Copyright © 2004-2023, MyPivots. All rights reserved.