ES short term trading 7-23-10
Upside numbers
1007 - 1009
1001
1095
1091 *****
Downside
1085
1080
73 - 76**********
62- 65
1007 - 1009
1001
1095
1091 *****
Downside
1085
1080
73 - 76**********
62- 65
5 day average of H vs O = 1097.40
5 day average of L vs O = 1075.35
5 day average of L vs O = 1075.35
you usually donot see two open and drives in a row...especially when no reports are due....so fades for air will work better this morning
agree, Bruce.
and, simply opening inside yesterday's range is a tell that the markets will be searching for confirmation of exactly where the buyers and sellers still exist. A price discovery safari.
staying above H of 2 days ago seems important if bulls are going to be in control.
a break of more than 2 pts below 85.50 would suggest to me a test of prev day low, 78.00
the 85 ansd 91 are good ones today...especially if they can fill in the air below now..volume way off YD
double low in first ten minutes sucks for the longs...they gonna get it
so we need to think about if they start making new highs without cleaning up that double low ,it may be setting up the open - test and drive...but volume would really need to pick up...we can still fade but I'd prefer the next fade above 95
and us shorts would hope a break of the low can set up the short test and drive downn off 91...perhaps to get the 80 number if we are lucky
and us shorts would hope a break of the low can set up the short test and drive downn off 91...perhaps to get the 80 number if we are lucky
I have no signal but they may need to go back up to 89.25....low volume histogram
watch O/R for clues and that 89 number
Mornin,
Posted preferred ABC wave up thesis yesterday. Target minimum 1015 area. Got to work from something. I pattern trade.
Alternates in order for me after that one.
2. ABC down with end of A being 1099. Large B wave below 1000 with C wave retrace back up to it.
3.Extension of cycle down large with 1099 ledge/congestion as top.
4. 5th wave up toward or exceeding year high,1200-1250 area.
I don't make predictions but analyze what I see dynamically with an open mind. My preferred order, based on the composition of the patterns as I see them, and what to be ready for.
An example is I have the 5th wave up option last as it would be easier to play catchup with it than to be married to it here and now in this large area of congestion. But it's only large on an hour chart. That was no boating accident at 1099.
I always reserve the right in my mind to be wrong. That's why they have stops. I think if one thinks about it, the prudence shines through. If one use this stuff? I'm not an evangelist.
Seeing long and short as needed not a bad way to go through life. One can have a target but the trail to it can be deceptive and most important.
S/R areas at 1093.5,1087.75,and 1081/2 area. 1084 a diagonal S/R line.
Did I run everybody off.
I have nothing against marriage.
I have nothing against marriage.
I wasn't around on Friday but I'd like to share some observations on the trading day after I've studied the action.
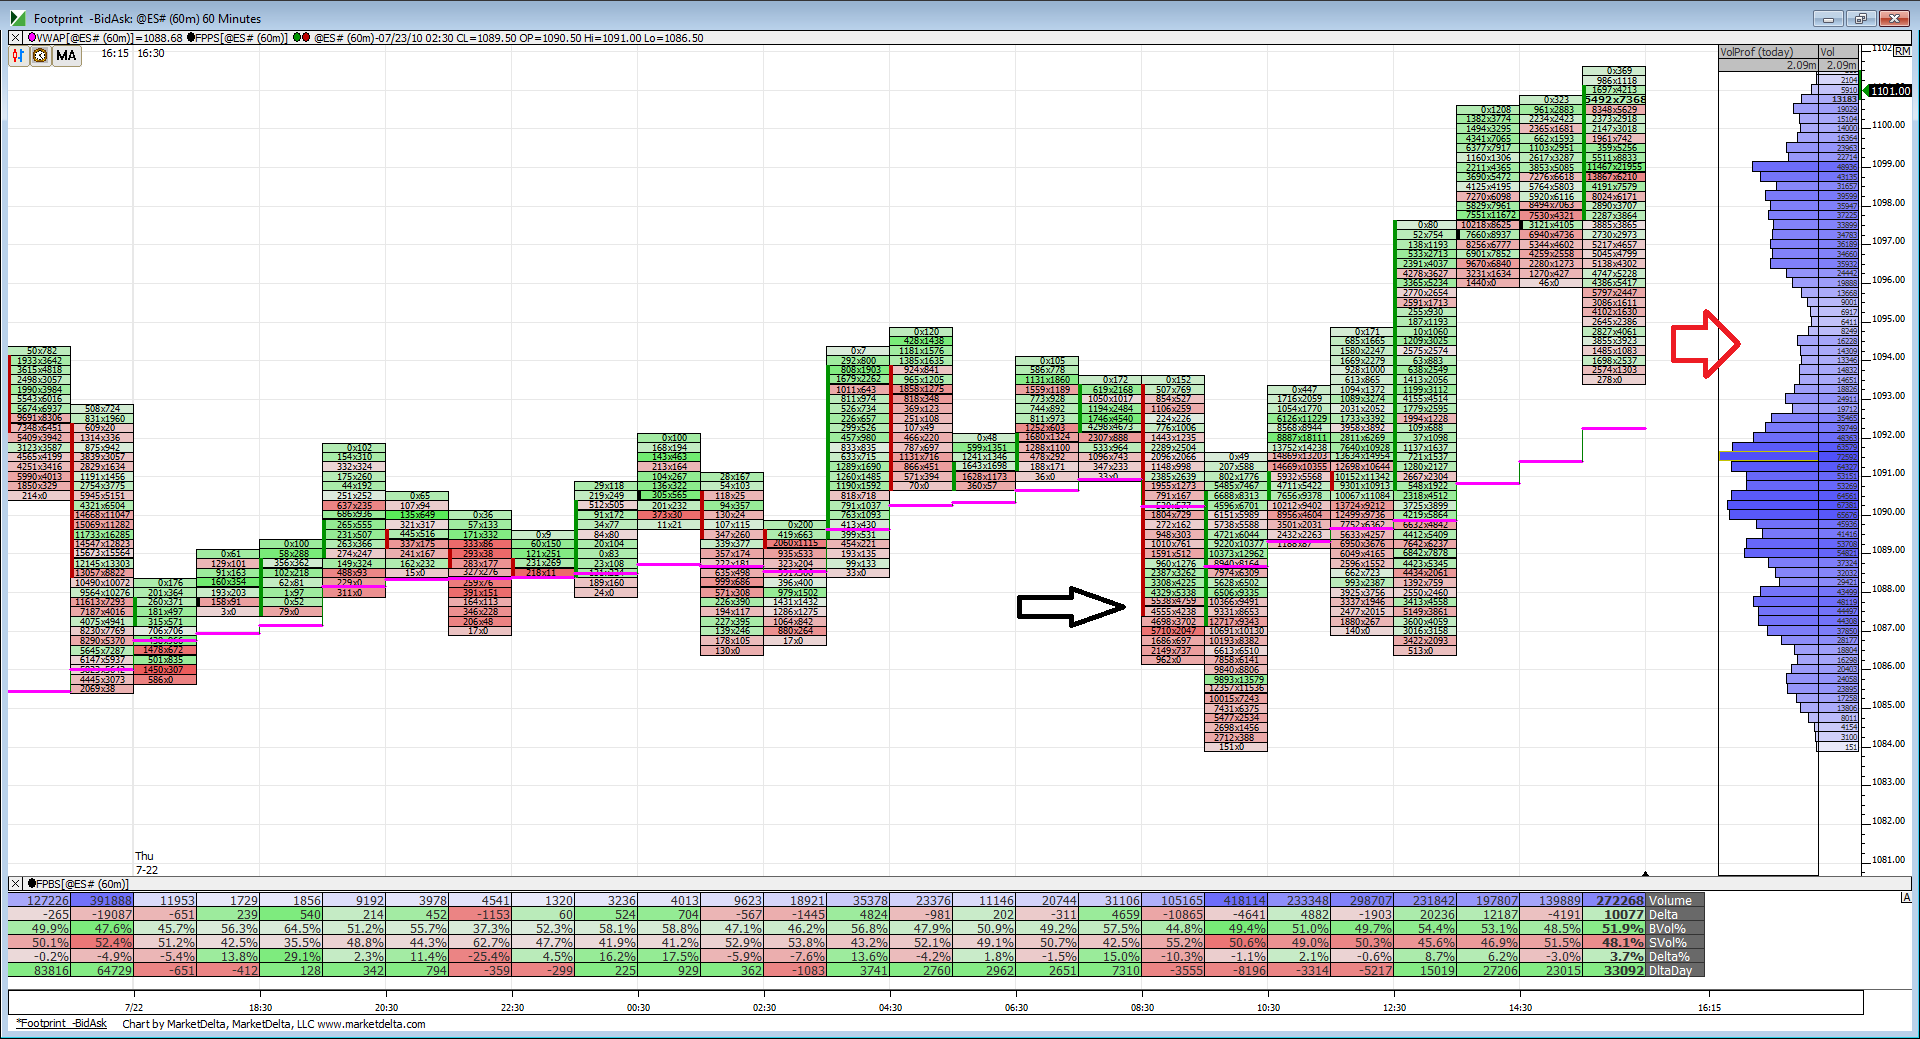
Here is a 60-min foot print chart of the entire session on Friday beginning with the globex open Thursday evening, you can see the Thu 7-22 on the starting grey divider.
The first thing which jumped out at me was only one close on a 60 min basis under VWAP for the whole session. (Marked by black arrow).
Second is the area marked by red arrow. Notice how the last 60 minutes on Friday traded down and into this low volume valley before heading to its closing highs. I'm not really sure what that means exactly but from a MP perspective it seems the breakout from earlier in the day left the valley needing more time with prices in it. (Does that make sense Bruce?)
That volume build between 1099-1096 shows acceptance of price but volume quickly fell off above 1100.
Clearly VWAP supported the bullish case today even though it was a fight in the morning session of RTH.
Click image for original size
Emini Day Trading /
Daily Notes /
Forecast /
Economic Events /
Search /
Terms and Conditions /
Disclaimer /
Books /
Online Books /
Site Map /
Contact /
Privacy Policy /
Links /
About /
Day Trading Forum /
Investment Calculators /
Pivot Point Calculator /
Market Profile Generator /
Fibonacci Calculator /
Mailing List /
Advertise Here /
Articles /
Financial Terms /
Brokers /
Software /
Holidays /
Stock Split Calendar /
Mortgage Calculator /
Donate
Copyright © 2004-2023, MyPivots. All rights reserved.
Copyright © 2004-2023, MyPivots. All rights reserved.