ES short term trading 7-23-10
Upside numbers
1007 - 1009
1001
1095
1091 *****
Downside
1085
1080
73 - 76**********
62- 65
1007 - 1009
1001
1095
1091 *****
Downside
1085
1080
73 - 76**********
62- 65
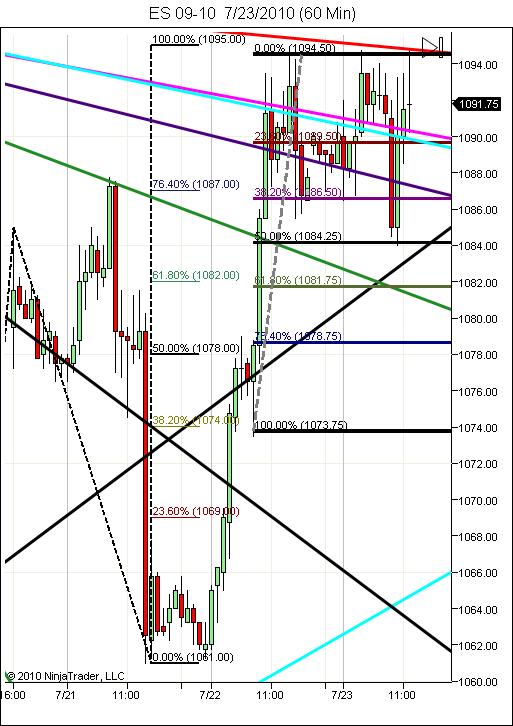
Summer Friday....I'm waiting to see what happens if /when they run those double 30 minute bars from YD nto 95. Low range 15 minute bar covers near that 91 number...they also like to run a 90 minute low or high most days except very big IB range days.....I just don't like buying or selling in range so just watching right now
Europe closed flat mainly and bank stress test results after close.
came back and piecrced cyan downtrend line so far,now trying for the break,pulled back up, got to go, can't type that fast
Click image for original size
Supposedly good results except for one bank,neutral signals so far. thinking either down large to beat the morning rush on Mon(whose watching on a Fri afternoon in the summer), or encouraging lift to have the public holding over the weekend, and bullish mon AM
1090 the 50% level for that bar on 1 hr chart
all I got till wrong long 1090,1 pt stop
1090 the 50% level for that bar on 1 hr chart
all I got till wrong long 1090,1 pt stop
sorry,1091 = 50% bar level
I shouldn't be in
I shouldn't be in
stopped, going to go focus
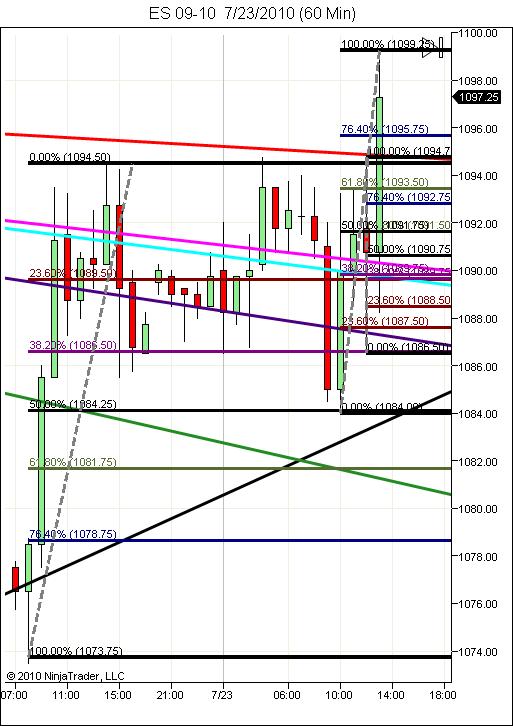
no retest of 1094/5 area yet, 1099.25 high so far, light fri pm about as good as O/N to run em?
we'll see
1099!!!
we'll see
1099!!!
Click image for original size
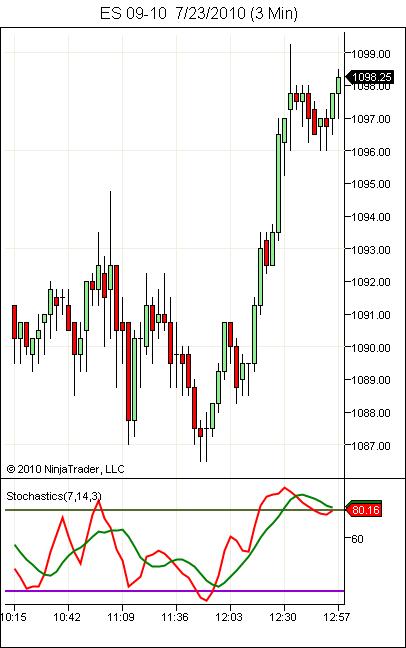
what the hell is going on?
look at total volume , like 1.5 million...
I'm ready to just shut down for the day.
I usually stop trading at 11am on fridays in the summer, thin volume can make for goofy moves (at least that's how I rationalize it).
good luck to all (it couldn't hurt)
look at total volume , like 1.5 million...
I'm ready to just shut down for the day.
I usually stop trading at 11am on fridays in the summer, thin volume can make for goofy moves (at least that's how I rationalize it).
good luck to all (it couldn't hurt)
example of extended 5th wave, if not the 1st of five up, should retrace back to the 2nd wave. break the top and probably higher unless a B wave of an ABC correction. Did I mention this stuff was deceptive?
Click image for original size
I wasn't around on Friday but I'd like to share some observations on the trading day after I've studied the action.
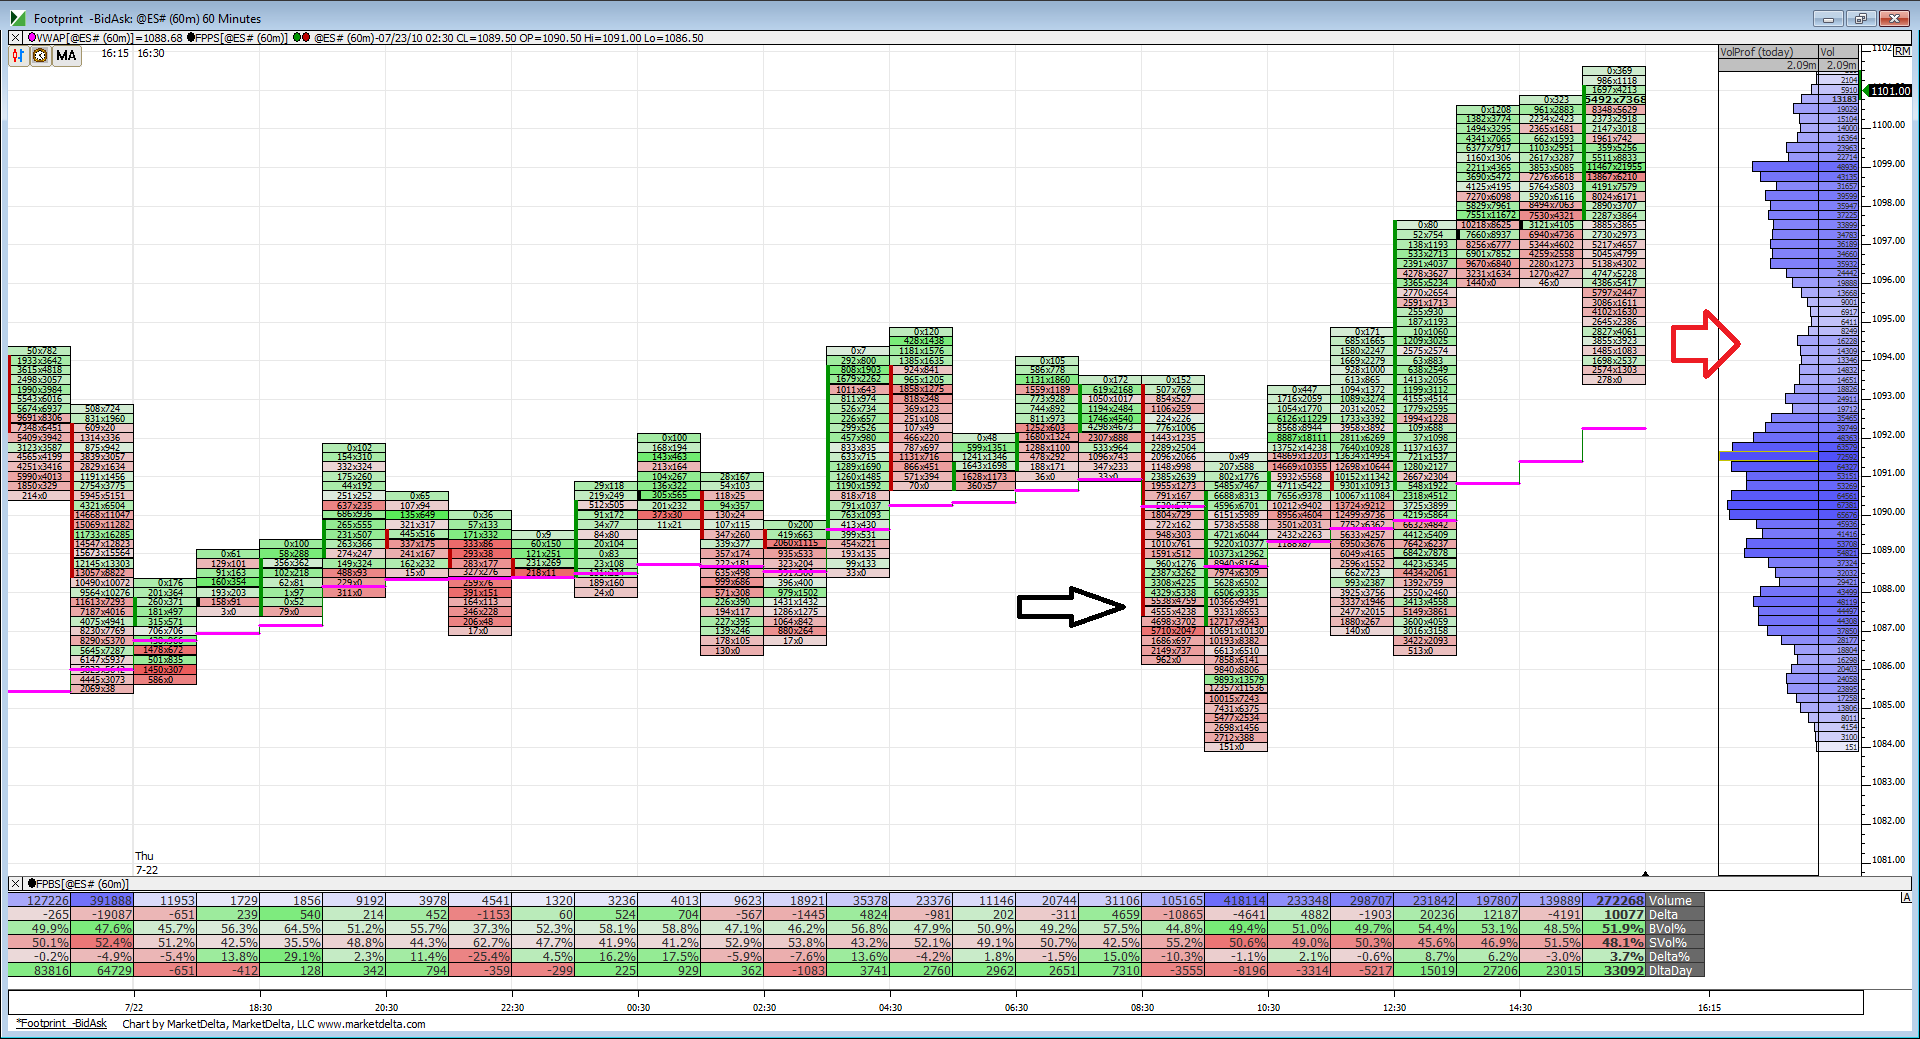
Here is a 60-min foot print chart of the entire session on Friday beginning with the globex open Thursday evening, you can see the Thu 7-22 on the starting grey divider.
The first thing which jumped out at me was only one close on a 60 min basis under VWAP for the whole session. (Marked by black arrow).
Second is the area marked by red arrow. Notice how the last 60 minutes on Friday traded down and into this low volume valley before heading to its closing highs. I'm not really sure what that means exactly but from a MP perspective it seems the breakout from earlier in the day left the valley needing more time with prices in it. (Does that make sense Bruce?)
That volume build between 1099-1096 shows acceptance of price but volume quickly fell off above 1100.
Clearly VWAP supported the bullish case today even though it was a fight in the morning session of RTH.
Click image for original size
Emini Day Trading /
Daily Notes /
Forecast /
Economic Events /
Search /
Terms and Conditions /
Disclaimer /
Books /
Online Books /
Site Map /
Contact /
Privacy Policy /
Links /
About /
Day Trading Forum /
Investment Calculators /
Pivot Point Calculator /
Market Profile Generator /
Fibonacci Calculator /
Mailing List /
Advertise Here /
Articles /
Financial Terms /
Brokers /
Software /
Holidays /
Stock Split Calendar /
Mortgage Calculator /
Donate
Copyright © 2004-2023, MyPivots. All rights reserved.
Copyright © 2004-2023, MyPivots. All rights reserved.