Determining direction of the day
Hi All,
Perhaps someone has some ideas to offer on this question:
"If the direction of the day is defined as the general trend from open to close, what might be a good formula or way to determine it?"
notes to clarify:
Up Direction:
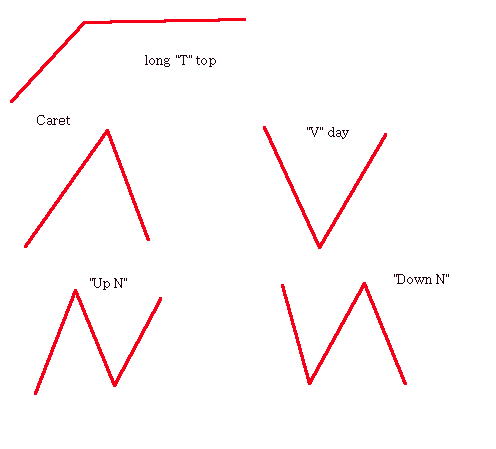
1. Today (22 Jul 10) was strongly up (to 1093 area) from the open (1078.25), then flat along the top, and then a dip down at the close (1086 area). So today I call a long "T top" day. For my question, then I don't really mean include the dip down at the end. That is I would ignore the move to 1086 area. (Close was 1088.50 ES Sept contract).
Examples of Flat direction:
2. Some days are "V" days and some "^" (caret) days. These open and close roughly even with a peak trough around the middle of the day.
Some days are "Up N" or "Down N" so for this question I would consider them flat days. (up N will be positive from O:C and Down N negative from O:C -nut there is no consistent trend.
So at this point in the question I'm not sure if adding more blocks possible ideas or adds to them but I'll give one area I am looking at:
Pre open midarea (e.g. Vwap 7:30am to 8:30am) compared to the O/n mid point (H+L/2).
(as a cavet to those who feel they must answer with things like "There is no way to determine it", etc. PLEASE DO NOT POST! Others who might be more timid about offering me an idea for investigation might not post for fear of sounding foolish.
Also: People who don't think and answer off the cuff - PLEASE DO NOT POST.)
I am looking for any ideas from positive people - don't worry if it is eccentric (you can PM me if you like!).
Many thanks in advance to all positive, helpful replies.
Perhaps someone has some ideas to offer on this question:
"If the direction of the day is defined as the general trend from open to close, what might be a good formula or way to determine it?"
notes to clarify:
Up Direction:
1. Today (22 Jul 10) was strongly up (to 1093 area) from the open (1078.25), then flat along the top, and then a dip down at the close (1086 area). So today I call a long "T top" day. For my question, then I don't really mean include the dip down at the end. That is I would ignore the move to 1086 area. (Close was 1088.50 ES Sept contract).
Examples of Flat direction:
2. Some days are "V" days and some "^" (caret) days. These open and close roughly even with a peak trough around the middle of the day.
Some days are "Up N" or "Down N" so for this question I would consider them flat days. (up N will be positive from O:C and Down N negative from O:C -nut there is no consistent trend.
So at this point in the question I'm not sure if adding more blocks possible ideas or adds to them but I'll give one area I am looking at:
Pre open midarea (e.g. Vwap 7:30am to 8:30am) compared to the O/n mid point (H+L/2).
(as a cavet to those who feel they must answer with things like "There is no way to determine it", etc. PLEASE DO NOT POST! Others who might be more timid about offering me an idea for investigation might not post for fear of sounding foolish.
Also: People who don't think and answer off the cuff - PLEASE DO NOT POST.)
I am looking for any ideas from positive people - don't worry if it is eccentric (you can PM me if you like!).
Many thanks in advance to all positive, helpful replies.
Click image for original size
Originally posted by Lorn
No, I do a 5-day average for each 15 min period. So the 15:15 period I will use the average of the last 5 days for that period only.
Does that make sense?
Your description would certainly be another way to look at it.
ok I think I understand.
You would sum 5 fifteen minute bars (e.g. all the 15:00 to 15:15)and divide by 5. This means that for any given day you would have 29 different values (the averages for the proceeding 5 days) and compare each to its own individual time slot.
So you would be able to answer; "Is today's 15:00-15:15 volume > or < the typical volume for this time slot?"
Is that the idea?
Yes sir. That's the idea!
Many thanks for your insightful contribution to the thread Lorn!
How did you select 5 for your averaging period?
Long enough to smooth out the bumps and short enough to be responsive to the changing dynamics?
How did you select 5 for your averaging period?
Long enough to smooth out the bumps and short enough to be responsive to the changing dynamics?
A 5 day average in my opinion is enough to represent changing ranges as they occur. Its easy enough to get other time lengths to compare as needed as well.
Hi Lorn,
Perhaps you could show an example of your volume chart for today and how you are reading it at this time?
Thanks
Perhaps you could show an example of your volume chart for today and how you are reading it at this time?
Thanks
Here is my excel spreadsheet I use to track volume. It requires a little data entry but I think the hands on approach has value.
If you have questions, ask away.
If you have questions, ask away.
Click link to access uploaded file:
Volume.xlsx
Volume.xlsx
I heard a trader say this about hints for a daily market direction:
If the host, lets say of Bloomberg is wearing red, that would be
a hint as to what direction they think the market would be headed
that day .. green for up .. brown/gray for sideways .. lol
If the host, lets say of Bloomberg is wearing red, that would be
a hint as to what direction they think the market would be headed
that day .. green for up .. brown/gray for sideways .. lol
Marget(somebody) on Bloomberg he said is wearing blue. Blue is neautral (no indication)
I guess you can tell I don't watch Bloomberg .. lol
I guess you can tell I don't watch Bloomberg .. lol
Originally posted by redsixspeed
Marget(somebody) on Bloomberg he said is wearing blue. Blue is neautral (no indication)
I guess you can tell I don't watch Bloomberg .. lol
Margaret*
Margaret Brennan .. wearing green
Originally posted by redsixspeed
Margaret Brennan wearing red
===================================================================
Margaret Brennan wearing red
Emini Day Trading /
Daily Notes /
Forecast /
Economic Events /
Search /
Terms and Conditions /
Disclaimer /
Books /
Online Books /
Site Map /
Contact /
Privacy Policy /
Links /
About /
Day Trading Forum /
Investment Calculators /
Pivot Point Calculator /
Market Profile Generator /
Fibonacci Calculator /
Mailing List /
Advertise Here /
Articles /
Financial Terms /
Brokers /
Software /
Holidays /
Stock Split Calendar /
Mortgage Calculator /
Donate
Copyright © 2004-2023, MyPivots. All rights reserved.
Copyright © 2004-2023, MyPivots. All rights reserved.