Emini S&P Trading Using Elliott Wave Principle
Hi all.
I am new to the forum and have started this thread to discuss trading the E-mini using the Elliott Wave Principle. I desire a high quality discussion.
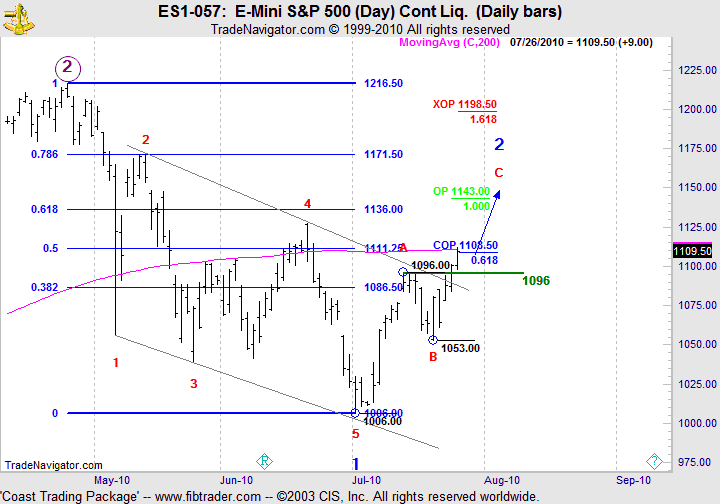
I have attached the daily chart containing my operative count as a starting point of the discussion. I believe that the decline from 1216.5 was a Leading Diagonal rather than a 5 wave decline. We are currrently working minor wave 2 up in a zig-zag.
I'm looking forward to everyone's comments.
I am new to the forum and have started this thread to discuss trading the E-mini using the Elliott Wave Principle. I desire a high quality discussion.
I have attached the daily chart containing my operative count as a starting point of the discussion. I believe that the decline from 1216.5 was a Leading Diagonal rather than a 5 wave decline. We are currrently working minor wave 2 up in a zig-zag.
I'm looking forward to everyone's comments.
Click image for original size
Bruce- If you were long on the break of 1096 you played a breakout trade looking for upward momentum. I didn't make a call for this trade. My charts include upside potential tragets. That's all they are. There is no guarantee that price will get there. Should 1127.5 (chart resistance) be breached that opens the door for higher price expansion.
In order to know when to get out, one must have enough knowledge of EW. If you haven't read the book at a minimum, this thread is going to drive you nuts. Once you know the patterns and can count the waves, you then work on Fib extensions and retracements and add indicators to your charts that help call turning points or termination points for waves. I would also recommend candlestick charting as they are useful in confirming tops and bottoms. I use three customized indicators... ROC, RSI and MACD. Each of these flashed divergence between 1109.75 to 1117.75. This is typical but not required to verify that a top may be forthcoming. These were early warnings to a trader. Your primary question as to locking in profit is more of trade management. The single contract trader should at the minimum moved up stops, take profit or trailed. The rest should be according to your written trade plan.
Seems like the worst that could have happened was + 6.5 points if you got out today.
Hope this helps.
Best of Trading!
Traders - I will be traveling for the next few business days. I will have limited internet access but I'll try to post if I get a chance.
Thanks to all contributors. Please post some of your interpretations.
Thanks to all contributors. Please post some of your interpretations.
This is a very interesting discussion. I don't trade the futures, only the cash and found an elliott wave blog recently that has a number of possible counts for the cash market and shows the counts on various time frames, including 1 min charts during the day. He's pretty good at identifying potential turns where trades can be entered and gives levels to watch to tell you if the count is wrong. He doesn't actually give trade advice but with his counts and the levels to watch that he gives, you can certainly trade off what he says.
May be worth looking at even if you don't trade the cash market:
this is the blog address:
http://gi61et.blogspot.com
Its shown me that you can use elliott wave to trade but you need to know where to get out if the count is wrong and what might be happening instead. If you only have one count then you end up having no idea what to do when it doesn't work out like you thought - believe me, I've been there!
Anyway, I'm still learning and finding this thread of great interest so I'll be watching it closely. Thanks.
Thanks.
Originally posted by redsixspeed
EWT;
I am not interested in you making calls, what I would like
is for you to tell what wave count you see the ESU0 in. I
will look @ my own chart to see if your count confirms my count.
TIA
====================================================================
After reading this http://gi61et.blogspot.com I don't think
there is a short answer to my question.
My question is simply this...what wave is ESUO in today
Well, I was kind of put off by what I perceived to be a deceptive posting of a thread. First impression. I can only hope you can help others understand EW better through discussion. You're definitely congenial.
Okay, point noted about the first chart label 2 and I apologize. It is a valid label in EW rules(thanks Lorn). I will note that if that's correct, a future in EW analysis might not be the best career move at this time for anyone. I know there is a lot of competition our there already and I'm sure you're aware.
Like I said, I don't usually debate waves with anyone. If it's out there, I've probably paid for it in the past.
Best of luck with your thread and future!
Just got to my destination in Denver and trying to make a quick post. Has anyone ever had this encounter? If you want your analysis to be correct and be guaranteed to miss a winning trade ... Take a day off from trading or leave town.
Dave- Don't worry about debating. I like to bounce counts because I think everyone wants to see what they want to see and all it takes is someone else's view to open our eyes. We can all benefit.
Look for a late night post if I can get my computer fired up for some analysis of today's action.
Best of Trading
Not that anyone here's unfamiliar with the term "google" or "internet" etc. ... figgered that with the Elliott Wave thang and all kinds of practioners and those that have their own slant/permutation on the original work ... it'd be helpful (hopefully) to offer out some links of E-Wave sites, including Prechter and Miner along with others practicing this methodology at any/every level. So here's a quicky ... there's plenty more if you want to venture down the rabbit hole, Alice.
Elliott Wave Resources:
From Stockcharts.com Public ChartLists:
http://stockcharts.com/def/servlet/Favorites.CServlet?obj=ID3287600
http://stockcharts.com/def/servlet/Favorites.CServlet?obj=ID1606987
http://stockcharts.com/def/servlet/Favorites.CServlet?obj=ID152968
http://stockcharts.com/def/servlet/Favorites.CServlet?obj=ID676791
Other Websites:
http://gi61et.blogspot.com/ (thanks to “gobbly’s post)
http://elliot-wave-opportunities.blogspot.com/2010/07/es-pit-session-short-term-elliott-wave_28.html
http://www.elliottician.com/ (okay, the freaky pics of peeps cycling thru the home page weirded me out a bit)
Robert Miner’s “Dynamic Trading” site:
http://www.dynamictraders.com/free-tools/free-tools.html
Prechter’s site … the long time grand poobah of “modern” E-Waver analysis … who’s made a couple of big time calls … the 87 crash – “woooooot” …. But then had everyone out of the stock mkt. in 1995-96 … a WAY BIG OOOPS. Anyway, a high-brow approach to the wave-gig:
http://www.elliottwave.com/
Hope this is helpful and useful in some way that's beneficial!
The Funky Monkey!
Originally posted by EWT
First order of business is how trade reacts to 1101.25. If it is supportive and trade breaches 1113, then wave v of c of wave 2 (blue)up could be underway. Should trade disrespect 1101.25 and continue lower, then I'll be looking carefully at 1096.
Well, the Alternate count may have been correct as 1101.25 was slightly exceeded, followed by a retest of 1113 that failed, on an opening gap (see lower time frames), followed by a 5 wave decline. So , I was right on the desired direction but then 1096 didn't hold.
Based upon the wave principle, C waves are 5 wave structures. If you were counting the waves, it kept you out of trouble. We didn't have a complete 5 wave move down until 1088.75. 1088.75 was also a .50 retracement between waves ii and iii. That is still an acceptable retracement for wave iv. The Bullish Hammer confirmed that wave C had terminated giving a trader the opportunity to go long. If anyone took this signal, don't let your profit get away. The current move down from 1104.5 can't retrace more than 1088.75 to maintain the bullish posture for a wave v of ii circle beginning.
Hope this makes sense. I'm dead tired.
Best of Trading!
MonkeyMeat
Thanks for those links - very helpful.
Thanks for those links - very helpful.
A new month and I'm still undecided as to whether minor wave 2 on the daily chart has completed. Other market pundits feel that wave 2 ended in a truncated 5th wave of c at 1113. I'm making this post from my cell because I don't have internet access today to post a chart. My apologies! The truncation can best be seen on a 60 to 120 min chart. I'm note sold on that analysis. Price remains within channel lines established between 1006 and 1053 (bottom channel) and the parallel upper channel at 1096. Until the lower boundary is broken, I can't see getting overly committed to the downside here because that's a signature for corrective action. So rather than flip flop counts like most do, I'll ask the Dealer for another card in hope that the coming days price action will bring clarity the count. There's plenty of time to get on board the next wave down.
Best of Trading!
Best of Trading!
Well, I guess we have our answer...as expected EWT is giving us double talk and "dancing" around making those market calls...we know what that means.....he can't make money by trading EWT.
I have a good indication now that he has little respect for our forum and the people here. He doesn't need us and we certainly don't need him. I think it's time to let Elite trader and other forums figure him out.
I have a good indication now that he has little respect for our forum and the people here. He doesn't need us and we certainly don't need him. I think it's time to let Elite trader and other forums figure him out.
Emini Day Trading /
Daily Notes /
Forecast /
Economic Events /
Search /
Terms and Conditions /
Disclaimer /
Books /
Online Books /
Site Map /
Contact /
Privacy Policy /
Links /
About /
Day Trading Forum /
Investment Calculators /
Pivot Point Calculator /
Market Profile Generator /
Fibonacci Calculator /
Mailing List /
Advertise Here /
Articles /
Financial Terms /
Brokers /
Software /
Holidays /
Stock Split Calendar /
Mortgage Calculator /
Donate
Copyright © 2004-2023, MyPivots. All rights reserved.
Copyright © 2004-2023, MyPivots. All rights reserved.