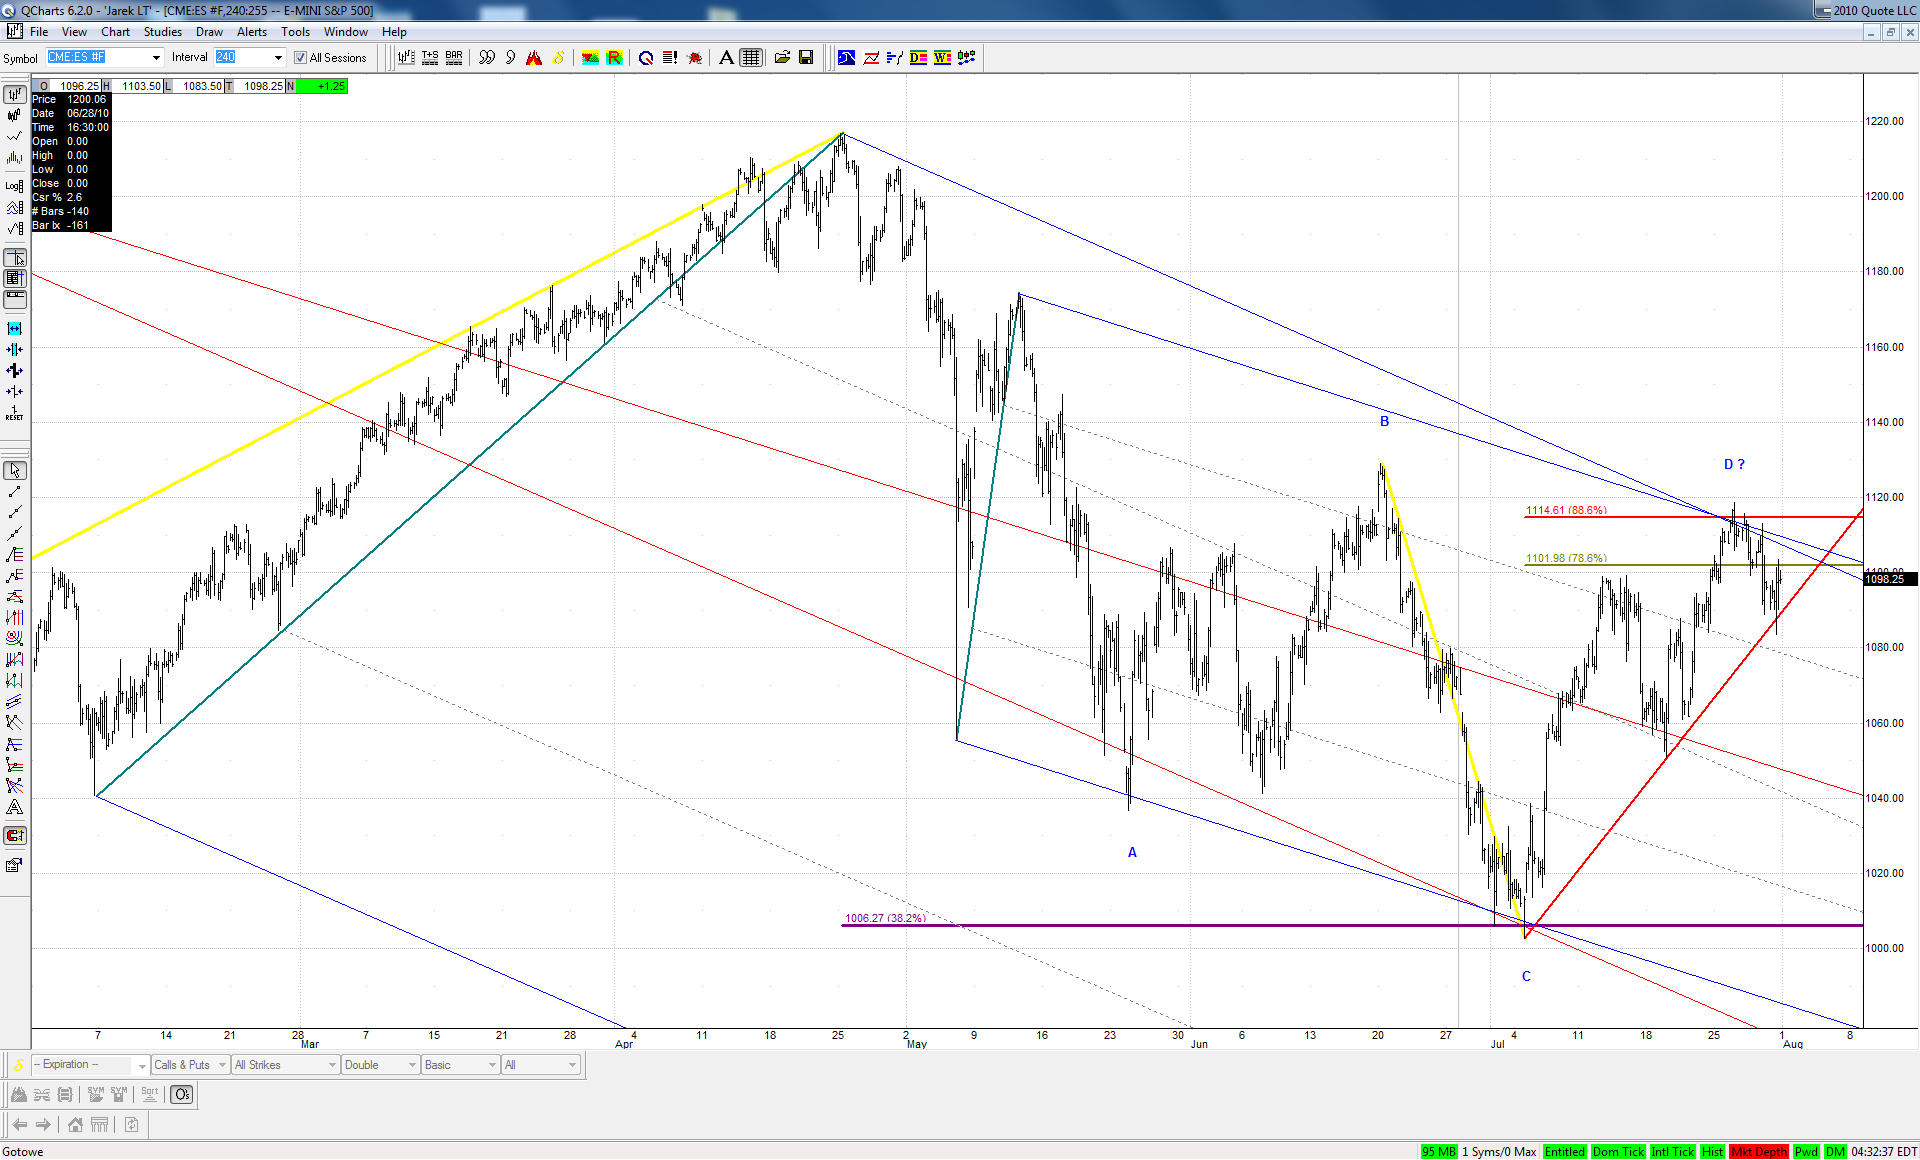
Here is an updated version of my longer term bearish TD ABCD in ES:
Click image for original size
It has some drawbacks (especially the impulsive look of the potential BC leg) but the decisive break beneath the rising TL should confirm it.
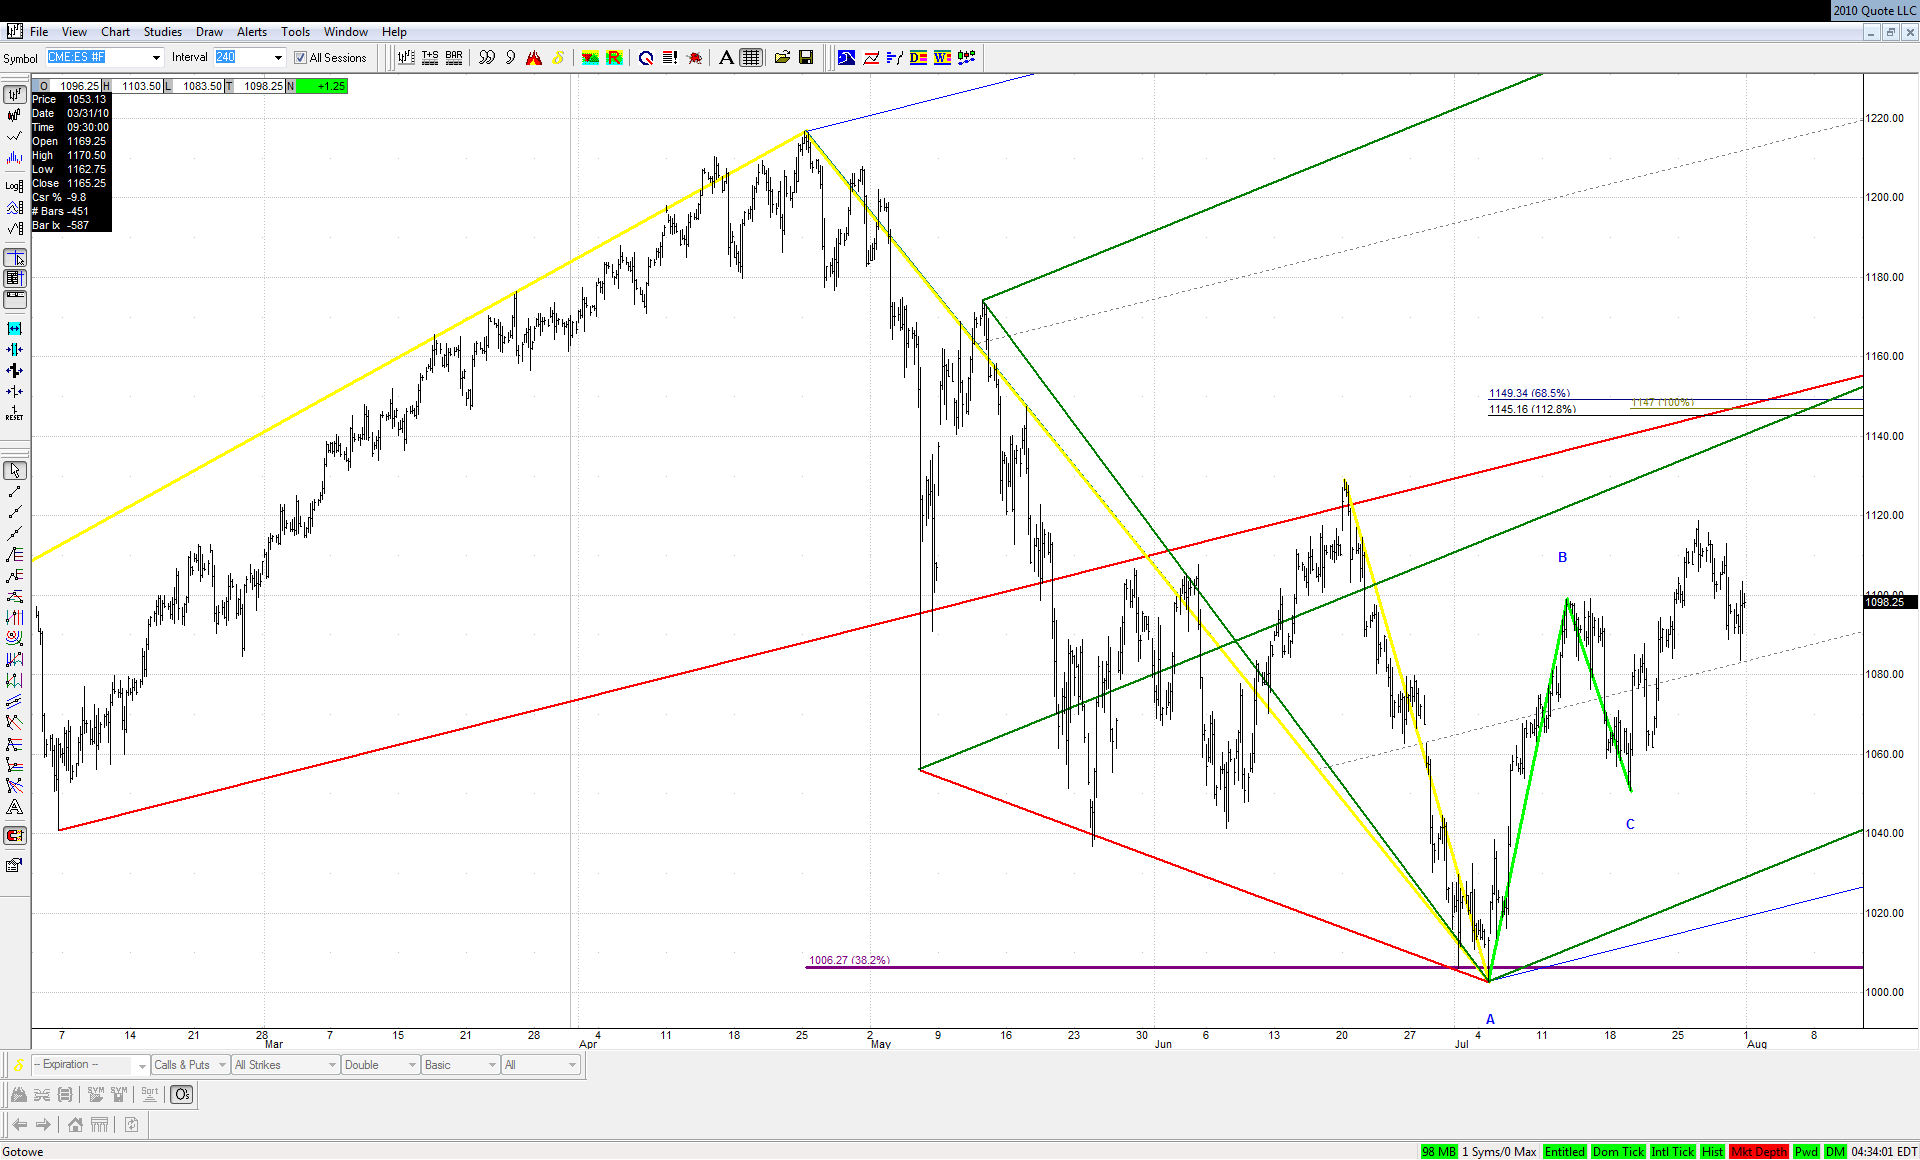
Otherwise the rise from early July low might develop into a bigger ABCD itself:
Interesting, it took out to 10700 and we'll see. Would you put some light on those other signs of 10800?
JI
jimkane
Rep: 3,058
Posts: 33,089
3
(Edited )
Well, for one, the 1.000 price projection for that ABCD you highlighted is there. I also have a line from a technique that is proprietary and I haven't shown to anyone, and that hits right there. Also, put a crazy TL on there from that 2/5 low to the 6/21 high, and it comes right into the area.
I also have some other lines from previous work just overhead, and the area from 10,900-11,000 is also very interesting. Somewhere between 10-8 and 11 is a key spot. But, the ES is already over the equivalent area as INDU 10-8, so I rather suspect the course is up and over the April high, and then strong through Sept and Oct into the elections, as I mentioned in my monthly commentary. Anything but an August top, as everyone is looking for it.
The curious thing is an article I just read about how people think the market runs up into the elections, when in fact it usually doesn't, it runs up after, once the loose money policies are implimented. So, it's odd that people think the market runs up into an election when it doesn't, but now people are calling for a top in August and then down into the election, which is more like what it actually tends to do.
So, they are ignorant of what it actually does, and now they are calling for it to do what it actually usually does, and that further makes me think no way it will do that, and so in order for it to break precedent with what it usually does, they all had to believe it would do what it rarely does (according to what they think it does) so that it can do what it rarely actually does, and that is rise until the election. Make sense? Just some thoughts.
IJ
ijon
Rep: 0
Posts: 13
0
(Edited )
Thanks Jim. Your thoughts are always interesting.
As for people and their methods I know a guy who bought stocks and got not small money on a bull market. When the market changed he didn't sell them saying the trend will return and he will get money back. After a year he still got the stocks valued much below the price he paid...
BTW, INDU tested 10703 from below twice today.
JA
jarek
Rep: 94
Posts: 3,474
2
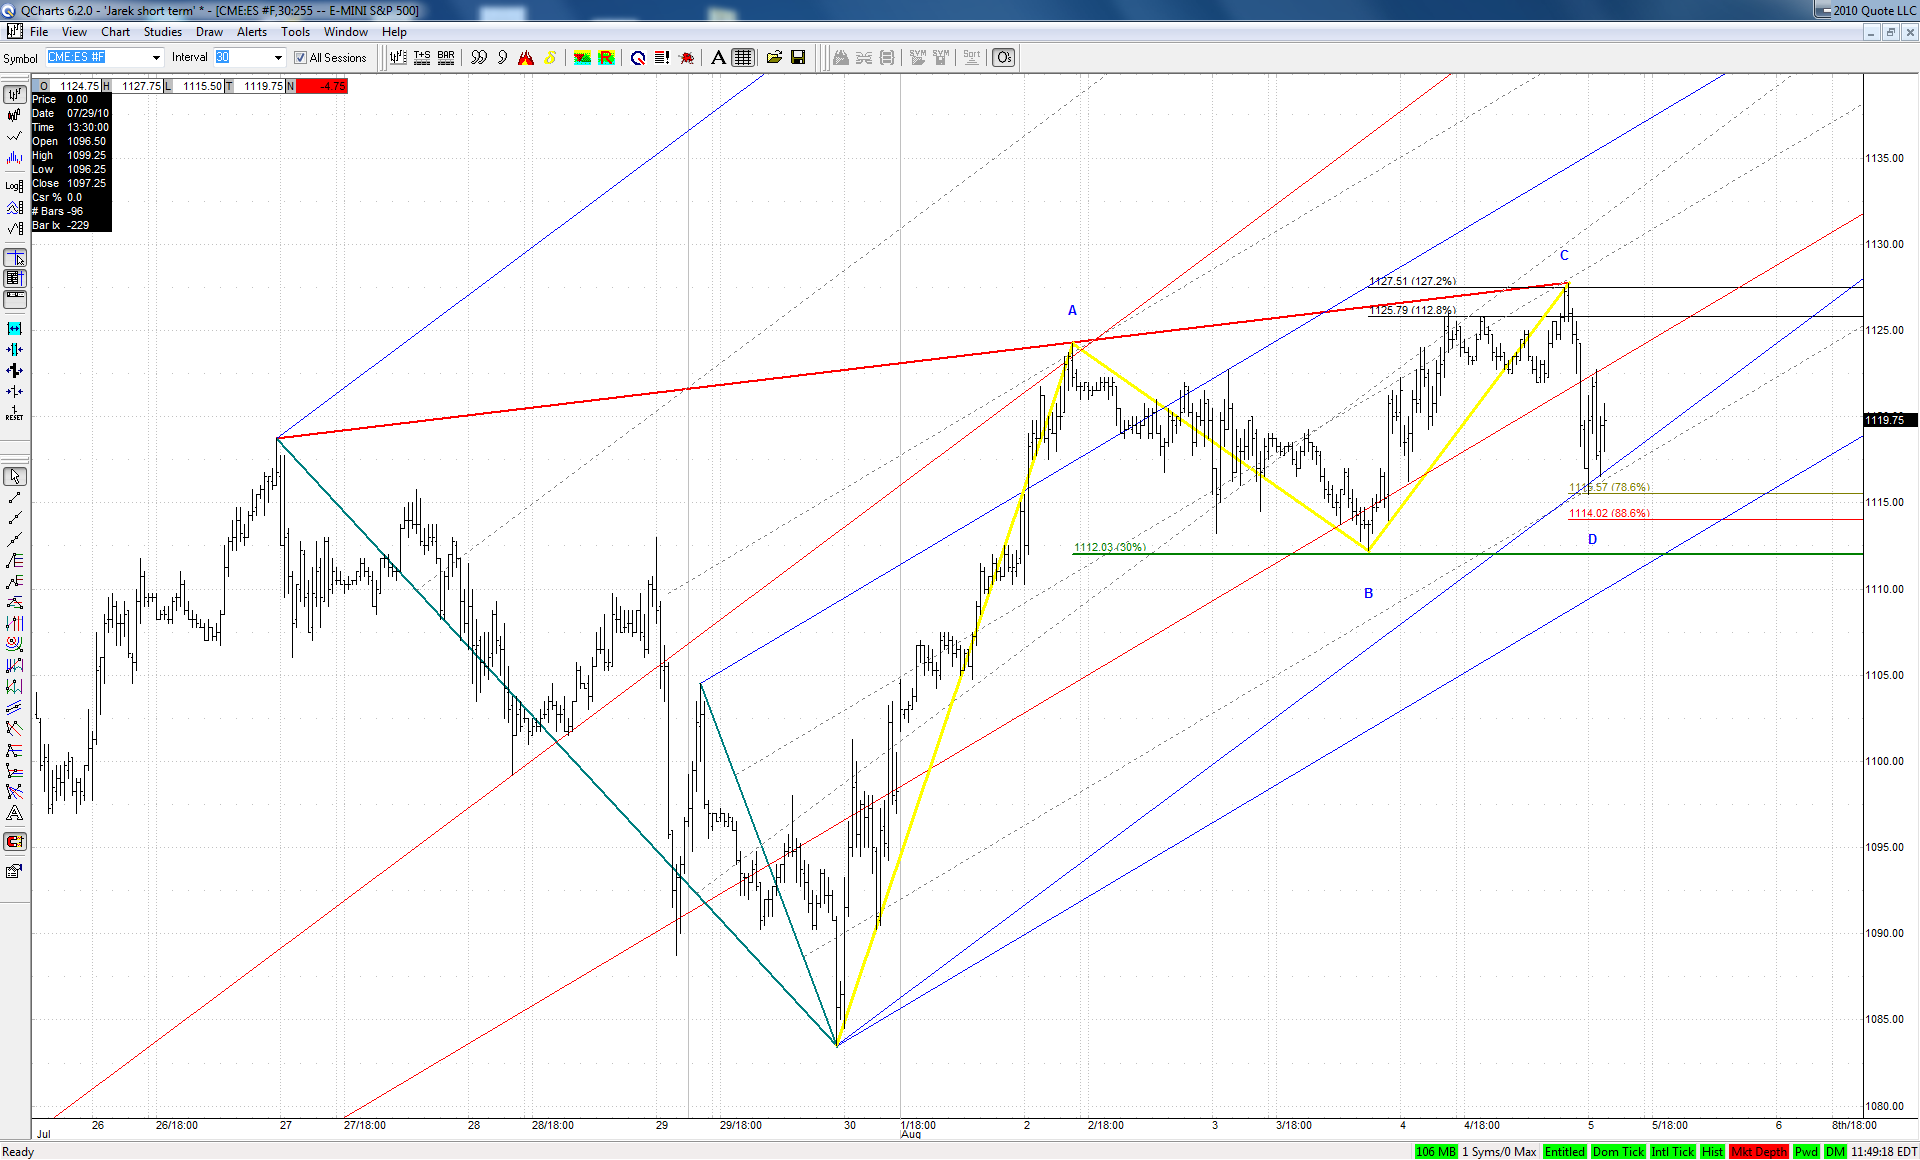
Possible bullish 4PT was completed at LOD:
Click image for original size
But since the HOD lies exactly on an important spike line, the bulls will really have to prove it here
JA
jarek
Rep: 94
Posts: 3,474
2
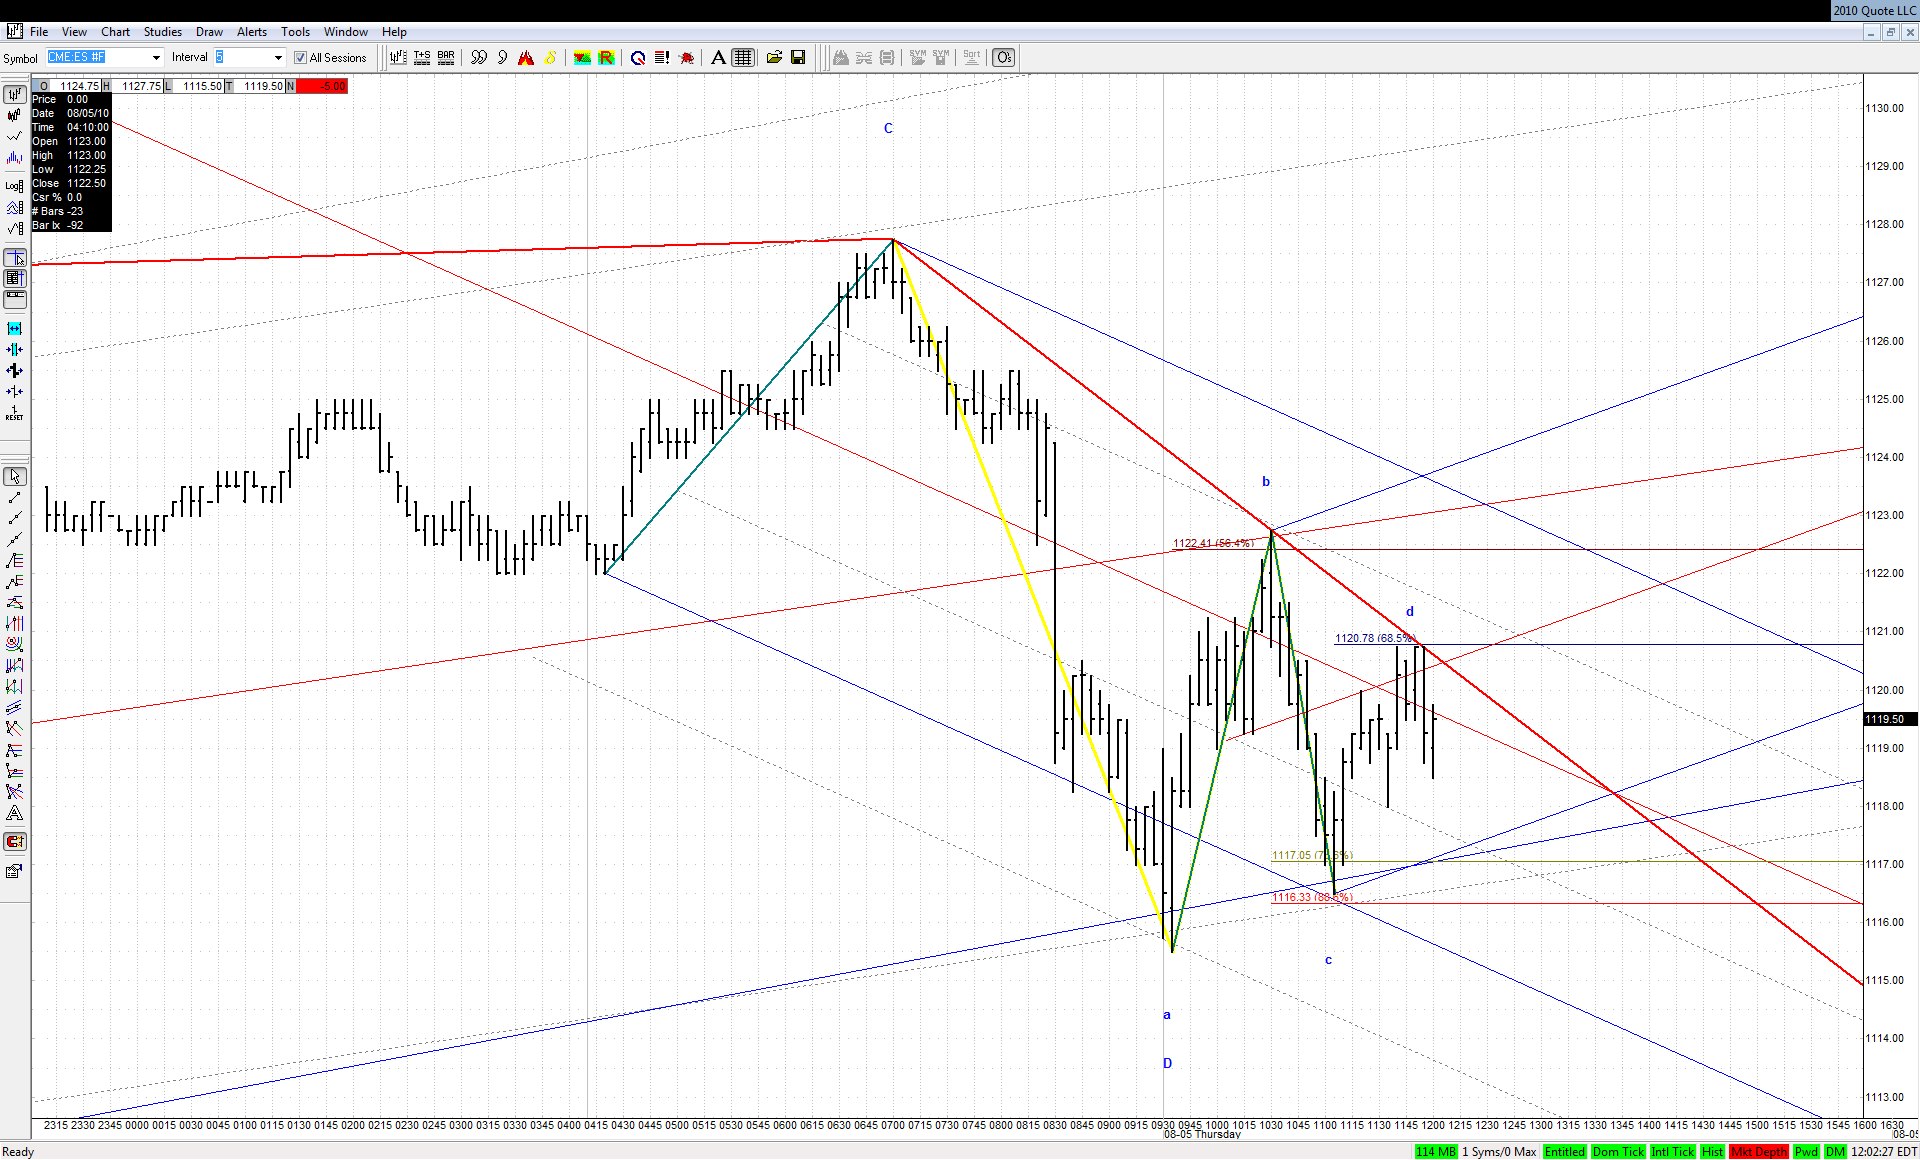
And now a small bearish 4PT sets up against the bigger bullish one. One of them will have to fail:
Click image for original size
JA
jarek
Rep: 94
Posts: 3,474
1
This doesn't look like W3 upward acceleration off the bigger pattern ...
JA
jarek
Rep: 94
Posts: 3,474
1
Usually when you have to wait long and really look for W3 - it simply is not there
JI
jimkane
Rep: 3,058
Posts: 33,089
0
Nice work and comments, jarek.
JI
jimkane
Rep: 3,058
Posts: 33,089
1
Now, I'm not saying by any stretch that I think that was the top there for the recent move, but recall the number I've been mentioning the most: 28. The GLOBEX high for the move was 27.75. Hmmm, sure would be nice if that was it
JI
jimkane
Rep: 3,058
Posts: 33,089
1
(Edited )
Anyone recall my screaming buy on AMZN at 100? Recall I posted this before the fact (go back to the posts and the time stamps). Do the workup, the area is obvious. AMZN just hit 128.47, with almost no checkbacks to speak of on the way.
Look at crazy RDN, too, and that ABCD. For a bullish tape, that one managed to actually go down a bit off the area.
I guess they will have to be happy to close this near the high tick for the move, and right at the RTH HOD. I know I'm happy with how that coil play played out.