ES Short Term Trading 8-5-2010
the biggest one minute volume bar has worked it's magic again today...even better if you look at your tic data...you will get the 1118 - 1117.75 price
The cool thing is that these volume bars get gernerated real early in the day..this one happened in the 3rd minute of trade today....
yesterday the biggest volume happened at 1121.50 with the 10 am report...so that number was awesome YD and Resistance today...so far!!
the power of Volume as an attractor....there is a thread somewhere...just not sure where I did that one but you can see the possibilities..
If and this might be wishful thinking we are to follow the same path as YD then in theory we will revisit the 1118 area and then get new lows........of course you would want to incorporate the volume attractors with a good signal...
Originally posted by BruceM
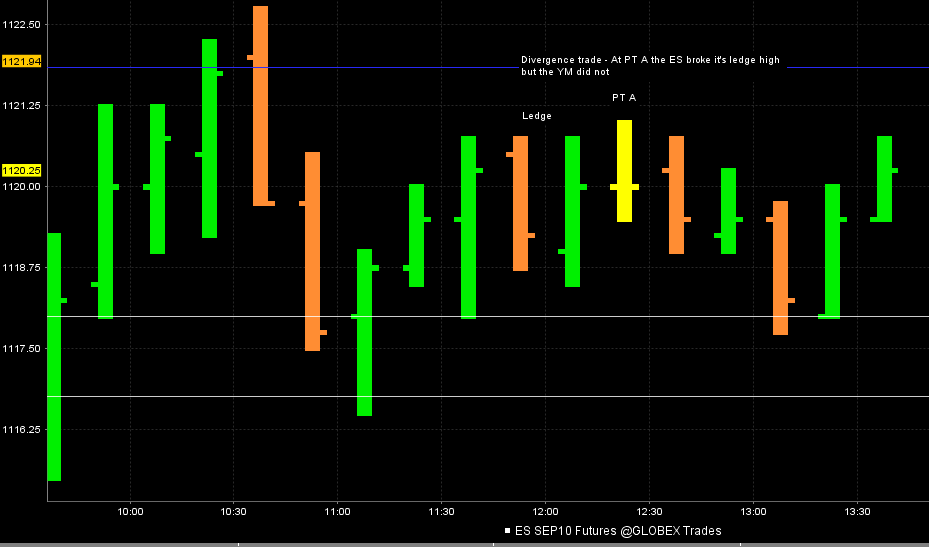
Here was a divergence trade from today...I didn't take this just for the record....these types of trades work better in consolidation periods when they are fishing for orders/stops
Click image for original size
Bruce i never did well with divergences, I can see them, but not trade them. How would you know to short the ES, here, instead of buying the YM. Is their an arb strategy that comes into play (Short the ES and Buy the YM, until they come back together)????
And MM, I'm very interested in your straddle play, if it happens.
Good day guys
Is this an effort you have automated Lorn...? I want one....seriously though, that's a great visual aid...
Originally posted by Lorn
Here is a look at average volume compared to today on a 15 minute basis.
It was tracking nicely until that last 15 minutes.
Click image for original size
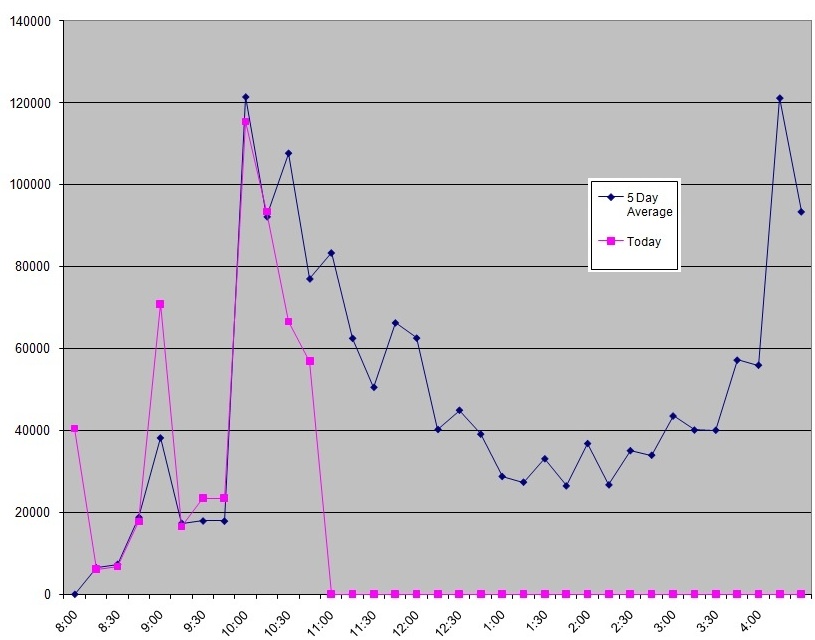
Yea I do this in MS excel...I have to manually enter the volume numbers each 15 minutes but the chart updates automatically for me.
I'll send you my file if you like.
I'll send you my file if you like.
Originally posted by BruceM
Is this an effort you have automated Lorn...? I want one....seriously though, that's a great visual aid...
looks like excel?
I look at it like this:
The weakness of the YM was dragging the ES down so you can sell either one...it's doesn't matter when the divergence trade works...
so if one was making a swing low and the other was trading above it's swing low then you buy either one....
They really only diverge well in consolidations...they tend to trend fairly well other times....but I agree with you that they are difficult trades and we need something nearby to lean on like a key number or something....an understanding of market structure helps..
Look how ES traded up to it's 60 minute high but YM didnot....we just shouldn't be trading anything without CONTEXT
....somebody is really digging that 21.50..on ES
IN consolidatiuons you want to assume that they will go back to the mean of the congestion area....so you don't expect one to lead the other out in those conditions....
Originally posted by sjzeno
Originally posted by BruceM
Here was a divergence trade from today...I didn't take this just for the record....these types of trades work better in consolidation periods when they are fishing for orders/stops
Click image for original size
Bruce i never did well with divergences, I can see them, but not trade them. How would you know to short the ES, here, instead of buying the YM. Is their an arb strategy that comes into play (Short the ES and Buy the YM, until they come back together)????
And MM, I'm very interested in your straddle play, if it happens.
Good day guys
can't you export the data from IRT into excel??
Originally posted by Lorn
Yea I do this in MS excel...I have to manually enter the volume numbers each 15 minutes but the chart updates automatically for me.
I'll send you my file if you like.
Originally posted by BruceM
Is this an effort you have automated Lorn...? I want one....seriously though, that's a great visual aid...
Funny you should ask....I'm still trying to figure that part out.
Originally posted by BruceM
can't you export the data from IRT into excel??Originally posted by Lorn
Yea I do this in MS excel...I have to manually enter the volume numbers each 15 minutes but the chart updates automatically for me.
I'll send you my file if you like.
Originally posted by BruceM
Is this an effort you have automated Lorn...? I want one....seriously though, that's a great visual aid...
I was a programmer for 10 years in the mid 80's and 90's but now I don't know beans about technology...I was a main frame guru...ha !.obsolete skills in todays world and I actually have very little patience for it now...It's no wonder I trade from primitive charts !
No problem Lorn, msg me if need any help
Emini Day Trading /
Daily Notes /
Forecast /
Economic Events /
Search /
Terms and Conditions /
Disclaimer /
Books /
Online Books /
Site Map /
Contact /
Privacy Policy /
Links /
About /
Day Trading Forum /
Investment Calculators /
Pivot Point Calculator /
Market Profile Generator /
Fibonacci Calculator /
Mailing List /
Advertise Here /
Articles /
Financial Terms /
Brokers /
Software /
Holidays /
Stock Split Calendar /
Mortgage Calculator /
Donate
Copyright © 2004-2023, MyPivots. All rights reserved.
Copyright © 2004-2023, MyPivots. All rights reserved.