ES short term trading 8-11-10
Volume numbers I'm using on Wedsneday from the RTH session
1111.25
1114.50
1118.75
We'll confirm in the mornming once O/N session completes.
1111.25
1114.50
1118.75
We'll confirm in the mornming once O/N session completes.
I use 24 hour period (market is traded throughout so I don't dismiss any of it).
I hour time frame on charts.
1063 area is what I would consider to be the next support level. The key for me is "area" not a specific number.
That area is the first area below current price that lead to an undersupply situation into a good price runup. (30 pts.) and it's a fresh retest.
Good luck to all.
Thanks Mike, that information is very valuable. 7/22 gap (1064 to 1078.25) fill that I am looking forward to falls into the 1063 support area. Hopefully we will get that by close of day tomorrow (1615 hrs EDT )
Good luck with your trading.
Good luck with your trading.
Originally posted by Big Mike
I use 24 hour period (market is traded throughout so I don't dismiss any of it).
I hour time frame on charts.
1063 area is what I would consider to be the next support level. The key for me is "area" not a specific number.
That area is the first area below current price that lead to an undersupply situation into a good price runup. (30 pts.) and it's a fresh retest.
Good luck to all.
These "setups" (S/R trading) were represented to be how an acquaintence trades. He is an 8 figure earner, yes $XX,XXX,XXX.00 annually.
Wow! I never heard / read about anyone making that much. The most I heard about was Don Miller (http://donmillereducation.com/journal/ )
Originally posted by Big Mike
These "setups" (S/R trading) were represented to be how an acquaintence trades. He is an 8 figure earner, yes $XX,XXX,XXX.00 annually.
I follow don miller also, I believe he only made 7 figure
It's hard to profit in a bear market! Wicked O/N action that will keep one on their heels.
I posted a chart last night at 1107 area thinking we might get a bounce back up to my Cyan colored line for the open. phht! Wishful thinking from an absent trader today.
The diagonal we had already talked about and the brown line was posted as a diagonal failure target. Note I use tails of candles when drawing lines. The blue line down shows bodies of candles have hit the target.
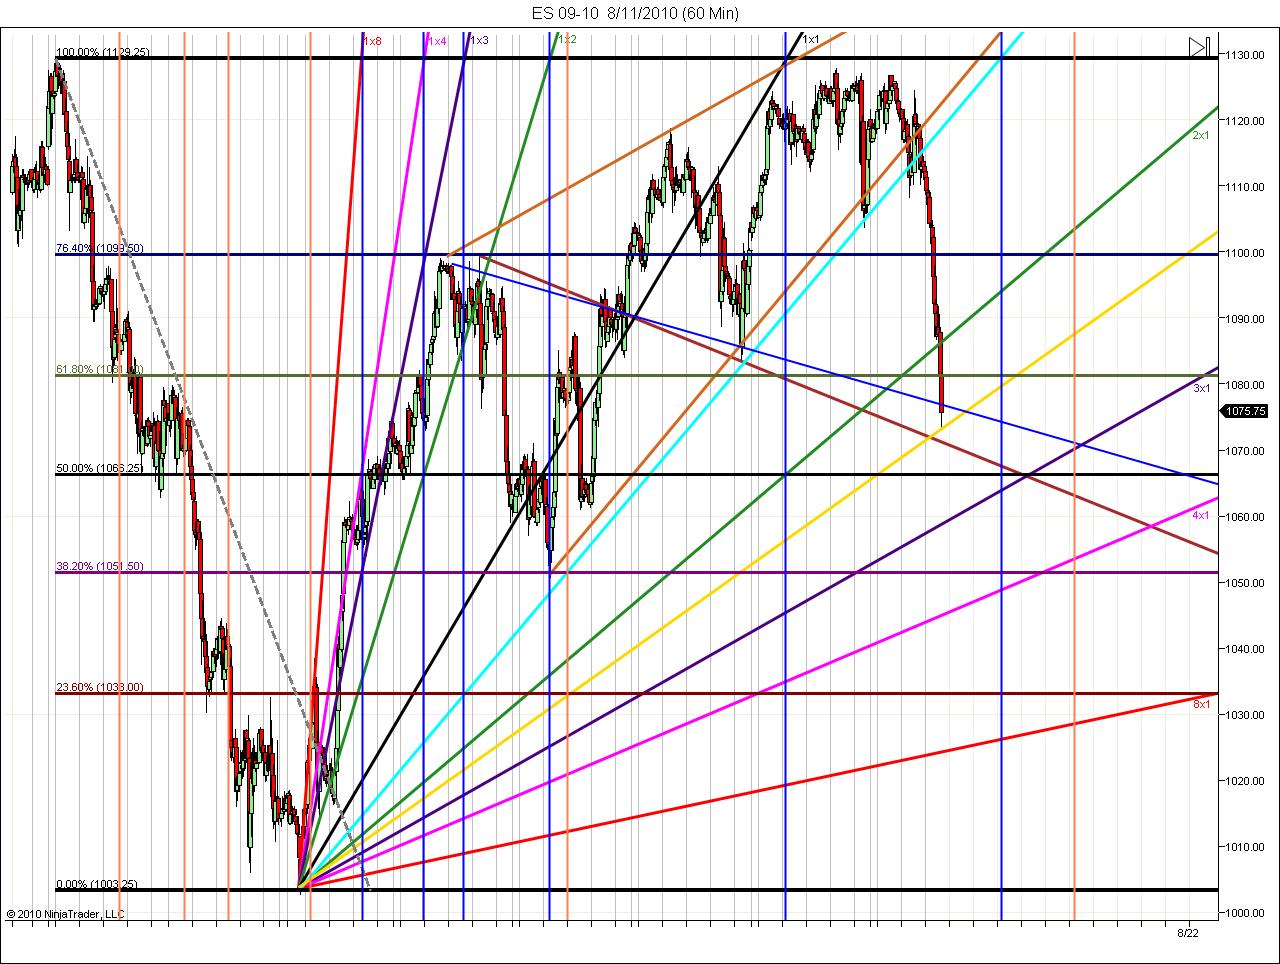
I wanted to share a litle of what I'm learning here. Gann fans and Gann timing.
The Gann fan black line is the most important. It's kind of like a 50% S/R line but at diagonal vs. the traditional horizontal level. Above is strength, below is weakness. One can see how price was attracted to it in this chart, until it left it to go sideways after 1124 was hit.
The Cyan colored line I added as my charts don't include it. In studying, I noted several lessons included this line in examples of a Gann Pyramid. Imagine it right side down with the apex of the pyramid at the top. It's always on the left side of the 1x1 Black line in such diagrams and divides that section of the pyramid. If anyone knows different, I'd be obliged if you would feel free to correct and inform me.
The vertical dark blue lines are intersections of the fan lines with the box top and bottom created by the fib retracement levels. They're supposed to be of some significance, ie; timing,high, or low,or maybe change in trend. I have not included descending fan lines from the previous high as I wouldn't want to make this too many lines on the chart. :) I did however, include the Coral vertical lines denoting their intersections to date. They appear to have been significant in the origianal decline from 1129 and the ultimate reversal at the bottom.
The ascending yellow trendline should be moved up or down with lower and higher lows as it's all I know that will tell you anything unless we rapidly ascend back above 1100(after brown line target reached). S levels per fibs and Gann fan lines on chart and 50% at 1066.25 (50% not really a fib number). So far, everything acting like hot butter to price. .
Even though I missed todays trading I think there must be some really confident shorts out there, or hardly any at all? That's some sharp down move. Can it be corrective,? Sure. We'll see.
I posted a chart last night at 1107 area thinking we might get a bounce back up to my Cyan colored line for the open. phht! Wishful thinking from an absent trader today.
The diagonal we had already talked about and the brown line was posted as a diagonal failure target. Note I use tails of candles when drawing lines. The blue line down shows bodies of candles have hit the target.
I wanted to share a litle of what I'm learning here. Gann fans and Gann timing.
The Gann fan black line is the most important. It's kind of like a 50% S/R line but at diagonal vs. the traditional horizontal level. Above is strength, below is weakness. One can see how price was attracted to it in this chart, until it left it to go sideways after 1124 was hit.
The Cyan colored line I added as my charts don't include it. In studying, I noted several lessons included this line in examples of a Gann Pyramid. Imagine it right side down with the apex of the pyramid at the top. It's always on the left side of the 1x1 Black line in such diagrams and divides that section of the pyramid. If anyone knows different, I'd be obliged if you would feel free to correct and inform me.
The vertical dark blue lines are intersections of the fan lines with the box top and bottom created by the fib retracement levels. They're supposed to be of some significance, ie; timing,high, or low,or maybe change in trend. I have not included descending fan lines from the previous high as I wouldn't want to make this too many lines on the chart. :) I did however, include the Coral vertical lines denoting their intersections to date. They appear to have been significant in the origianal decline from 1129 and the ultimate reversal at the bottom.
The ascending yellow trendline should be moved up or down with lower and higher lows as it's all I know that will tell you anything unless we rapidly ascend back above 1100(after brown line target reached). S levels per fibs and Gann fan lines on chart and 50% at 1066.25 (50% not really a fib number). So far, everything acting like hot butter to price. .
Even though I missed todays trading I think there must be some really confident shorts out there, or hardly any at all? That's some sharp down move. Can it be corrective,? Sure. We'll see.
Click image for original size
You are not out of line by any means Mike. I'm a fader most of the time and try to learn to lose less on trend days. Most consider today a trend day but I donot. All my trades where fades until the later part of the day. You can go look through the thread if that matters.
I find most are quick to point out areas AFTER the day is done and what they think is obvious. Your comment would have to fall into this category. No offense.
So why would I be a trend trader if we only trend 20% of the time or less? Today we spent over 4 hours in between 1091.75 and 1085.75...not much trend there. I have yet to see anyone post on any forum or paltalk room ahead of time or while the trade is happening and catch the trend days...at least not since the year 2000 or so.
Now if you draw up some charts and we can "see" what you are referring to and you can call these trades over time then that would mean something. A repeatable pattern or methodology perhaps. So what may be Obvious after the day is done is not always so obvious as the day unfolds.
Hope this isn't taken the wrong way but telling me you were "all over it" and implying you were short doesn't expand my knowledge...you get my drift man....for the newbie reading this I don't want anyone to be frustrated by missing a big move overnight...16 points of range in RTH...no biggie....how often would you hold On and be wrong...?
Ok, that's my direct response to that..we do the best with the clues we have
Originally posted by Big Mike
I have a question, don't hesitate to say if I'm out of line. Is everyone in this thread always fading and never trend following?
If always fading, I can understand the observations. If not, why, when price broke below 1106 area (8/6 support) wasn't it obvious that the next support level to be tested was 1092 area based on 7/30 equilibrium?
I was out all day, but my partner (and I via phone) were all over it.
These are the 20 pointers I was referencing a few weeks ago.
Good luck to all
LOL Bruce I kind of felt the way you did about that post, however I am lacking your diplomacy when dealing with such feelings. I also have suffered in the past with trend days and like you are becoming more able to deal with them. Like you with the ES down 25+ and average range recently at 23-25 Shorting or looking for more downside for the day seems like a very low probability. Standing aside for both of us was certainly a wise move.
Emini Day Trading /
Daily Notes /
Forecast /
Economic Events /
Search /
Terms and Conditions /
Disclaimer /
Books /
Online Books /
Site Map /
Contact /
Privacy Policy /
Links /
About /
Day Trading Forum /
Investment Calculators /
Pivot Point Calculator /
Market Profile Generator /
Fibonacci Calculator /
Mailing List /
Advertise Here /
Articles /
Financial Terms /
Brokers /
Software /
Holidays /
Stock Split Calendar /
Mortgage Calculator /
Donate
Copyright © 2004-2023, MyPivots. All rights reserved.
Copyright © 2004-2023, MyPivots. All rights reserved.