ES Short Term Trading 8-18-2010
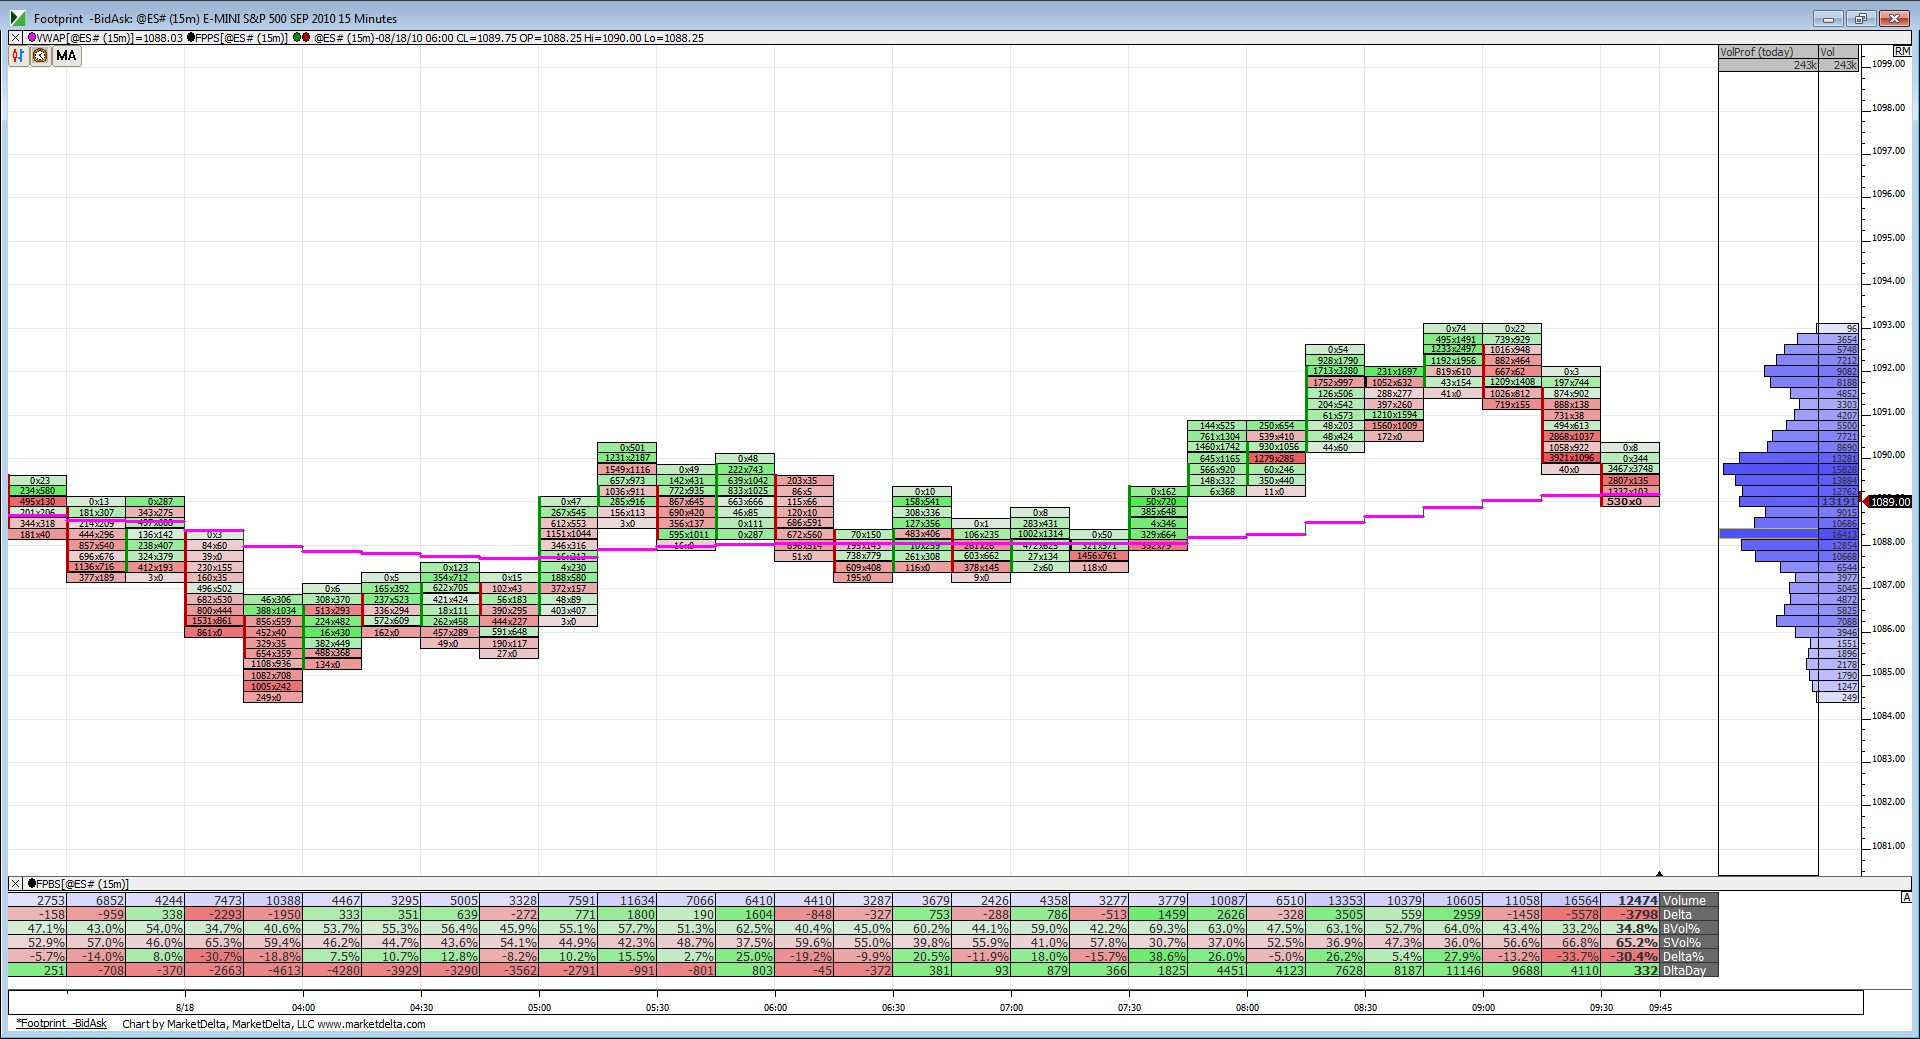
Footprint chart here at the open. Lets see how VWAP and prices respond to RTH volume.
Click image for original size
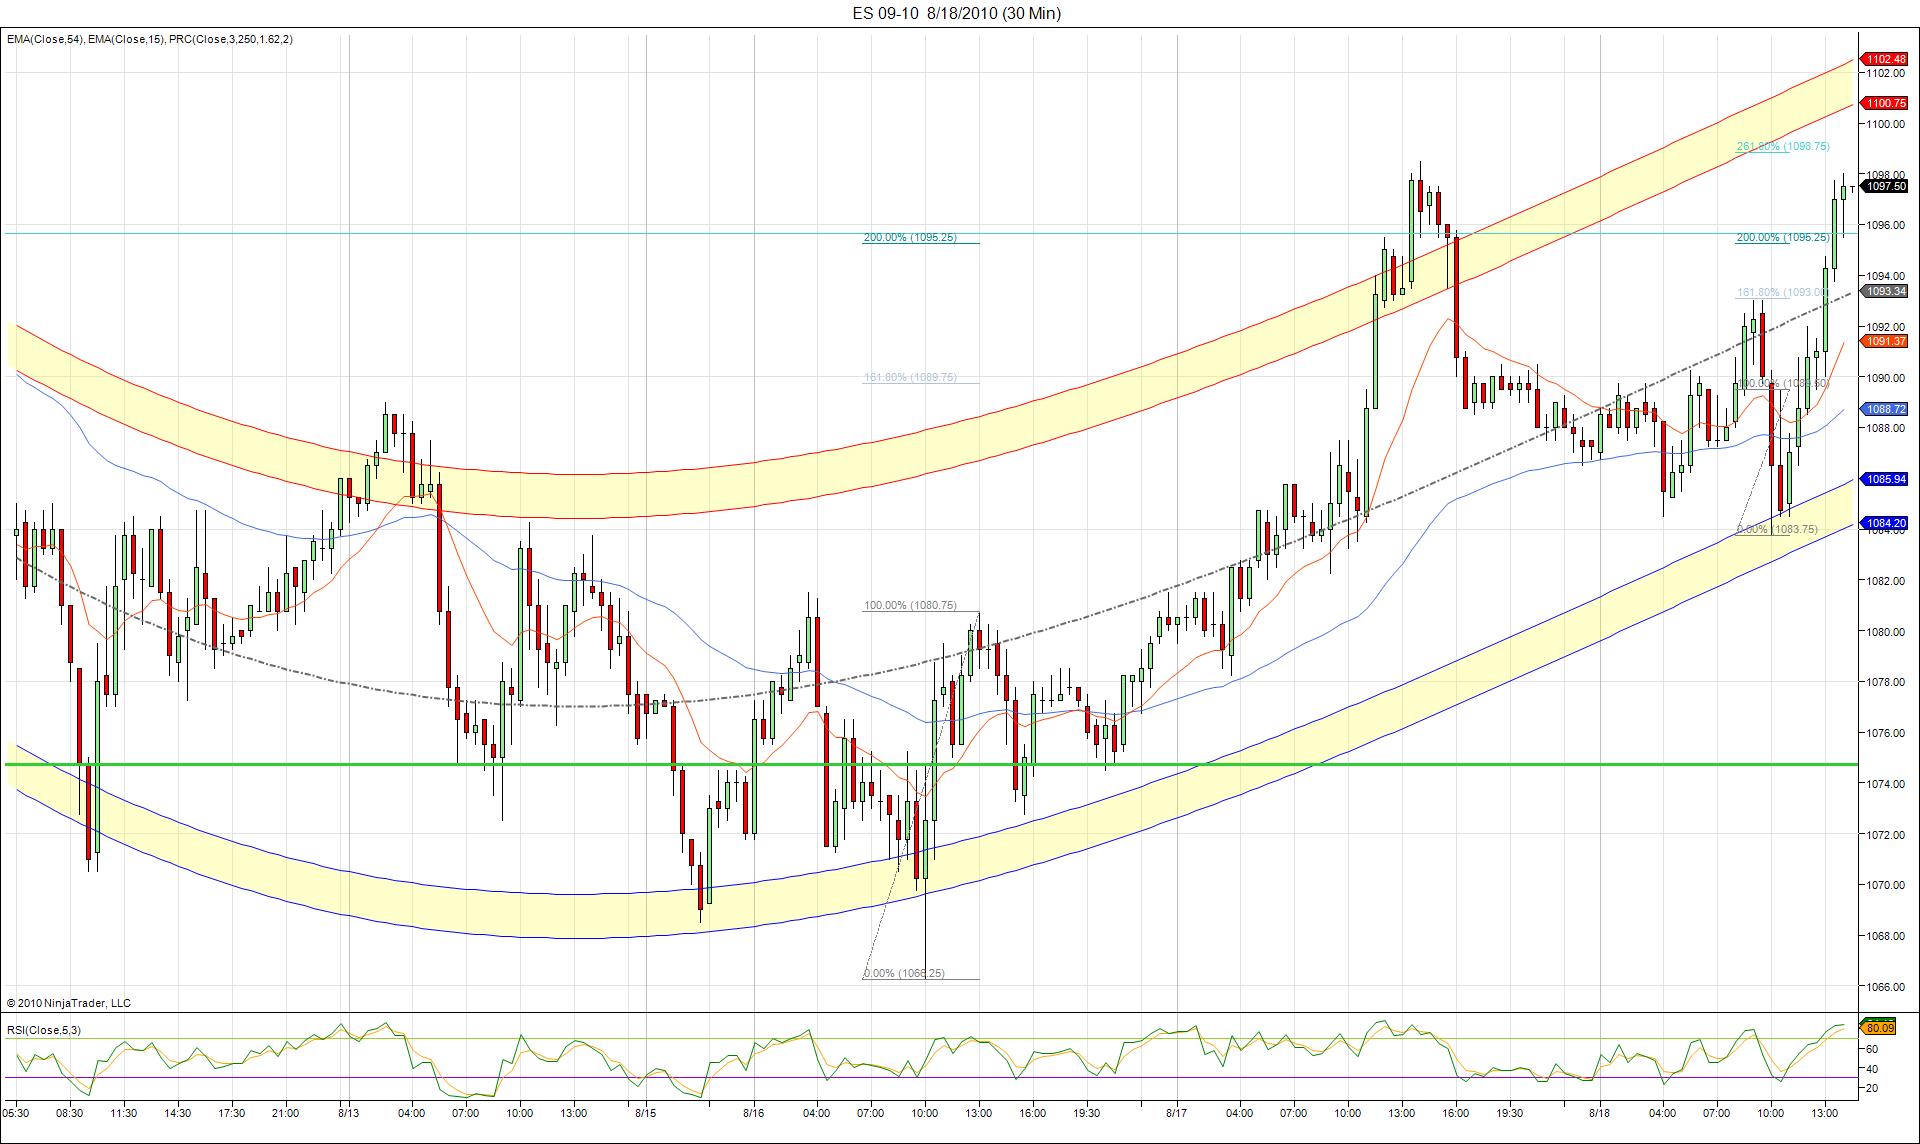
trying sells off the 90 now...93 area needs monitoring if early
87.50 is still LV prices...
Bruce how are you viewing or what are you expecting from LV in price.
And Im showing a 5 min lower vol at 91
Yesterday's high is going to be an interesting level right here.
Click image for original size
Hi Rb,
Just got back from a swim and some errands...I would have expected another retest to fill that in and would have been wrong. The 89 - 90 area was/is a key area due to what happened yesterday and the way we closed, the peak volume, vwap and the va low was there..so lots of playerer were watching that...
Right now I'm short for the triple run into the 95.50...that was another ket price from YD afternoon...
In the back of my mind I know they want to run out a high or low from the monday - tuedsay range so I am approaching fades up here with caution.
In general I am glad I was away from the market as I would have attempted at least one short that I know of that wouldn't have gone very far.
Something I watch but don't mention often is VWAP....YD closing Vwap was 90.50...so once we started the rally this morning we were not only above todays Vwap but YD vwap....in general a bullish sign...doesn't mean we can't fade but it is harder...
we also made an Outside bar aginst ALL of the O/N trade to the upside...just some thing to think about
Originally posted by rburns
Bruce how are you viewing or what are you expecting from LV in price.
if we are real lucky we will get the 92.75 retest but expecting the afternoon sell off two days in a row is asking much...
92.75 is air and the other key number from yesterday....see how that became O/N high
92.75 is air and the other key number from yesterday....see how that became O/N high
Here is the footprint chart with an additional column on the right. Delta profile. Green is volume hitting the ask price. Red is volume hitting the bid price. The size of the bar represents the proportion between the two not the actual volume. Line up any big volume bars with big delta bars and you can see big selling or buying going on.
Click image for original size
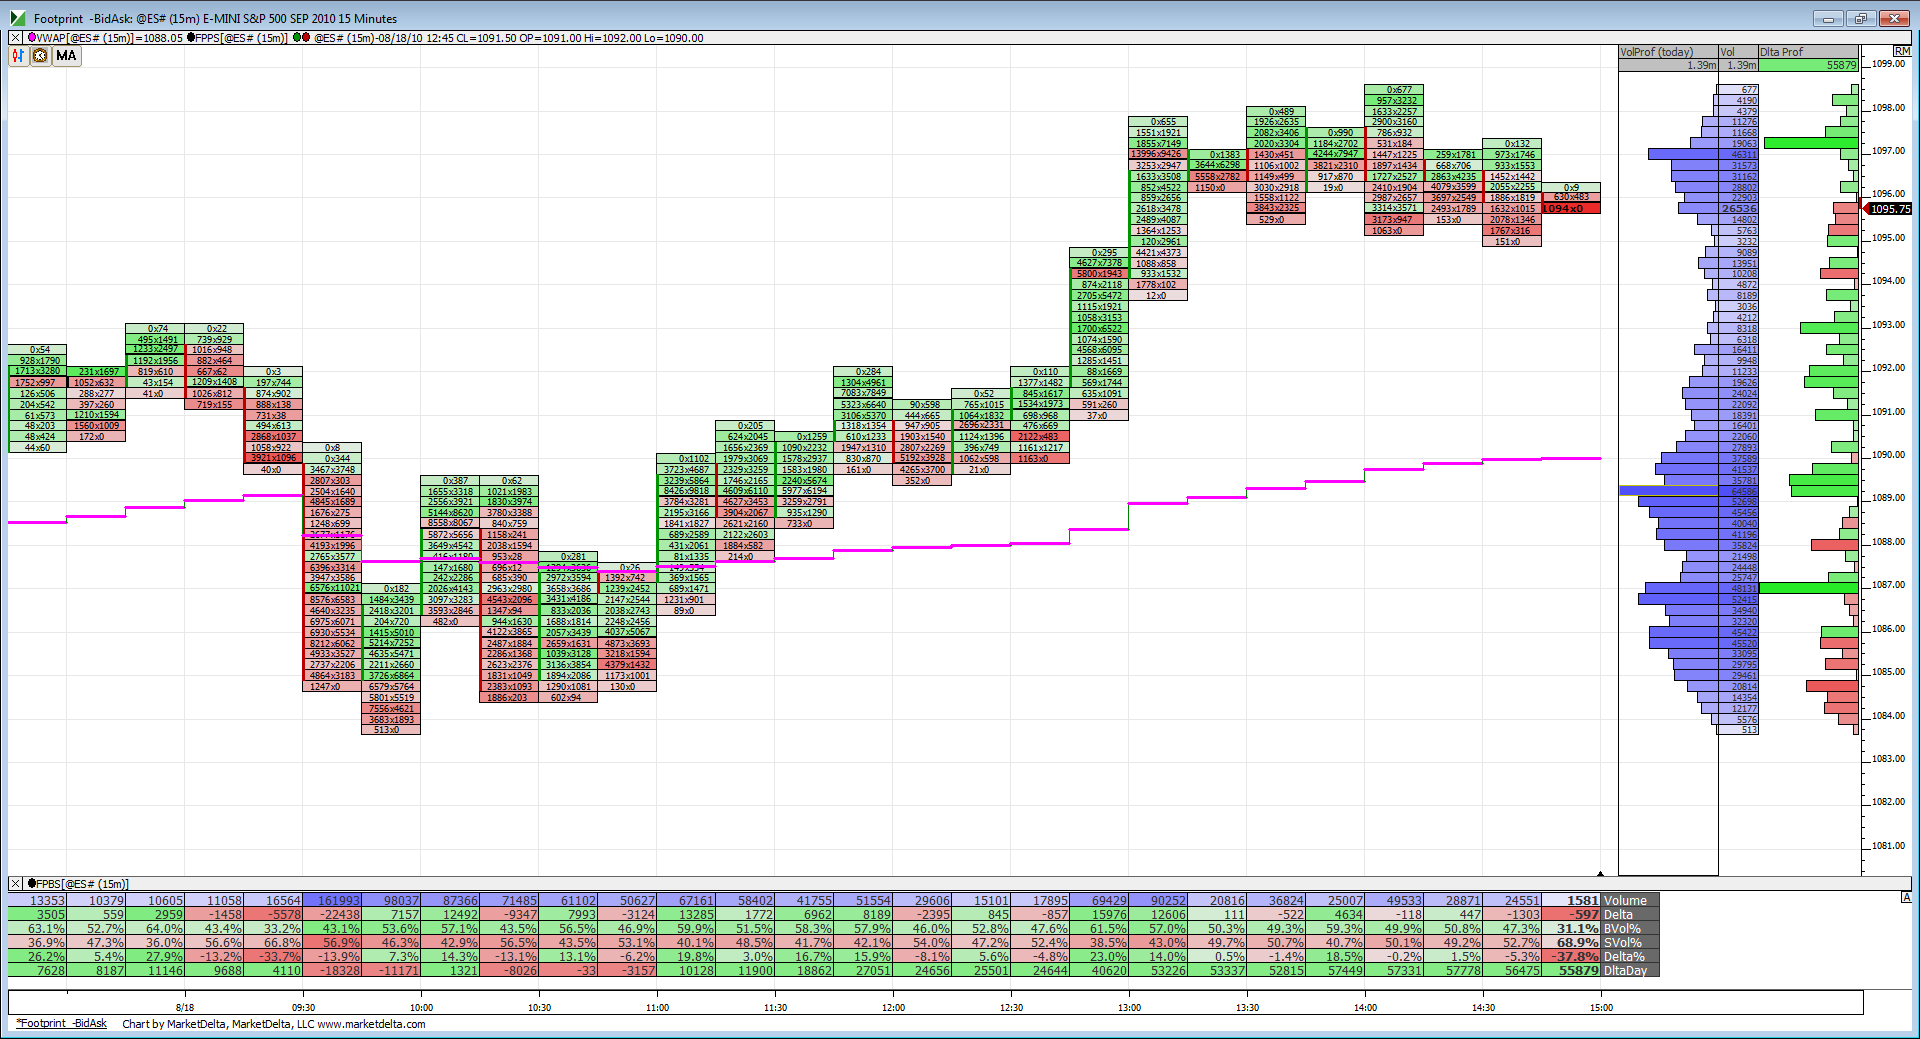
One more comment. I think its important to view where prices have gone in relation to the big volume/delta bars. If prices have rallied (like they did from that 1087 number) then its very clear buyers were in charge. However look at 1097.25, we have big green delta and big volume in the 1097/1097.25 area but price is still consolidating.
Good stuff Paul. I don't want anyone to feel they need to post while trading. In general its a stupid idea ! The only thing I hate is when folks come on here and tell us how long or short they are without any reasonable explainations. Those folks know who they are !
We certainly don't need anymore pressure while trading. For me it just evolved due to some "problems" I had with some vendors.
I've often thought about starting a "trading statements" thread so we could post a few years of statements to prove we actually trade but that wouldn't prove we trade the ideas we write/babble about. I'm also not sure that would resolve some of the wise ass comments and emails from the vendor crowd or the non-believers. Might be more trouble than it is worth.
Anyway, I too appreciate all the ideas that are shared here and none of us are TOO good that we can't get better. So please post whenever you feel you can and hope you enjoy that dinner!
Emini Day Trading /
Daily Notes /
Forecast /
Economic Events /
Search /
Terms and Conditions /
Disclaimer /
Books /
Online Books /
Site Map /
Contact /
Privacy Policy /
Links /
About /
Day Trading Forum /
Investment Calculators /
Pivot Point Calculator /
Market Profile Generator /
Fibonacci Calculator /
Mailing List /
Advertise Here /
Articles /
Financial Terms /
Brokers /
Software /
Holidays /
Stock Split Calendar /
Mortgage Calculator /
Donate
Copyright © 2004-2023, MyPivots. All rights reserved.
Copyright © 2004-2023, MyPivots. All rights reserved.