ES short term trading 8-19-10
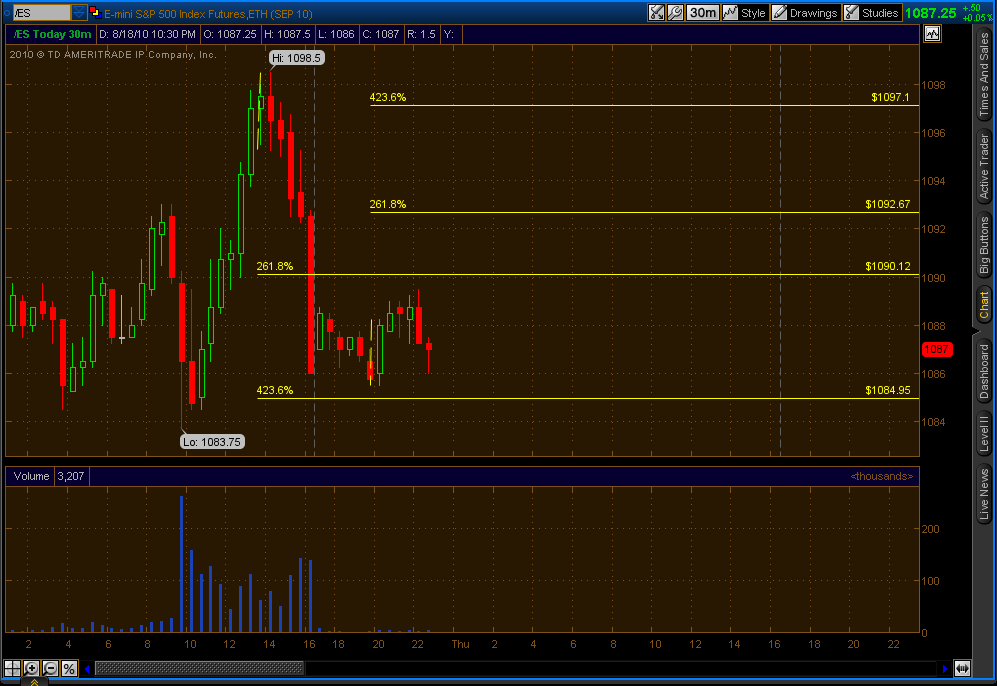
Key numbers based on Volume spikes today
1086.5
1092.75
1097.25
We will get another spike at the 8:30 a.m reports.
A failure to breakout of the Monday-Tuesday range today. 32 points of range so the longer term players will try and push it at least 16 points above the highs or 16 points below the lows
1086.5
1092.75
1097.25
We will get another spike at the 8:30 a.m reports.
A failure to breakout of the Monday-Tuesday range today. 32 points of range so the longer term players will try and push it at least 16 points above the highs or 16 points below the lows
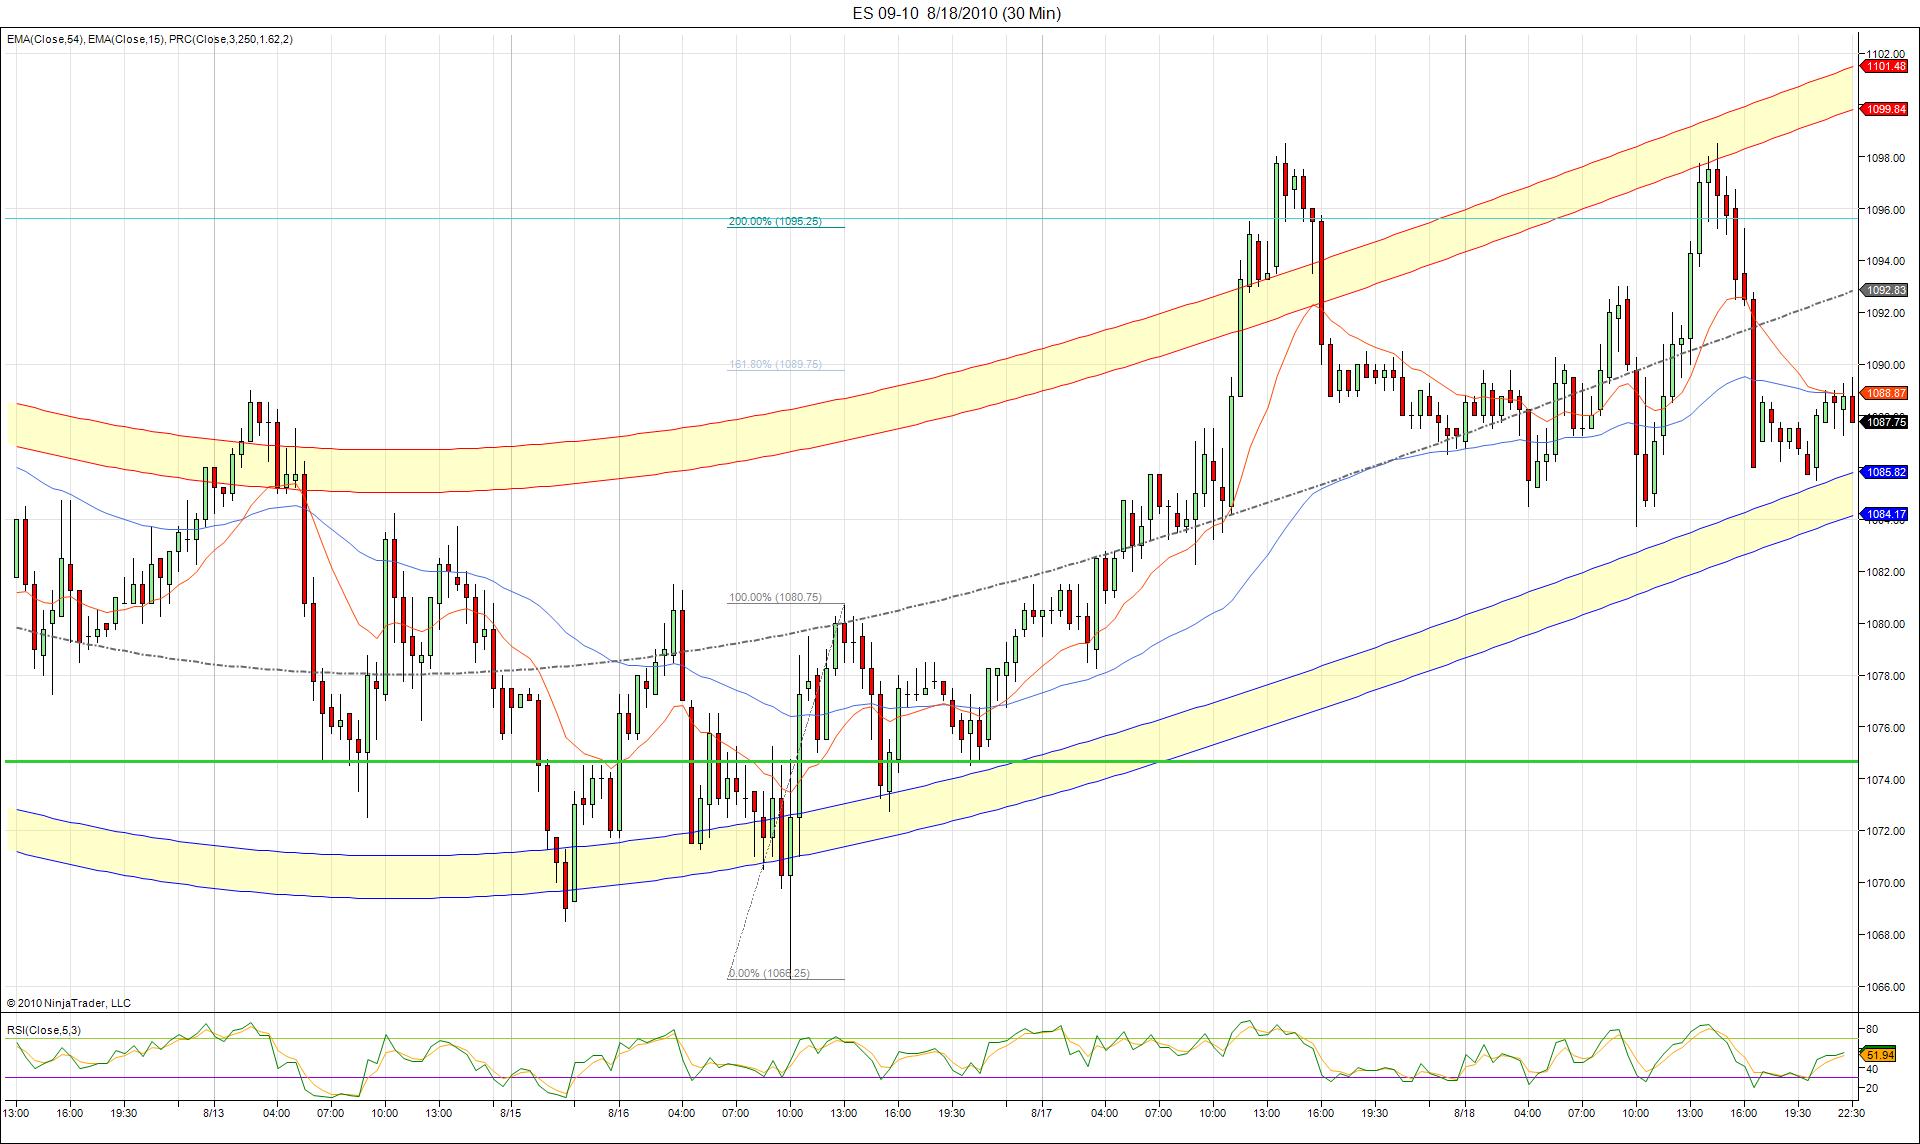
A look at 30 min PRC. Bands are still rising but notice the MA convergence.
Click image for original size
Bruce if the 85.5 continues to hold in the O/N. Kools method would coincide with both your 90 numbers.
Click image for original size
Have you noticed if options exp. week has any affect on what the longer term players might do?
Originally posted by BruceM
A failure to breakout of the Monday-Tuesday range today. 32 points of range so the longer term players will try and push it at least 16 points above the highs or 16 points below the lows
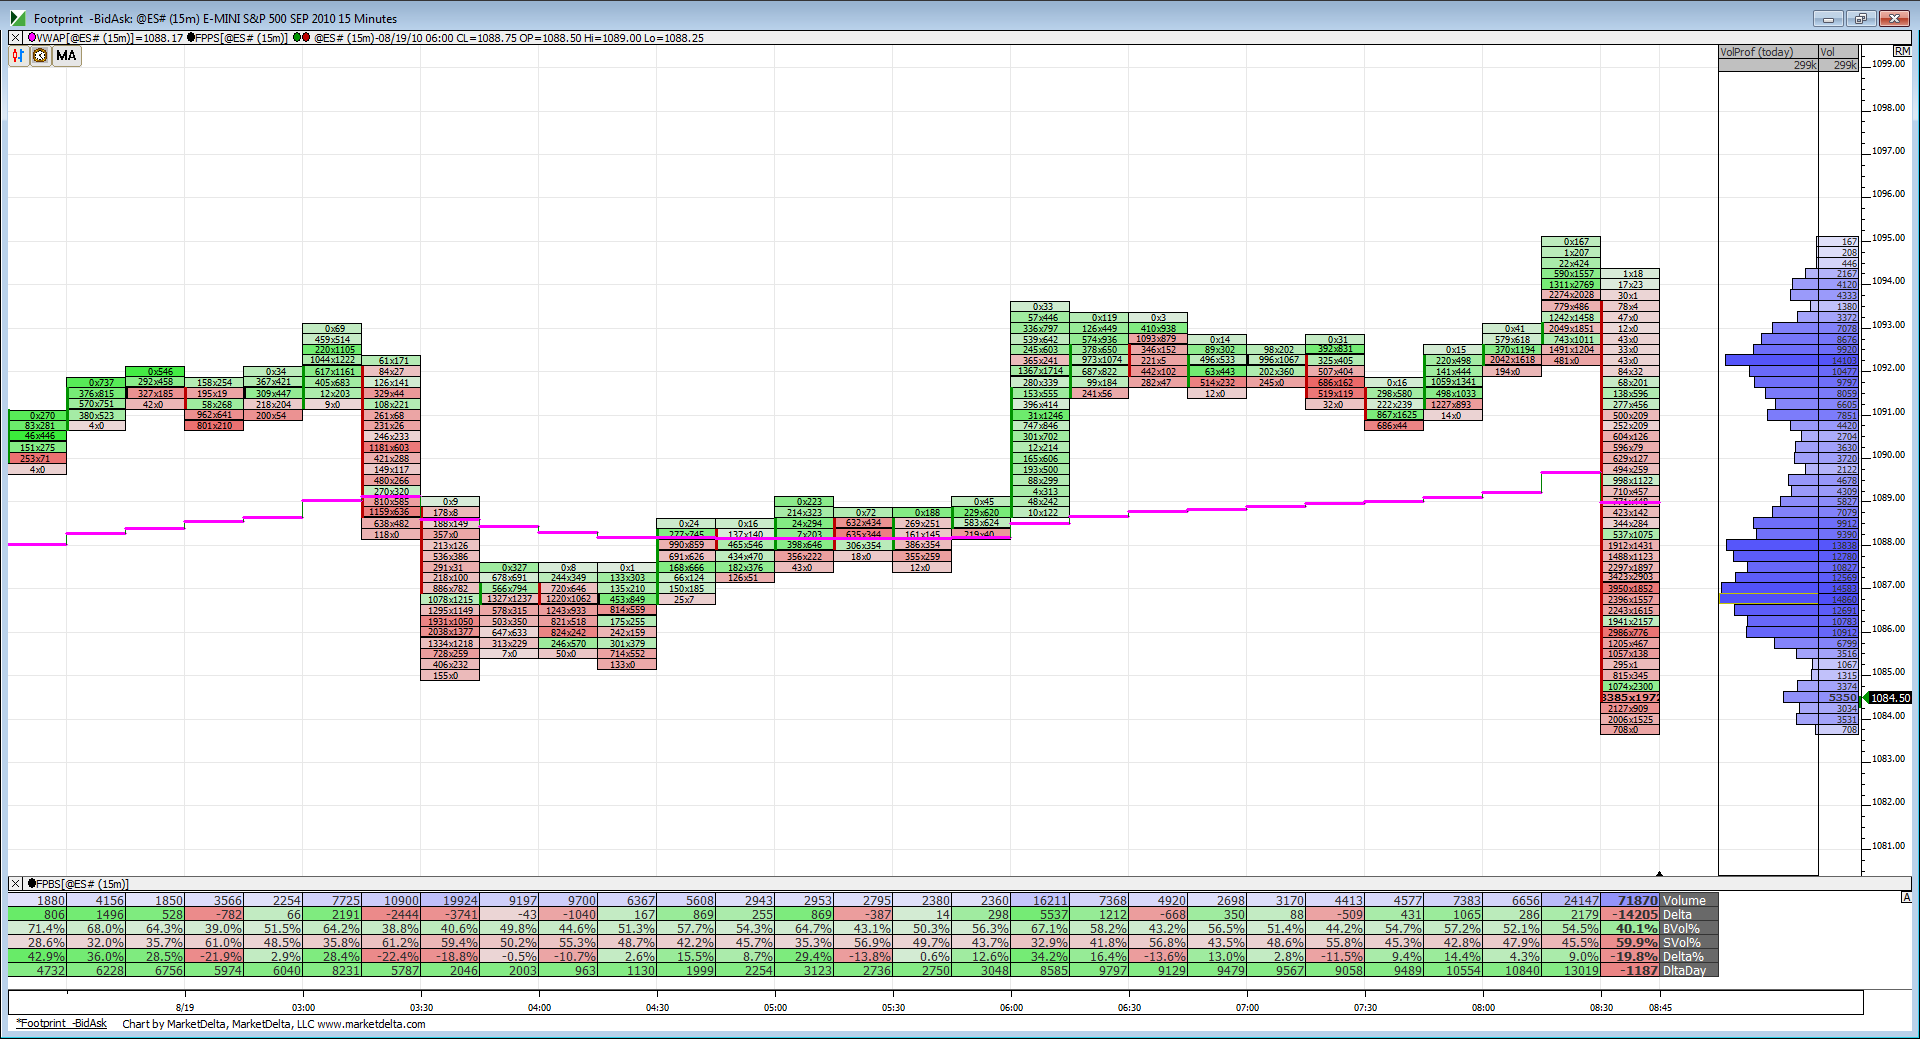
Footprint chart after the 8:30 news. Volume node up in the 1092 area and now volume building between 1086-1088. New lows for O/N but finding support here on yesterday's low. Can it hold?
Click image for original size
Same here Lorn..
My key zones are the 86 - 87 and 92.75 - 94
My key zones are the 86 - 87 and 92.75 - 94
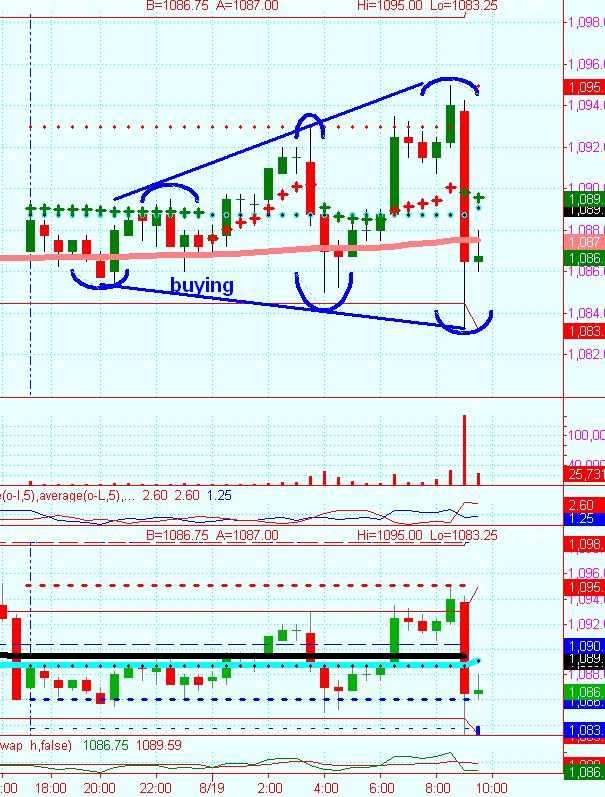
doesn't happen very often, but there is a potential volatility fan in place in the overnight.
volatility fan is successive swings that take out previous swing H and L in search of buyers and sellers, called a fan because the swings get bigger and biugger as price searches for new meat.
see cahrt below.
this is not perfect (but it's the best one I've seen in months) because of the bar marked "buying," but all the other swings satisfy.
The key here is looking for a failure at or near 50% of the prior swing.
50% of the big last swing is 89.25, virtually the same as pivot point calculated in classic formula and doesn't matter whether you use RTH only or 24 hour prices, both virtually the same, near 89.25.
if price is failing at/near that level and is rejected, leg down to retest and/or undercut swing L of 83.25 can unfold.
these are just potentials, "can" retest prior swing L is not "will"
If Price moves above 89.25 area and established new swing H, then a retracement that returns and finds buying support near 50% of that swing from H to L can be first step for a move higher.
this formation similar to front half of a diamond pattern, for people with Suri Duddella's book, pages 116-117.
this pattern is the product of uncertainty,
no one is sure where the real buying or selling is and price is swinging in search of unleashing VOLUME. (And if it does unleash volume, Bruce's volume spike rules could be in play)
might be my only post.
Click image for original size
Starting the day out including O/N with 2 outside HH LL trades. I guess this forms a double megaphone pattern and I am clueless what that means. Any comments?
It means pretty much what Paul is saying in his above post. Trying to break out of the range we have been in but no one really has a directional bias, just looking for new volume to come in with those HH, LL's.
Originally posted by rburns
Starting the day out including O/N with 2 outside HH LL trades. I guess this forms a double megaphone pattern and I am clueless what that means. Any comments?
I trust nothing in here...I'm trying to figure out which one they want to test first...the 84 area or the 94...LOL
I'm waiting for one of those numbers to test first...
volume is light so without it coming back in we may see more inside trade or reversion trade....on the flip side we have two days of consolidation...the same prices so they may try and break it out
Gheesh...as I type the are testing/////looking for longs down here in the 84 area
Joe they are PRC Bands. I've only found this particular indicator for Ninja Trader. No other platforms.
There are two different ones available. PRC and PRC2. I like PRC better, it responds a little slower which seems to keep prices from jumping ahead of the bands too much.
There are two different ones available. PRC and PRC2. I like PRC better, it responds a little slower which seems to keep prices from jumping ahead of the bands too much.
Originally posted by CharterJoe
Lorn,
What are those upper and lower shaded bands on your chart?
Emini Day Trading /
Daily Notes /
Forecast /
Economic Events /
Search /
Terms and Conditions /
Disclaimer /
Books /
Online Books /
Site Map /
Contact /
Privacy Policy /
Links /
About /
Day Trading Forum /
Investment Calculators /
Pivot Point Calculator /
Market Profile Generator /
Fibonacci Calculator /
Mailing List /
Advertise Here /
Articles /
Financial Terms /
Brokers /
Software /
Holidays /
Stock Split Calendar /
Mortgage Calculator /
Donate
Copyright © 2004-2023, MyPivots. All rights reserved.
Copyright © 2004-2023, MyPivots. All rights reserved.