ES Short Term Trading 8-30-2010
Range Based S/R
R1 = 1071.25
S1 = 1030.50
R2 = 1078.25
S2 = 1023.75
Weekly
R1 = 1091.00
S1 = 1026.25
R2 = 1101.75
S2 = 1015.25
Steenbarger Pivot = 1057.50
R1 = 1071.25
S1 = 1030.50
R2 = 1078.25
S2 = 1023.75
Weekly
R1 = 1091.00
S1 = 1026.25
R2 = 1101.75
S2 = 1015.25
Steenbarger Pivot = 1057.50
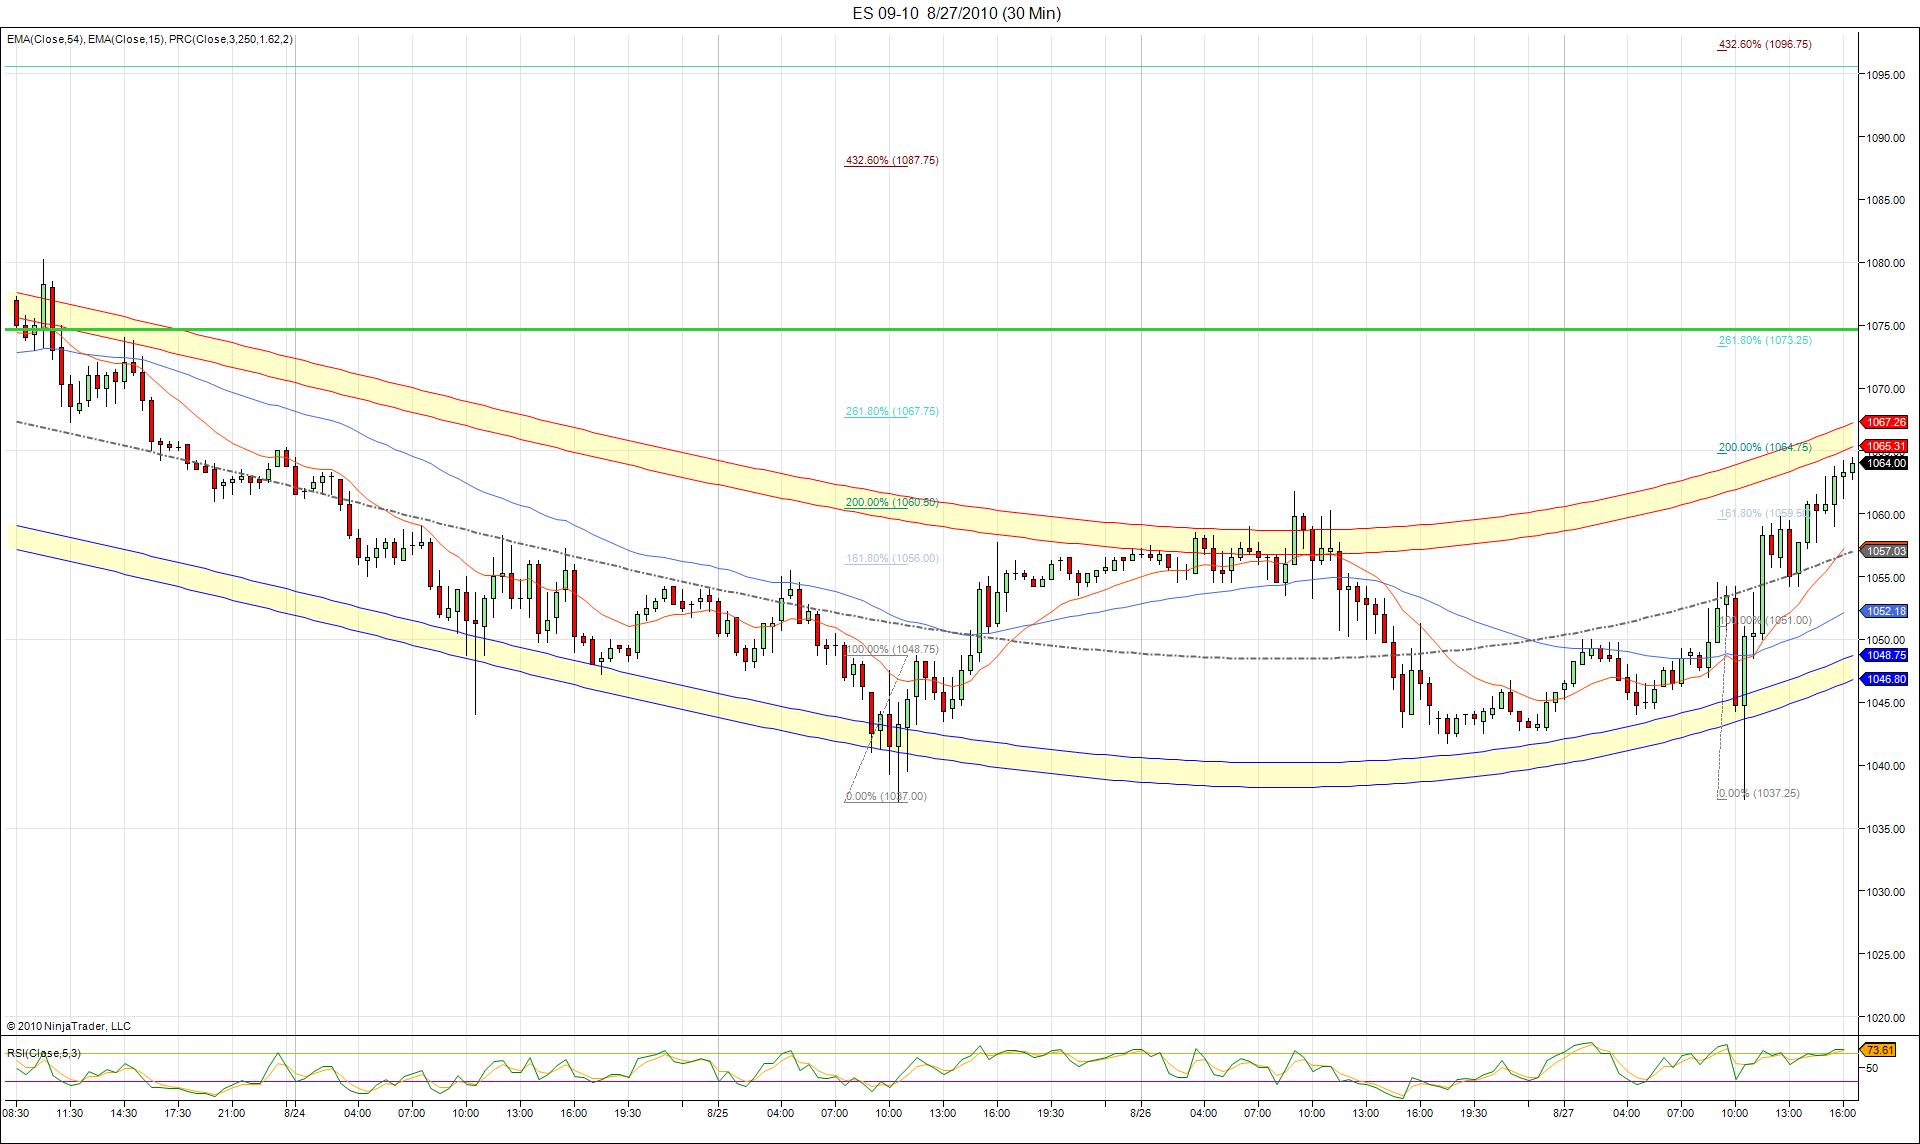
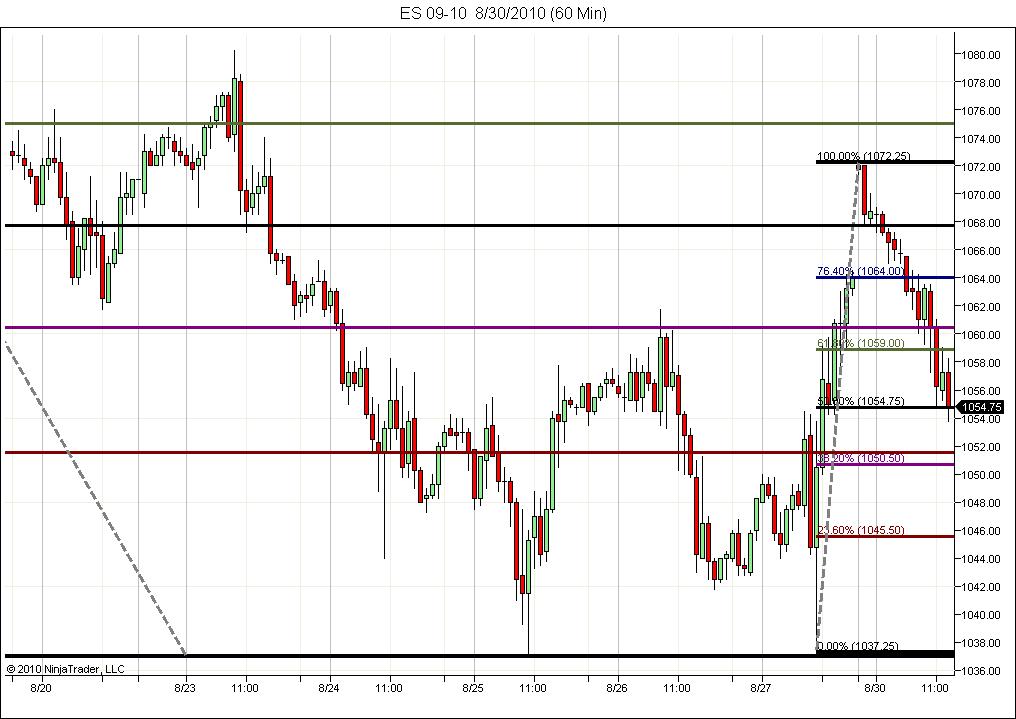
Here is a 30-min PRC with projections to start off the new week. Note how prices have reacted at each level so far. Neither projection up to this point has seen prices move to the 2.618 level of there respective projections.
Click image for original size
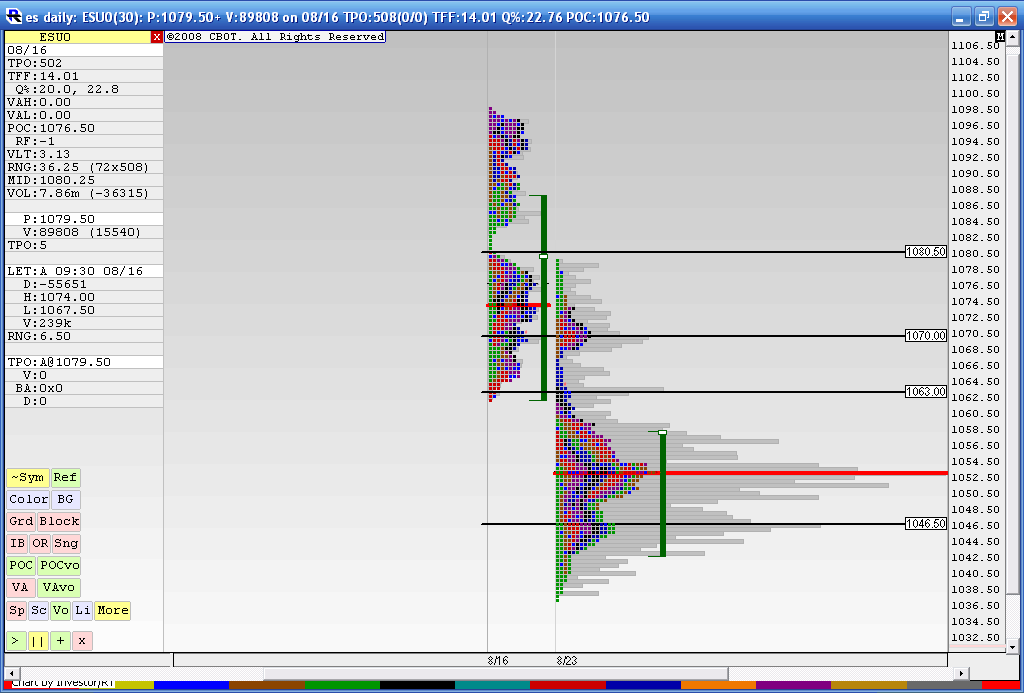
here is last week VP against the previous week.....Big volume in the 51 - 55 area last week and we created the "b" profile...
69 - 70 is also attracting lots of attention and the 46 area...If we can hold that 51 - 55 especially on a closing basis then we should be on our way to test the 80 - 85 area soon
69 - 70 is also attracting lots of attention and the 46 area...If we can hold that 51 - 55 especially on a closing basis then we should be on our way to test the 80 - 85 area soon
Click image for original size
key zones/numbers I'll be using today
46-47
55 - 57
64.50
70 -73
80
They may need to test that weekly/daily Vwap down at 55 area today...lets not all be too bullish....look for a fade rallies type of day.....day after a big trending move
prefered trade is short above last fridays highs....with high $tick
46-47
55 - 57
64.50
70 -73
80
They may need to test that weekly/daily Vwap down at 55 area today...lets not all be too bullish....look for a fade rallies type of day.....day after a big trending move
prefered trade is short above last fridays highs....with high $tick
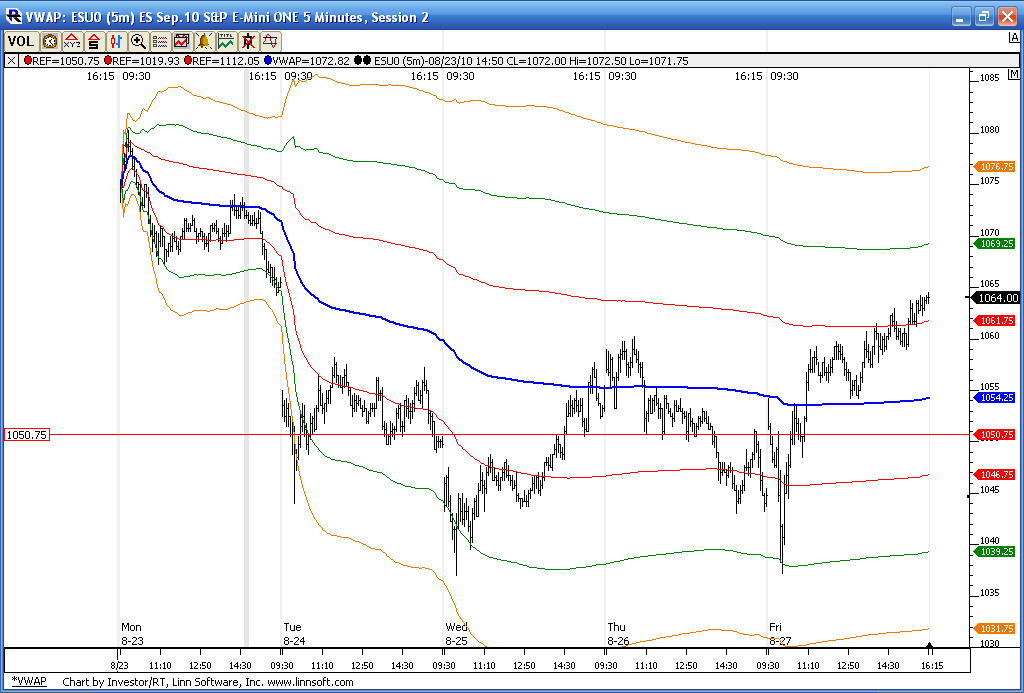
A look at the action into the open. Prices have been trading underneath VWAP. Lets see if RTH changes that.
Click image for original size
I havent made a trade yet today. Looks like no one else is very active.
Volume is extremely light. I know a bunch of people are at the beach today.
Originally posted by rburns
I havent made a trade yet today. Looks like no one else is very active.
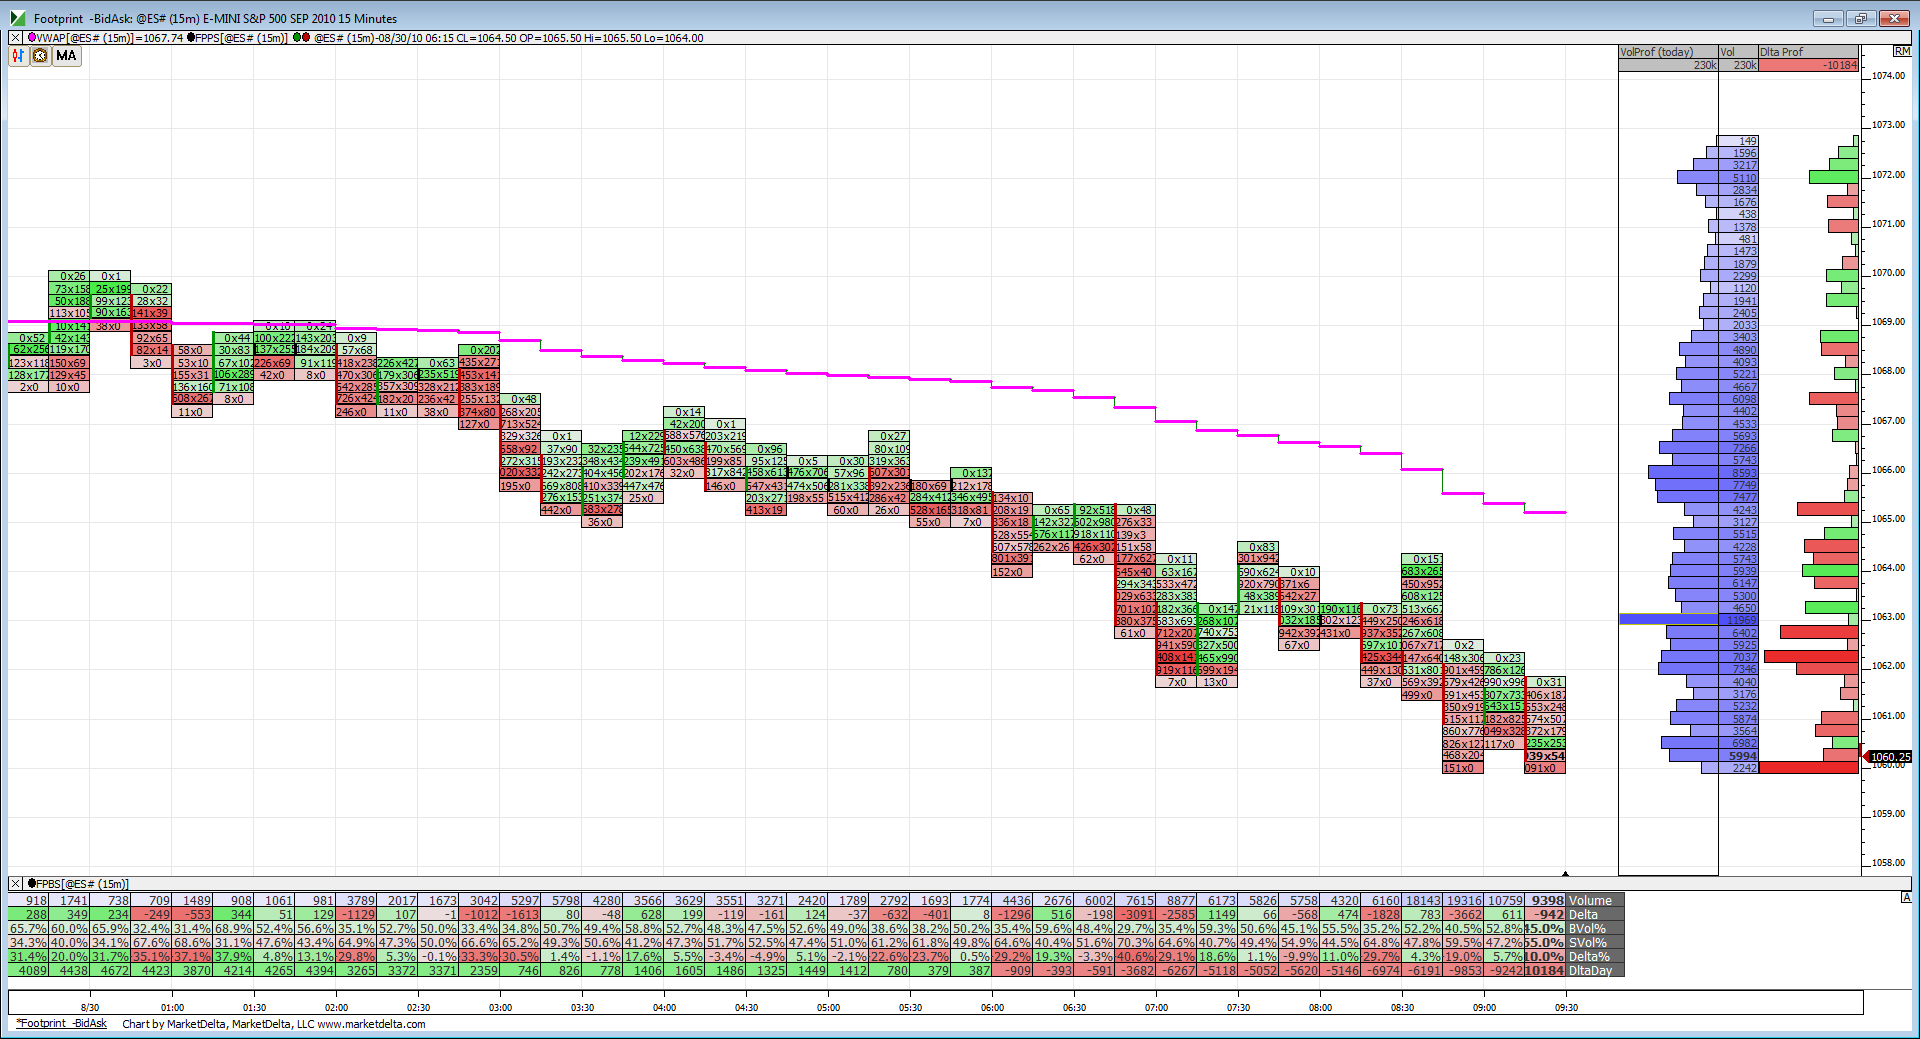
NQ is stubbornly holding support at its O/N lows while everything else is beneath those lows. With what little volume there is today it is coming in on the sell side. Will be interesting to see what happens if NQ decides to join the gang.
Click image for original size
So far all it has done is pierce the downtrend line from the 1128 high. Still lower highs. If a reversal will have to break and hold a previous high.
1066 mean S/R and downtrend line now below it at 1065 here.
1080 another hurdle for R.
Watching BKX 43.50(currently under), GS,AAPL.
INTC was the bad news bear Friday and hanging at 18 so far. I would think any shot at up would include a semi rally. News was that chip sales increased significantly year over year but can't tell from any prices I watch yet.
Nothing looks positive here right now.
1054.75 S/R and all that's under and over.
Emini Day Trading /
Daily Notes /
Forecast /
Economic Events /
Search /
Terms and Conditions /
Disclaimer /
Books /
Online Books /
Site Map /
Contact /
Privacy Policy /
Links /
About /
Day Trading Forum /
Investment Calculators /
Pivot Point Calculator /
Market Profile Generator /
Fibonacci Calculator /
Mailing List /
Advertise Here /
Articles /
Financial Terms /
Brokers /
Software /
Holidays /
Stock Split Calendar /
Mortgage Calculator /
Donate
Copyright © 2004-2023, MyPivots. All rights reserved.
Copyright © 2004-2023, MyPivots. All rights reserved.