ES Short Term Trading 9-21-10
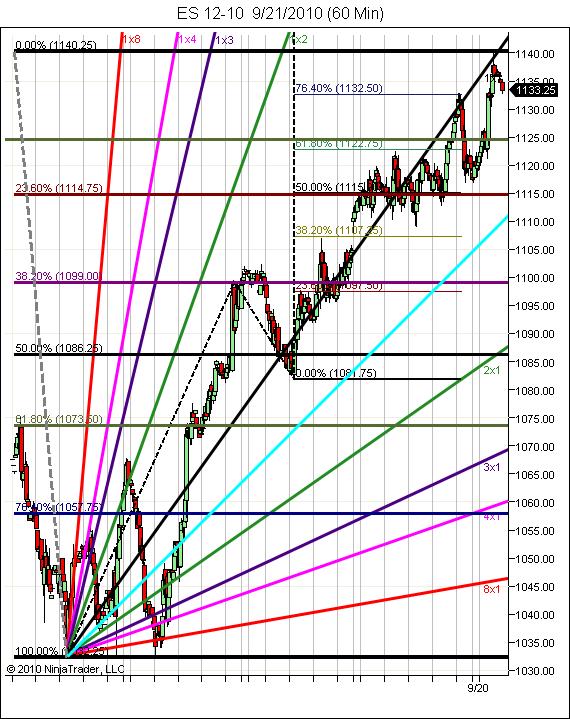
1137 hit and exceeded.It was the minimum target for a wave C up from 1035 and nothing more than 1137 is required of EW rules if indeed a C wave. However, an equal move for a C wave would equal an 1160 target.If that comes to pass, C waves can be larger than A waves and usually are equal to or greater than.(please reread the first sentence again).
I operate off of the thesis it's an ABC corrective move as that's the conservative analysis and keeps you safe. If this happens to be a 3rd wave of 5 up it will become apparent and one can operate from there.
Note the price action around the 1x1 Gann fan line(black diagonal). I treat this as I would a 50% horizontal S/R line. Above is strength and below is weakness. You can't say it hasn't been an attractor.
For up, I'd expect it has to break and hold or we get more advance while it clings to the line.
On the downside, O/N low here at intraday S level (and Friday hod) 1132.75 so far. Below is psychological 1130 level and former high 1124.5 area marked by extended green horizontal line. Under that is 1115 S/R level and the 23.6 retracement level from 1035 and also the 50% retrace for this wave up from 1081.75. Beneath it all is that gap at 1107.
Hope this helps!
[file]e59897bb o-58b1-4515-af03-c479aceda421[/file]
Click image for original size
hoping we get the pop up first to fade...ideally above 1142.50 and look for trade back to the volume caused by FED announcement......key volume down below is 1127- 28.75!!
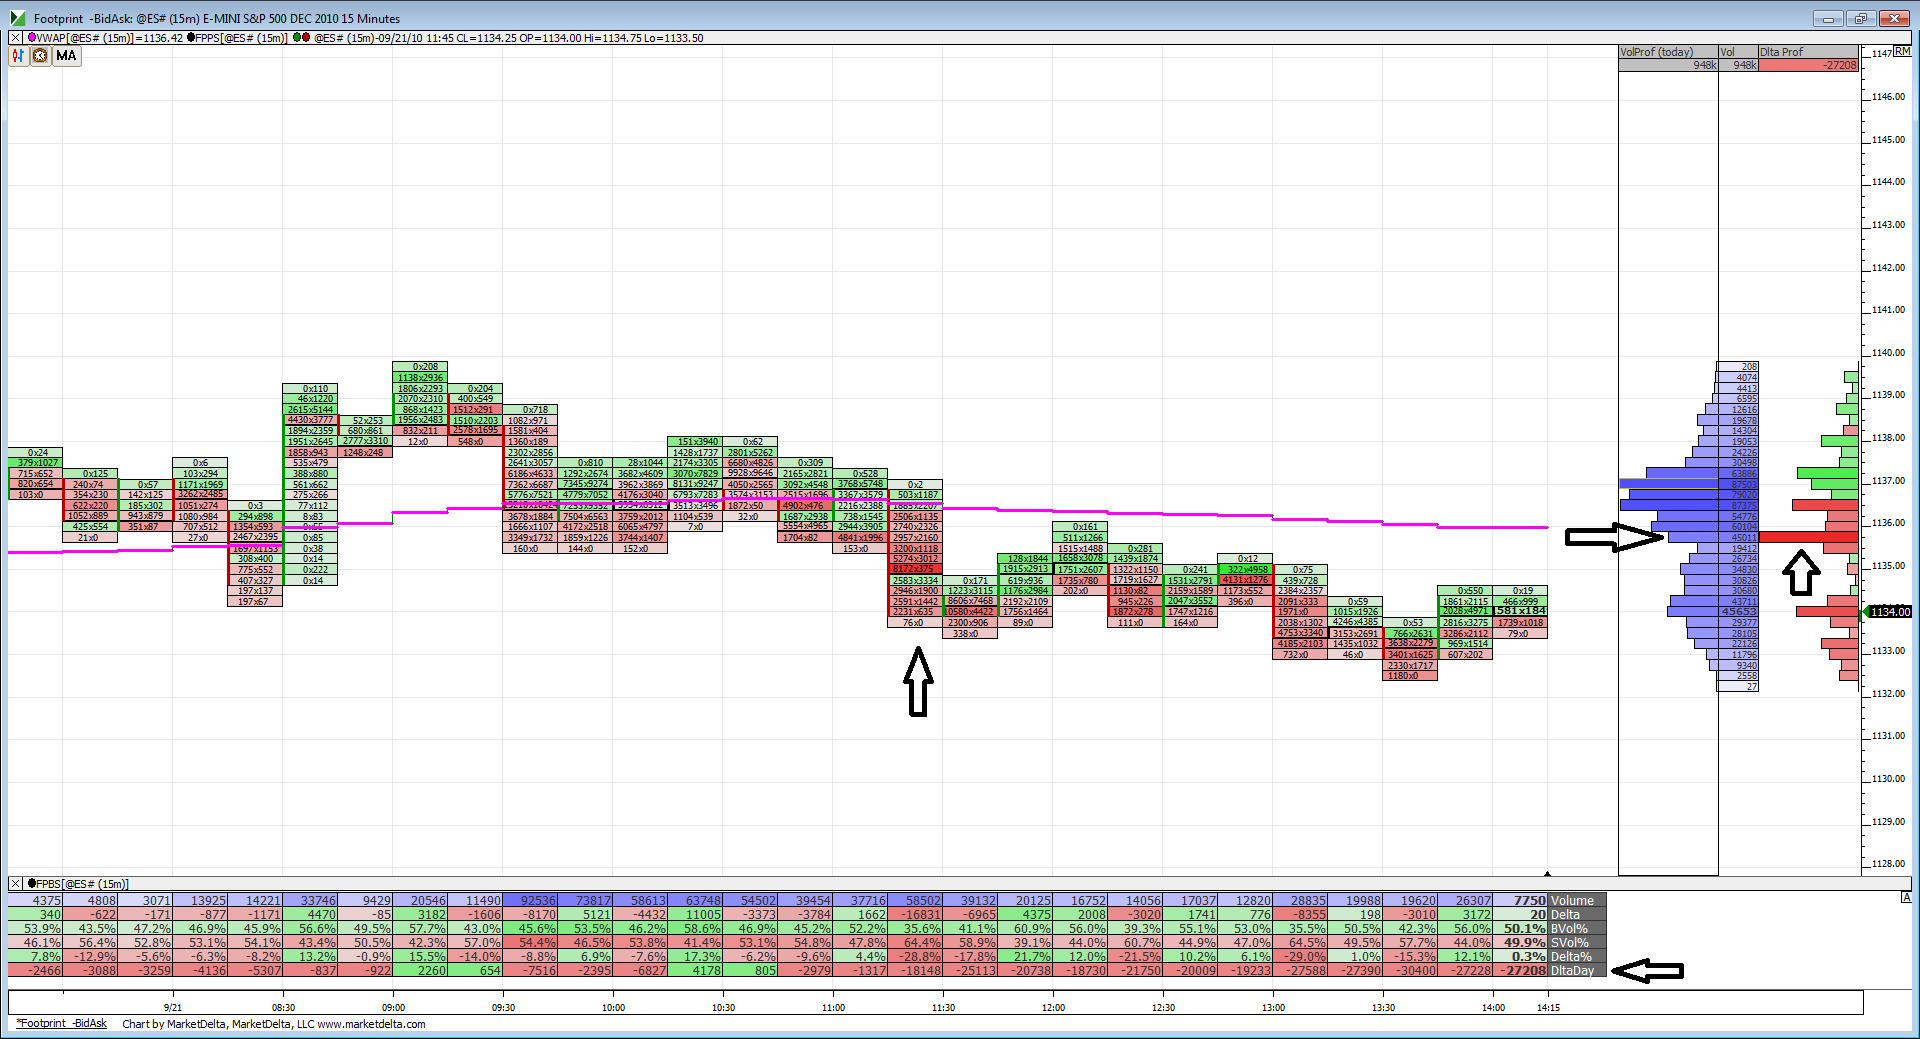
A look at the footprint chart coming into 2:15. Some very interesting things to observe. This is in no way an attempt to predict what prices will do after the announcement, however on a normal day this is a good exercise to go through. I've put some arrows on the chart so you can see what I'm talking about. You can see the typical volume profile of a range day with the bulge in the middle. Something to note is the big red bar in the delta profile (delta difference between ask and bid volume). The bigger the bar and redder the bar the more bid volume. This is showing a selling spike because prices went down here, which means there were sellers placing orders at market to hit the bids.
I've noticed tracking these kinds of areas that they become important support/resistance areas in terms of volume.
I've noticed tracking these kinds of areas that they become important support/resistance areas in terms of volume.
Click image for original size
33.50 is Vol magnet 4 me
I don't have any volume charts to read but I can offer this.
Re remember what I said before about above 3.22 times OR15m, price has accomplished a print past the previous day's High.
now, re the H/L vs Open
afternoon L undercut average by roughly 3 pts, I take those 3 points and subtract from 5 day average of H vs Open which means,
If price gets near 1143.50 (5 day ave of H vs Open minus 3pt from undercut of aver L vs Open after announcement),
then easy money has been made.
it's always a step into the darkness, but price prints 43 handle, it gets darker...
on the 43.50's..ledge and air below..we don't want volume above 45 to come in or else trade will fail
41.50 was the air and will be critical going forward for runners to overtake and shorts crush them
for me it was 2.5 point penetration of PDH...they love to run it out 2.5 - 5 points above/below PDH and PDL....so find the fade in between with air below.....
best for me is 38.75....trade back up now will take last two runners..otherwise 35.5 will be next
nt too thrilled when things get obvious ..like this 5 minute head and shoulder top forming......just too classic....they may run it up from here...hope not
flat on final at 33.75...that's where the move began and the volume....
Man, how I love trading..........SOMETIMES!!!
Man, how I love trading..........SOMETIMES!!!
Emini Day Trading /
Daily Notes /
Forecast /
Economic Events /
Search /
Terms and Conditions /
Disclaimer /
Books /
Online Books /
Site Map /
Contact /
Privacy Policy /
Links /
About /
Day Trading Forum /
Investment Calculators /
Pivot Point Calculator /
Market Profile Generator /
Fibonacci Calculator /
Mailing List /
Advertise Here /
Articles /
Financial Terms /
Brokers /
Software /
Holidays /
Stock Split Calendar /
Mortgage Calculator /
Donate
Copyright © 2004-2023, MyPivots. All rights reserved.
Copyright © 2004-2023, MyPivots. All rights reserved.