ES Short Term Trading 9-21-10
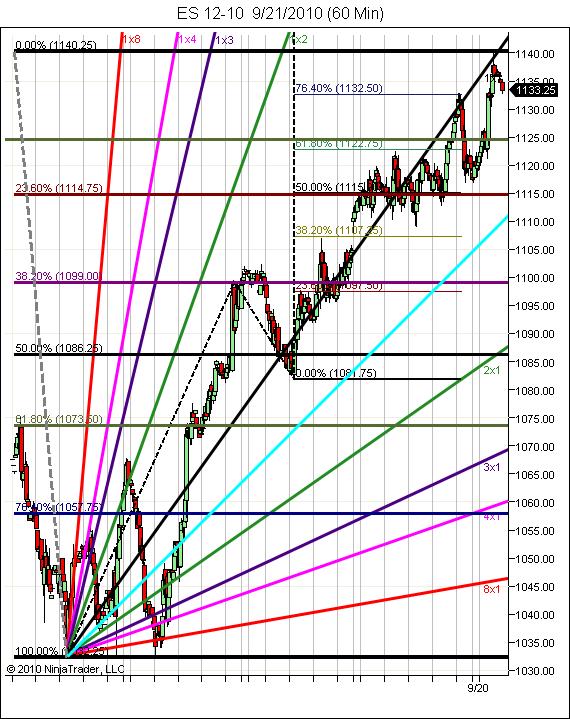
1137 hit and exceeded.It was the minimum target for a wave C up from 1035 and nothing more than 1137 is required of EW rules if indeed a C wave. However, an equal move for a C wave would equal an 1160 target.If that comes to pass, C waves can be larger than A waves and usually are equal to or greater than.(please reread the first sentence again).
I operate off of the thesis it's an ABC corrective move as that's the conservative analysis and keeps you safe. If this happens to be a 3rd wave of 5 up it will become apparent and one can operate from there.
Note the price action around the 1x1 Gann fan line(black diagonal). I treat this as I would a 50% horizontal S/R line. Above is strength and below is weakness. You can't say it hasn't been an attractor.
For up, I'd expect it has to break and hold or we get more advance while it clings to the line.
On the downside, O/N low here at intraday S level (and Friday hod) 1132.75 so far. Below is psychological 1130 level and former high 1124.5 area marked by extended green horizontal line. Under that is 1115 S/R level and the 23.6 retracement level from 1035 and also the 50% retrace for this wave up from 1081.75. Beneath it all is that gap at 1107.
Hope this helps!
[file]e59897bb o-58b1-4515-af03-c479aceda421[/file]
Click image for original size
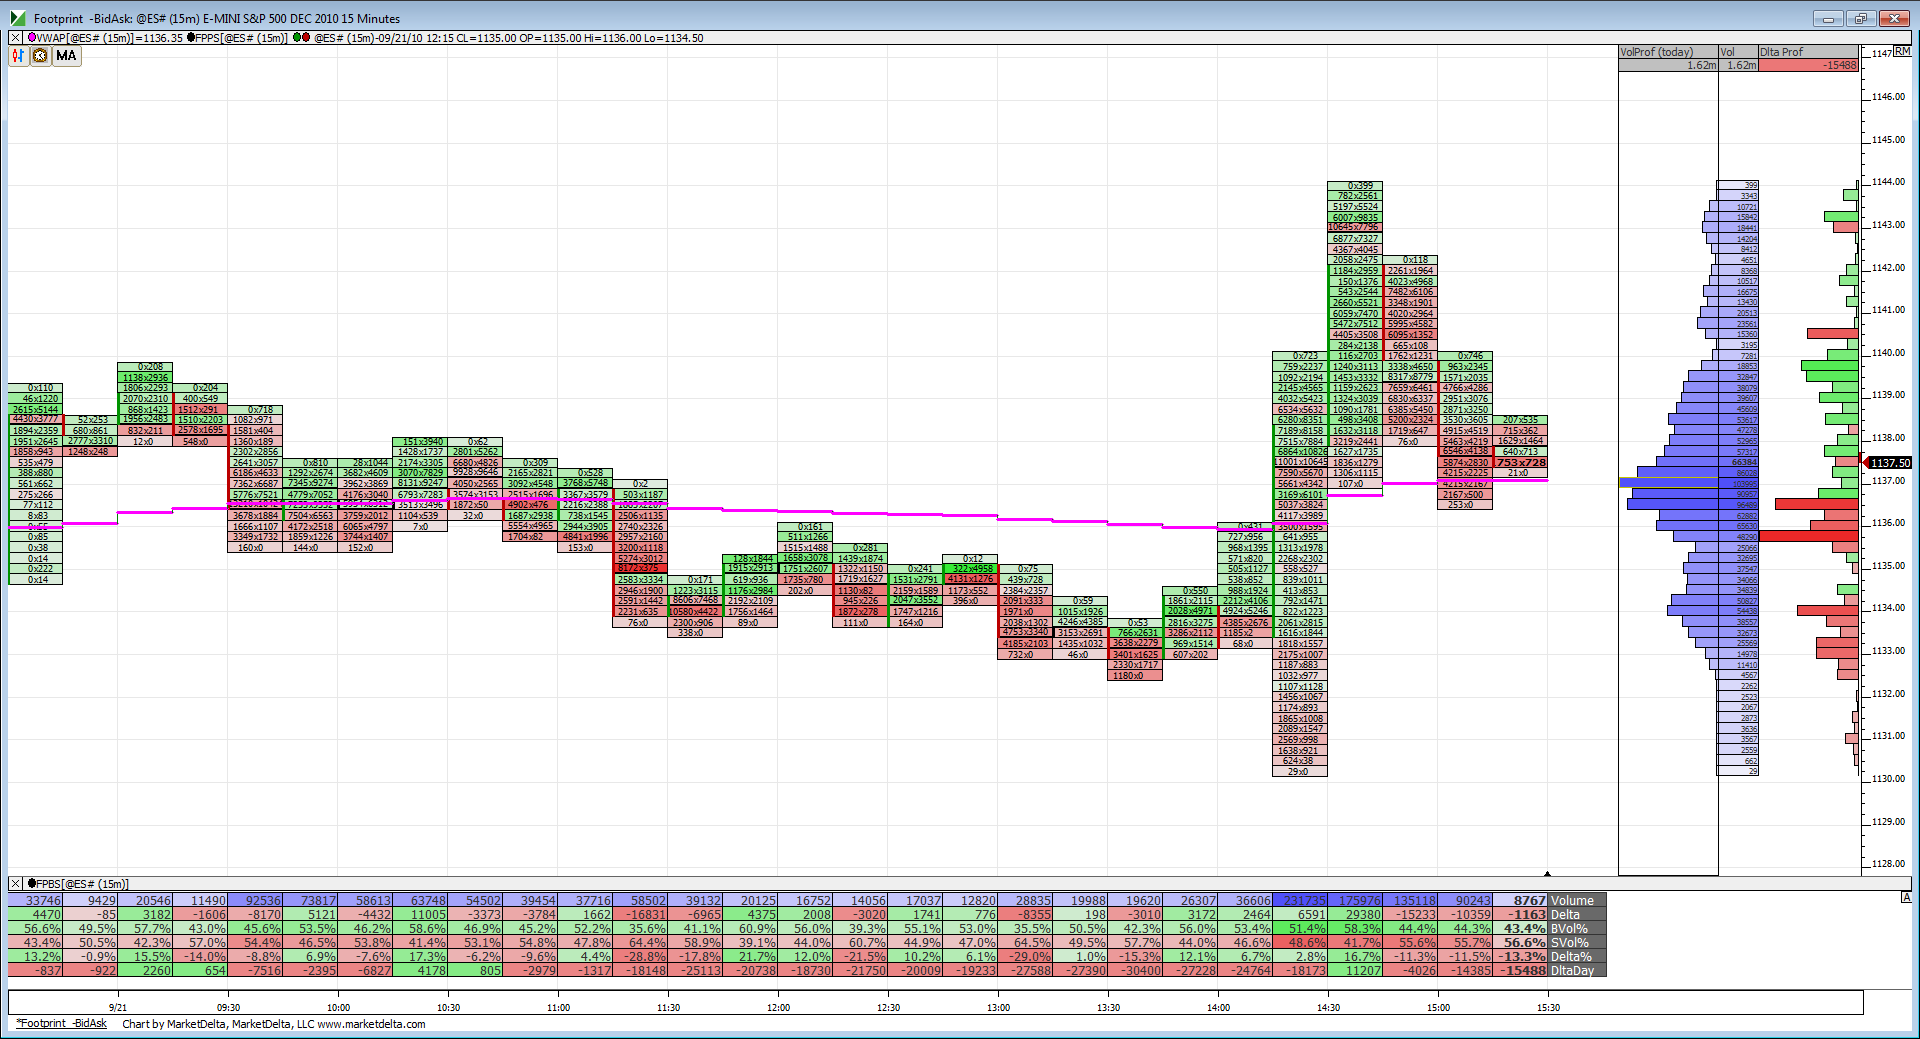
Until we get a solid close under VWAP chances of rallying back up are high imo.
Originally posted by BruceM
nt too thrilled when things get obvious ..like this 5 minute head and shoulder top forming......just too classic....they may run it up from here...hope not
the only saving grace is that IF the 30 minute grail trader DOnot buy now then we could have a good waterfall decline
I think Paul put it nicely.
*The easy money has been made*
*The easy money has been made*
A look at the action since the announcement. Interesting that the volume profile still looks like the bulging range day style, just elongated.
Click image for original size
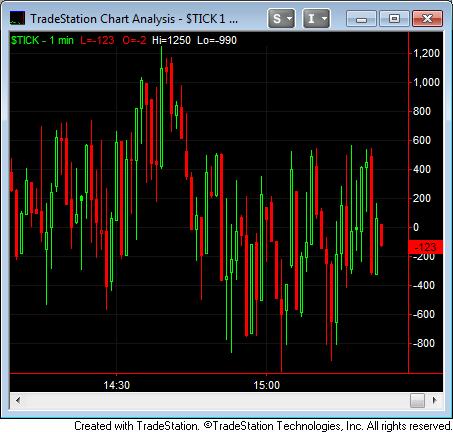
Watching TICK readings. Since the extreme of +1250 at the 1144 ES high there is an obvious overhead ledge of resistance on the TICK at +600. This is Tradestation data so I know my readings will be different from others.
Click image for original size
flat on final at 33.75...that's where the move began and the volume....
Man, how I love trading..........SOMETIMES!!!
Man, how I love trading..........SOMETIMES!!!
Emini Day Trading /
Daily Notes /
Forecast /
Economic Events /
Search /
Terms and Conditions /
Disclaimer /
Books /
Online Books /
Site Map /
Contact /
Privacy Policy /
Links /
About /
Day Trading Forum /
Investment Calculators /
Pivot Point Calculator /
Market Profile Generator /
Fibonacci Calculator /
Mailing List /
Advertise Here /
Articles /
Financial Terms /
Brokers /
Software /
Holidays /
Stock Split Calendar /
Mortgage Calculator /
Donate
Copyright © 2004-2023, MyPivots. All rights reserved.
Copyright © 2004-2023, MyPivots. All rights reserved.