MyPivots
Sign In
JA
jarek
Rep: 94
Posts: 3,474
The question is: was this already it, 1 day and 9 points away from our perfect 'symmetrical' target or yet it needs to reach the 1.000 ABCD regardless of the time factor:


Click image for original size
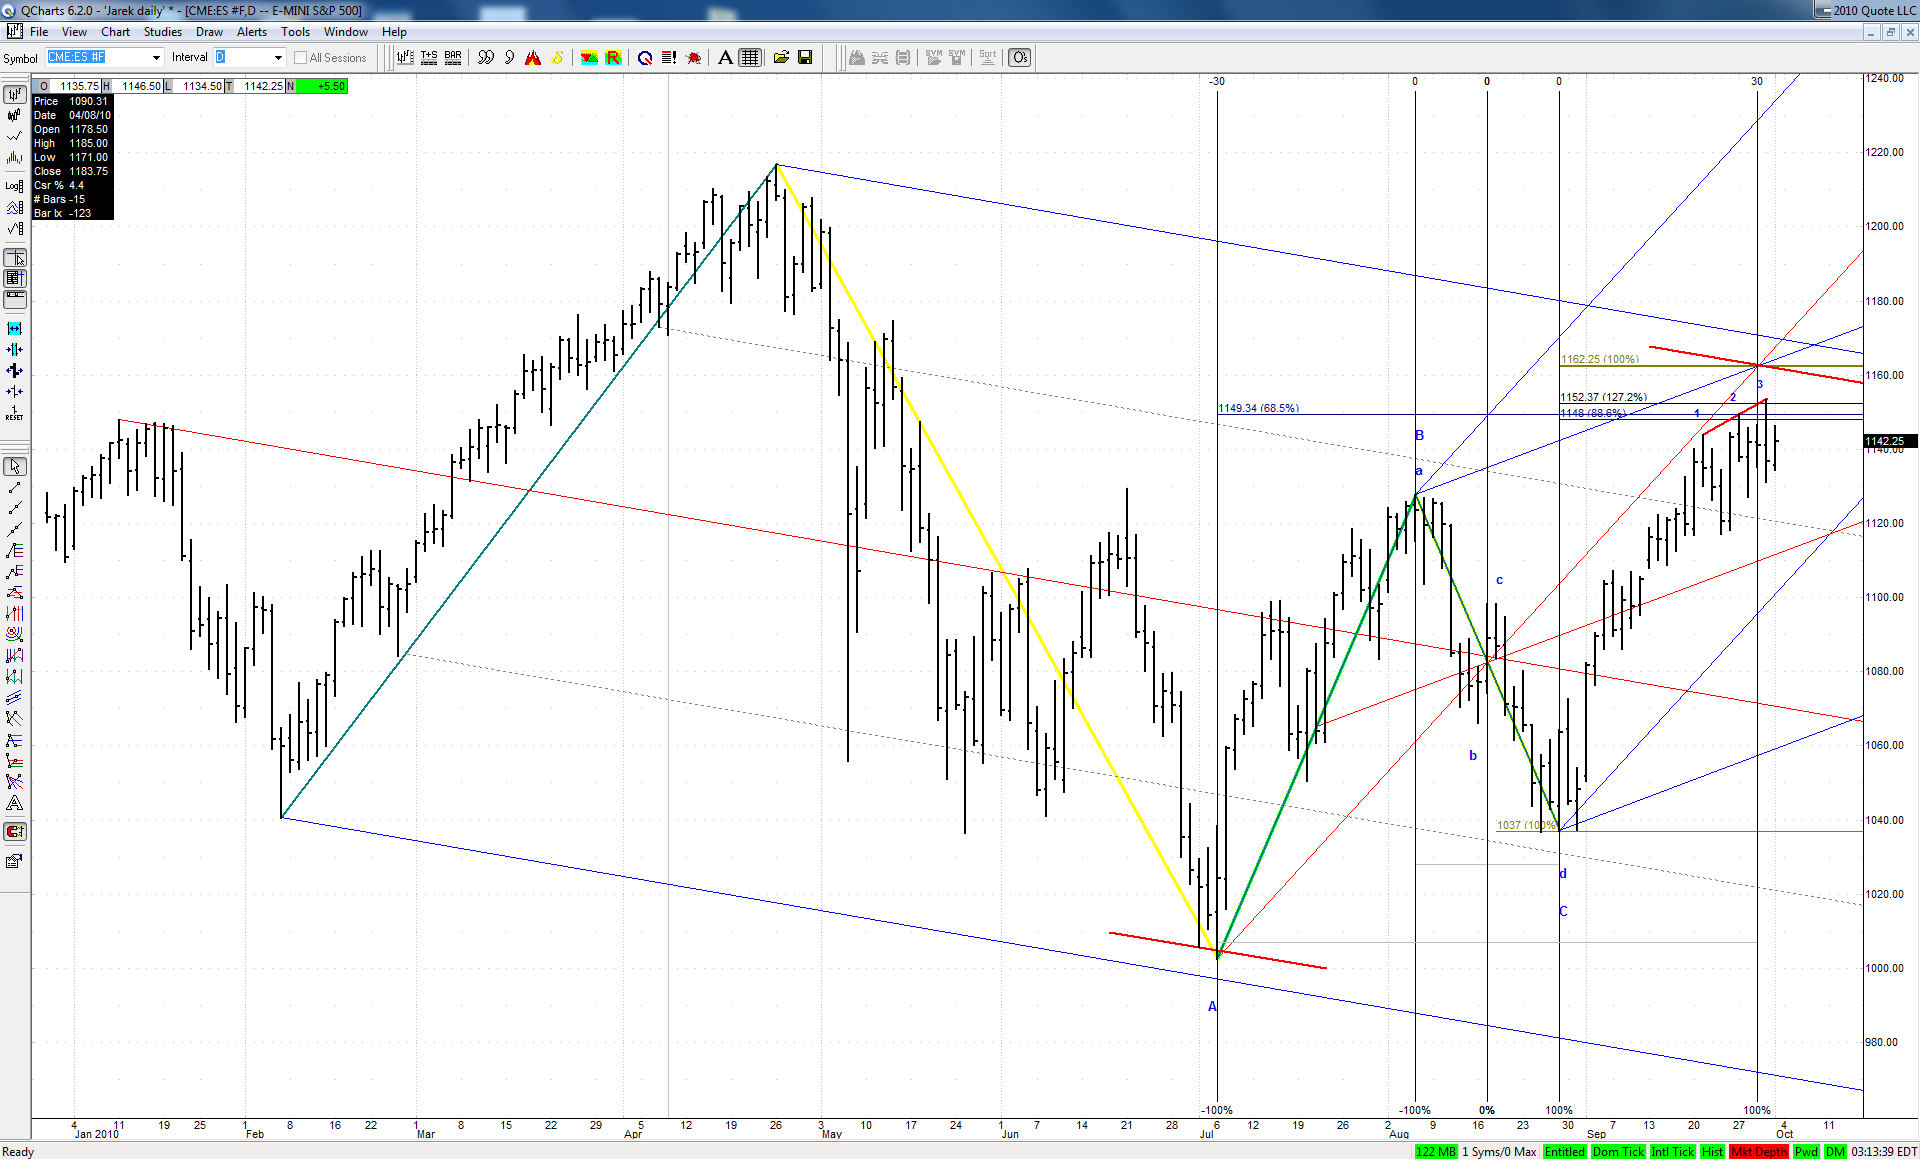


This 3D at spike line might suggest the former, but if it breaks to the upside it might break the whole ABCD as well and go up, up and away as per Jim's scenario
JI
jimkane
Rep: 3,058
Posts: 33,089
Well, I can't wait for the open, to see what they do in GLOBEX. It does have an ending look to it, but lately the reversal formations have been complex, with lots of sideways action, so this entire week may be spent at this area, hacking and chopping, if it is go down (and maybe even if it is to break upwards...). I'm really looking forward to the action, either way.
RO
roofer
Rep: 3,689
Posts: 3,574
time to decide
Click image for original size
JA
jarek
Rep: 94
Posts: 3,474
Originally posted by roofer

time to decide
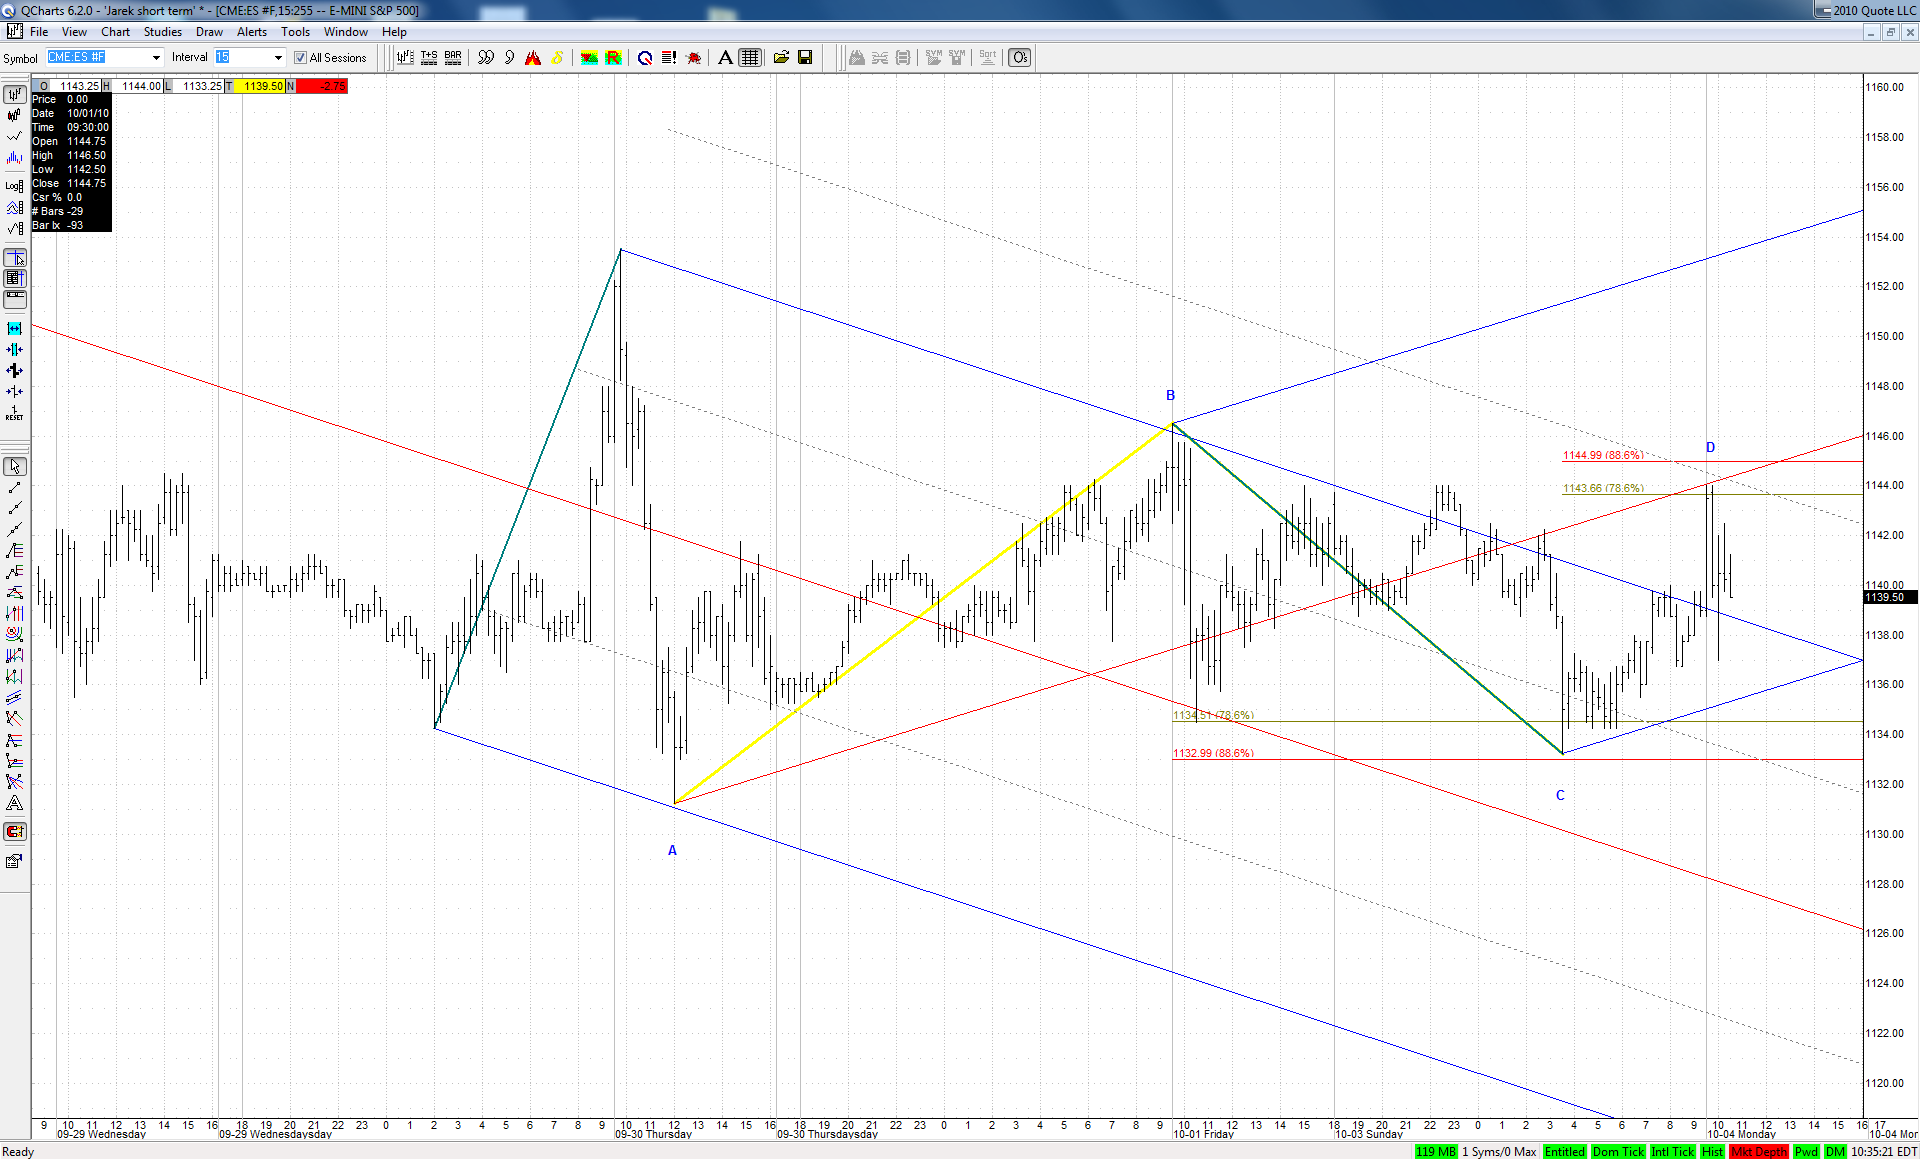

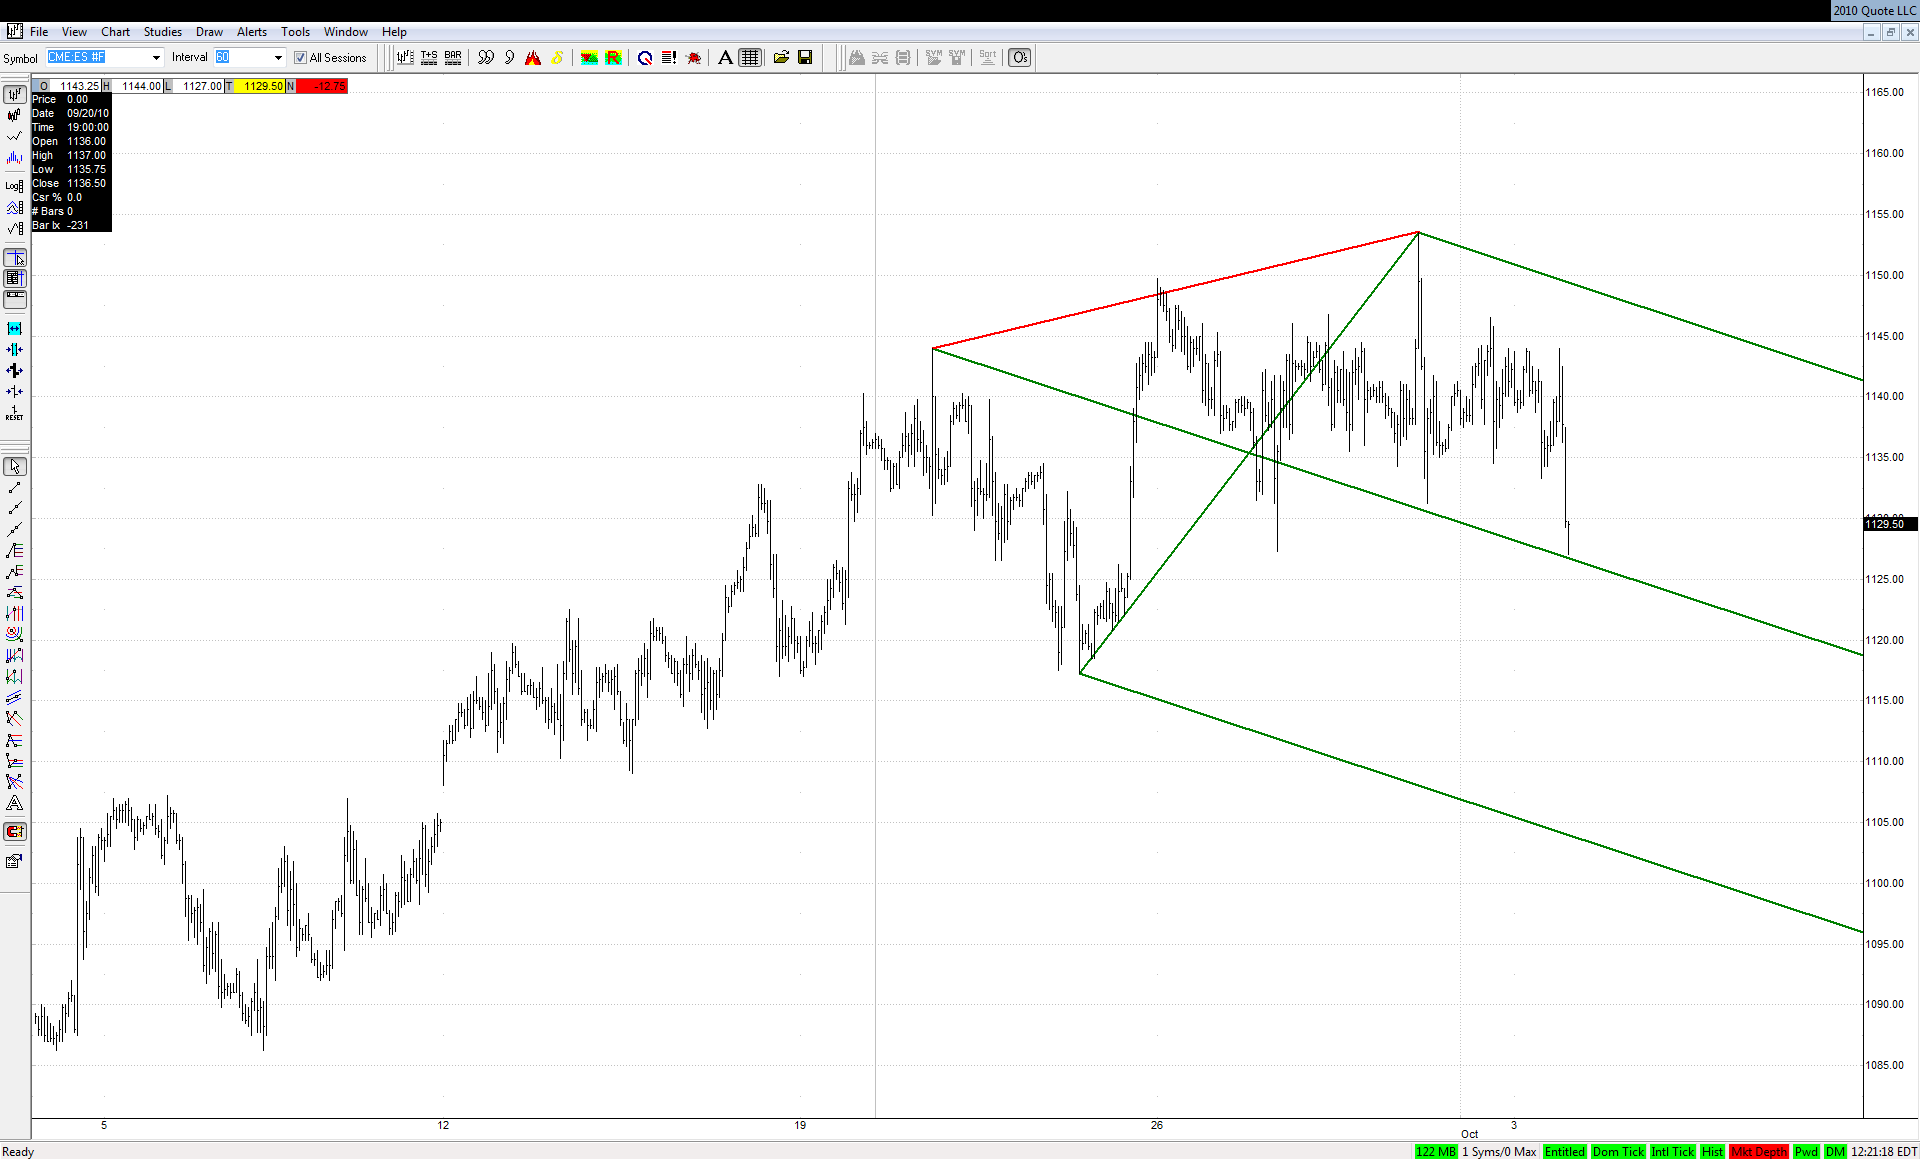
Agreed - recent action in ES could be viewed as looong 4PT correcting the first push down:


Click image for original size


To confirm this it needs to accelerate strongly to the downside
JA
jarek
Rep: 94
Posts: 3,474
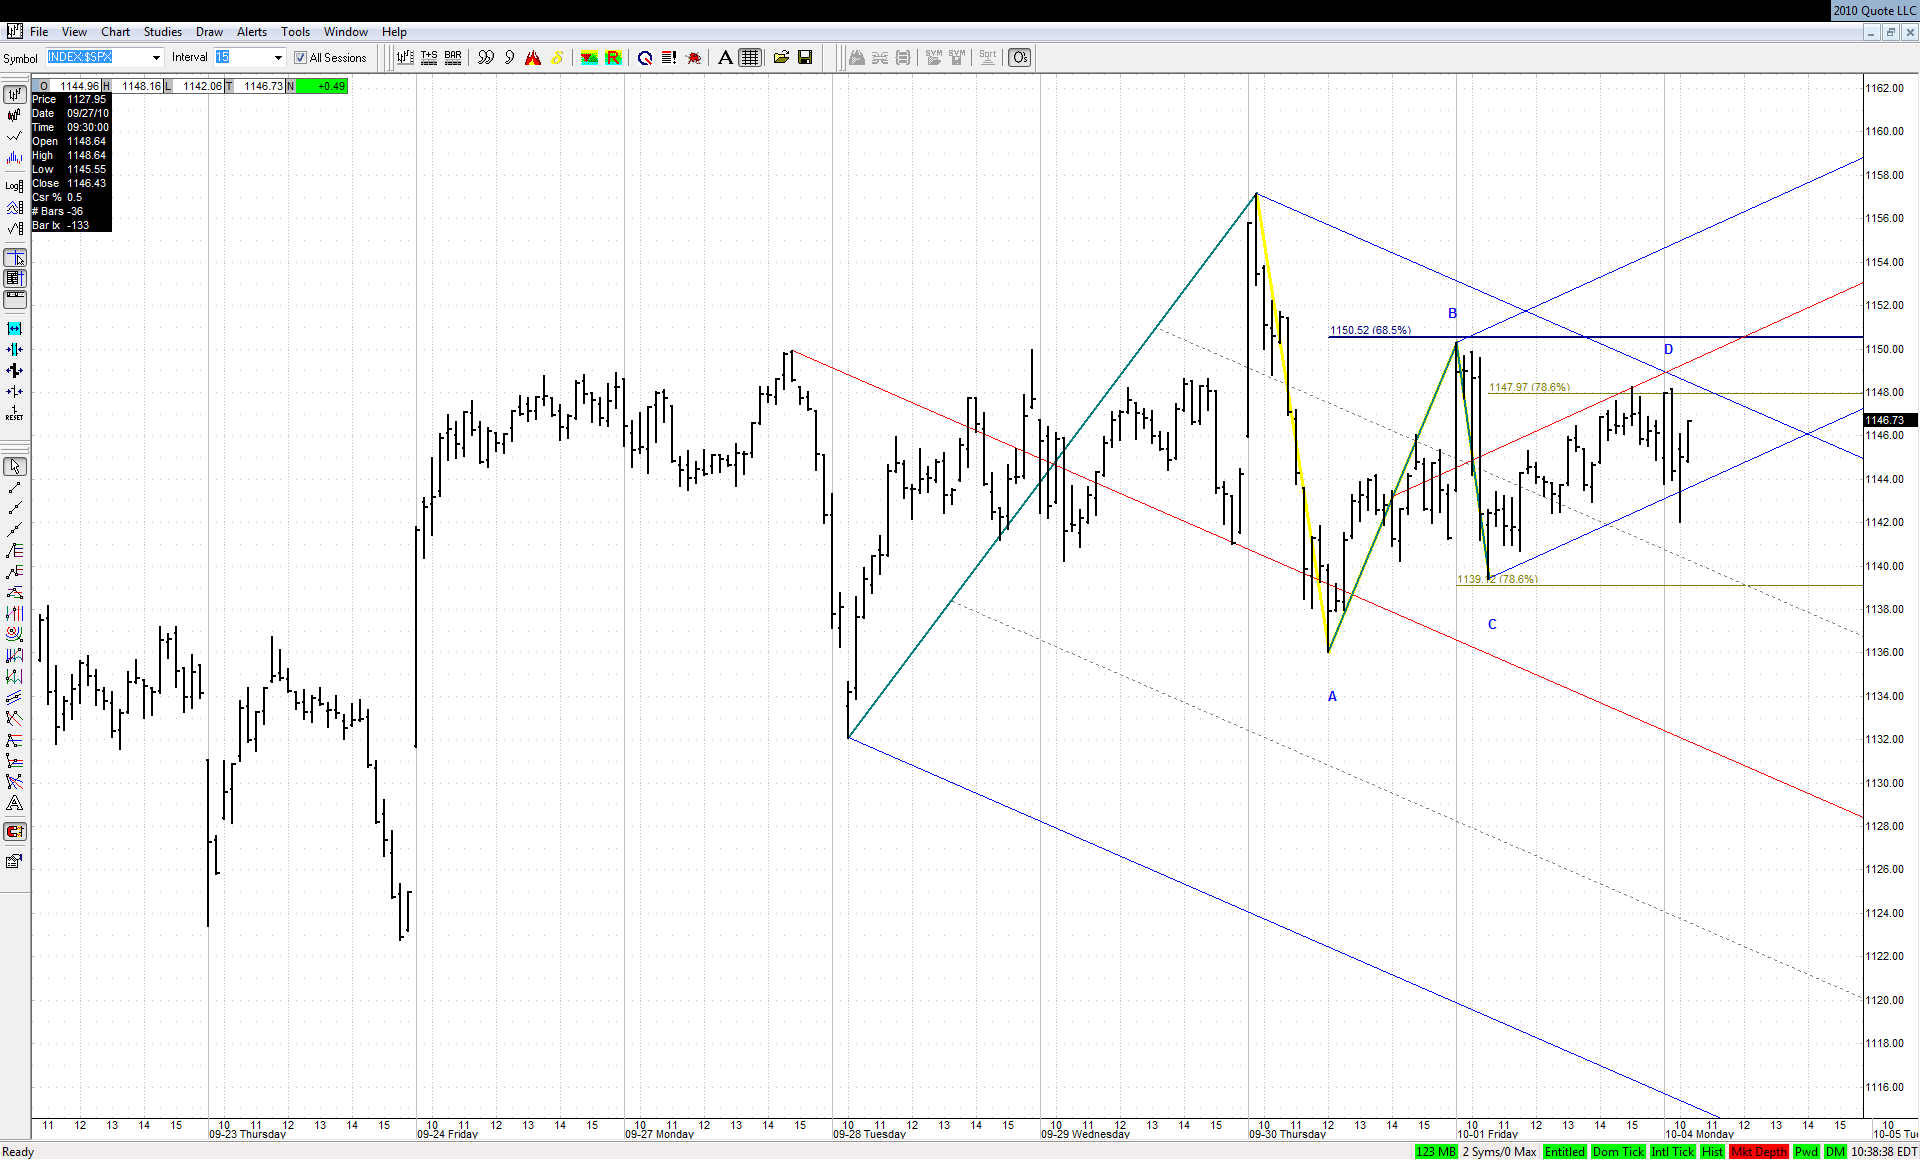
This bearish 4PT looks much better in SPX:


Click image for original size
JA
jarek
Rep: 94
Posts: 3,474
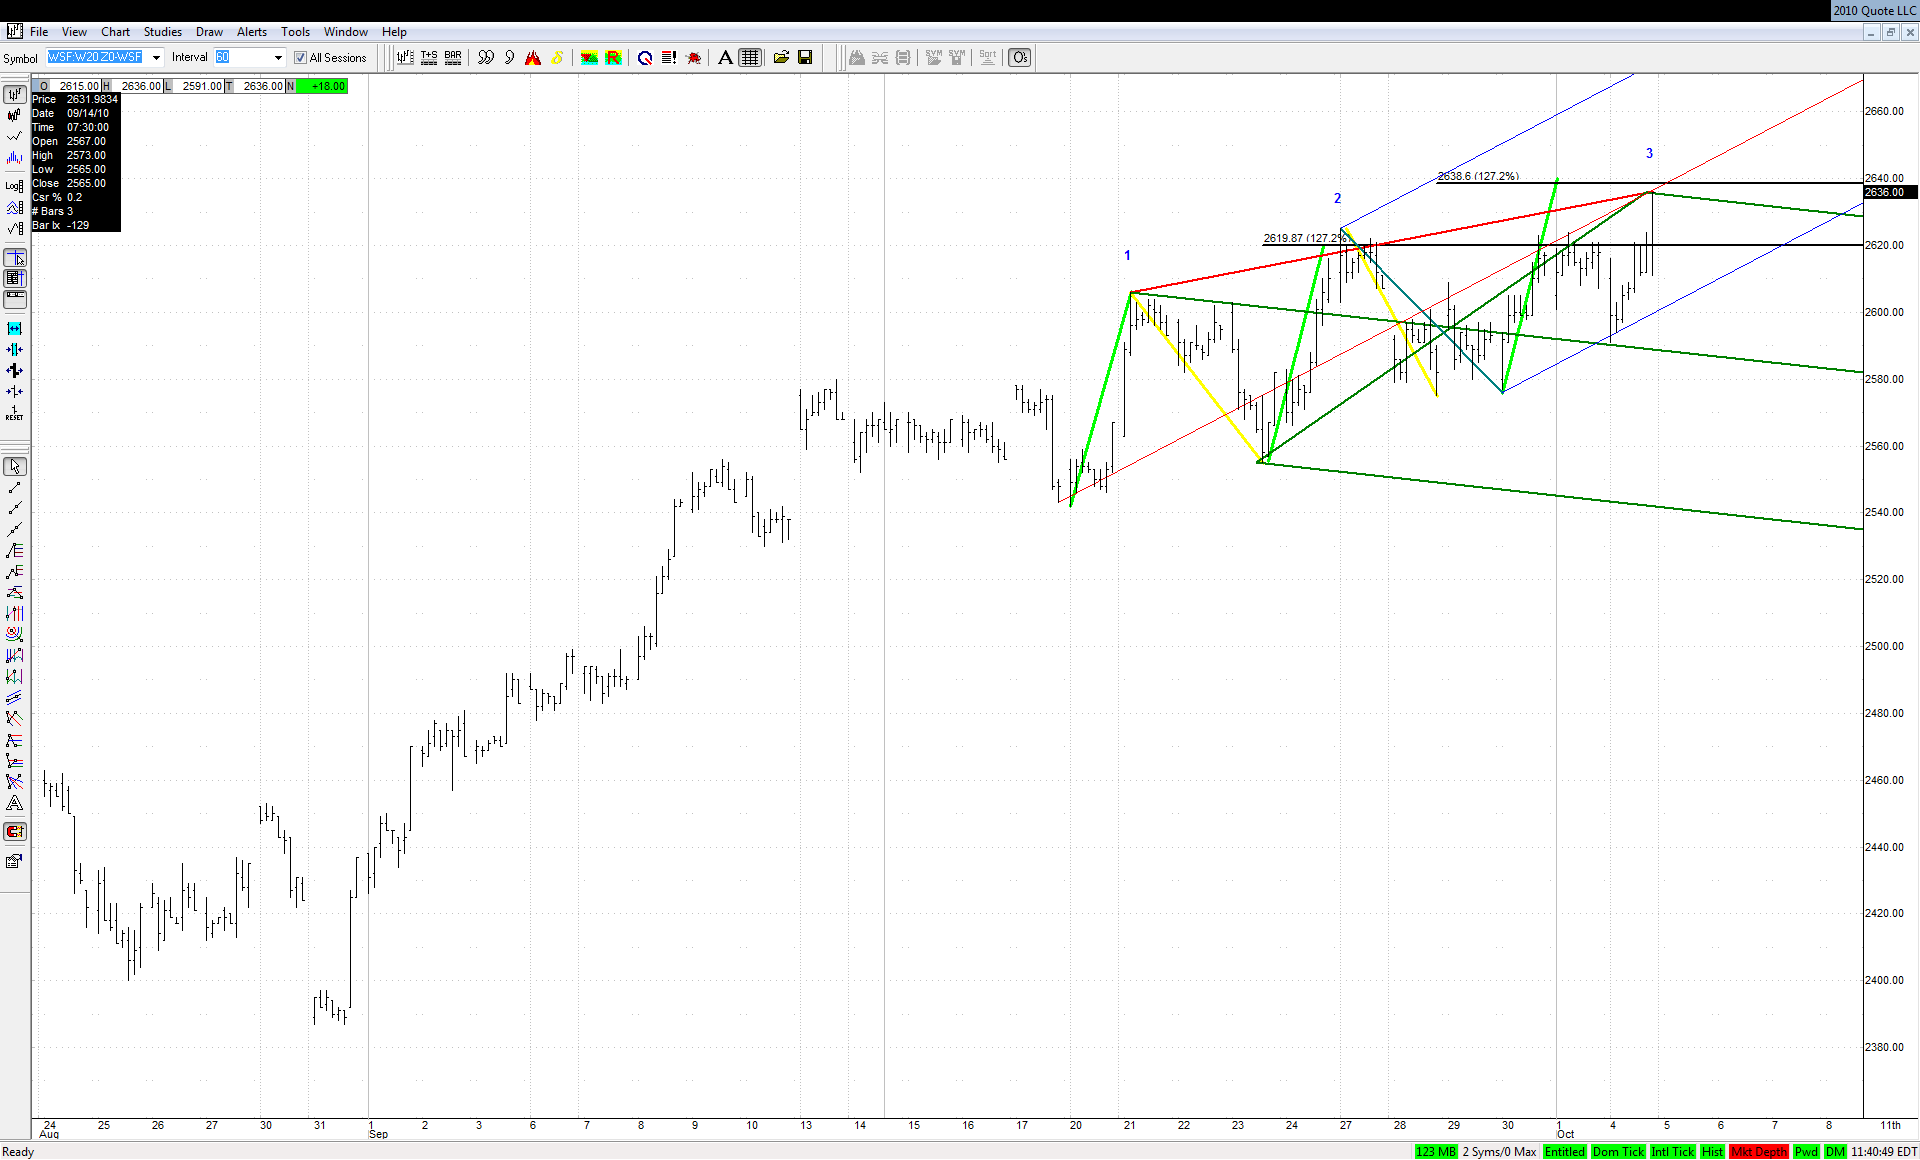
So we have downside acceleration. I kind of expected that after today's action at Warsaw Stock Exchange. We were one on the strongest markets in Europe, accelerating strongly into the close in spite of other markets falling at the same time:


Click image for original size


How else could one describe this behaviour than "rush to the dance floor" to satisfy the geometry?
JA
jarek
Rep: 94
Posts: 3,474
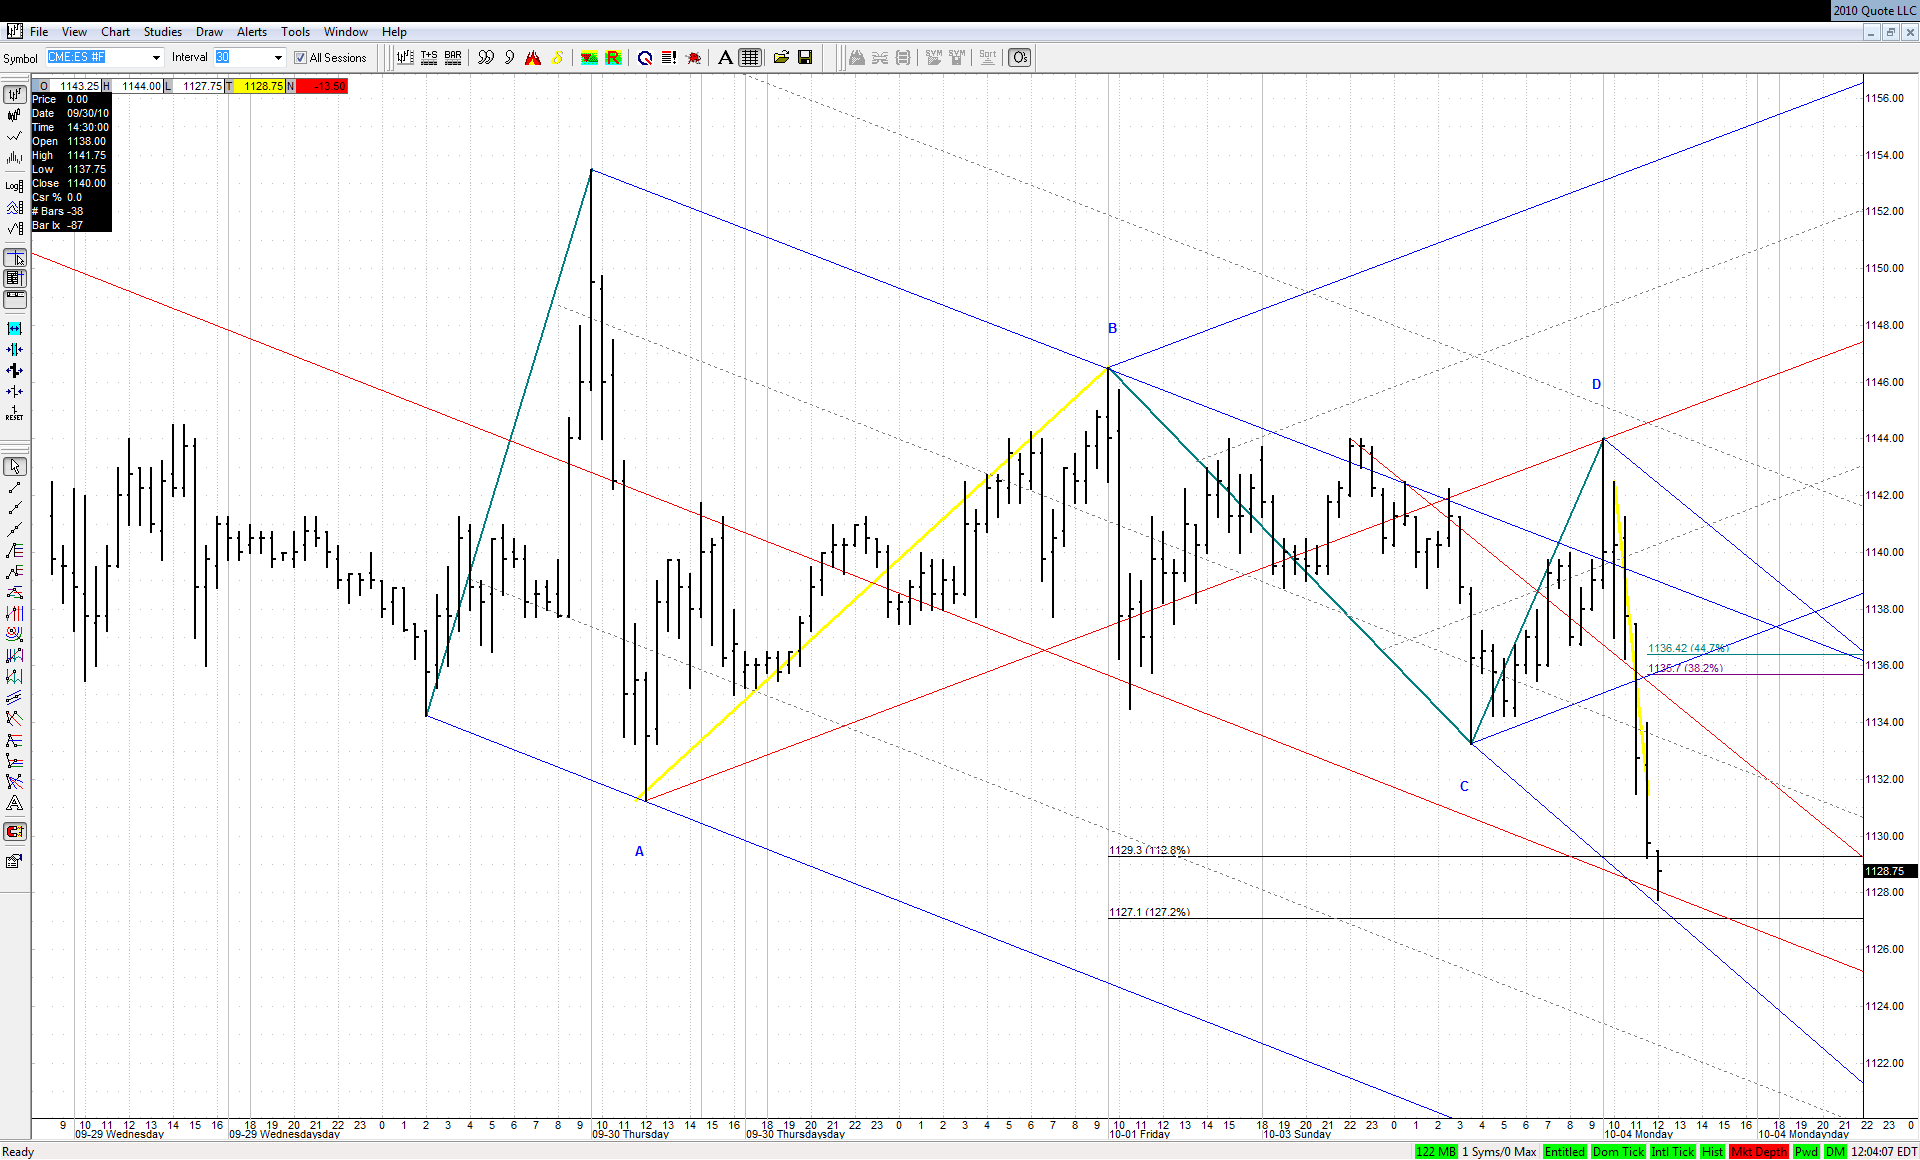
Important lines intersection was reached at LOD:


Click image for original size


If it breaks this 1.272 then it should really accelerate to the downside in W3 kind of move
JA
jarek
Rep: 94
Posts: 3,474
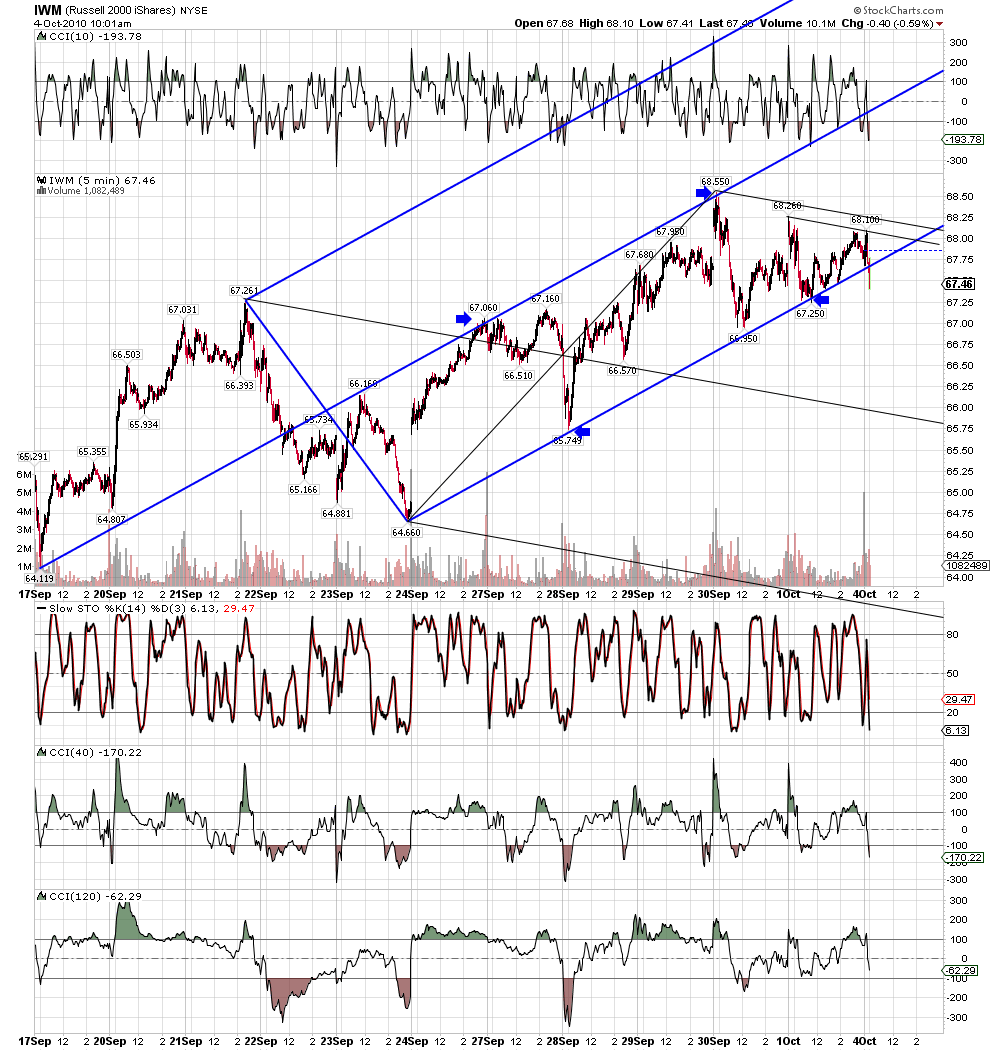
It is also interesting to note that green set's ML from the spike line on daily chart above was reached at LOD almost to the tick:


Click image for original size
JI
jimkane
Rep: 3,058
Posts: 33,089
Originally posted by jarek

It is also interesting to note that green set's ML from the spike line on daily chart above was reached at LOD almost to the tick:


Click image for original size


And you know what that might mean...
JI
jimkane
Rep: 3,058
Posts: 33,089
Wow, that's some great work, jarek. I'm going to have to start coming in here before the open. Since there is so few participants, maybe I can do that and still pay attention to the market, since essentially no one will be asking me questions. Maybe I'll try that here and there...
JA
jarek
Rep: 94
Posts: 3,474
Originally posted by jimkane

...I'm going to have to start coming in here before the open...


That would me more than welcomed!
JI
jimkane
Rep: 3,058
Posts: 33,089
Too frickin' funny


Originally posted by jarek

Yep - very interesting finish to what looked like yet another day from "Reminiscences of a Grilled Bear"