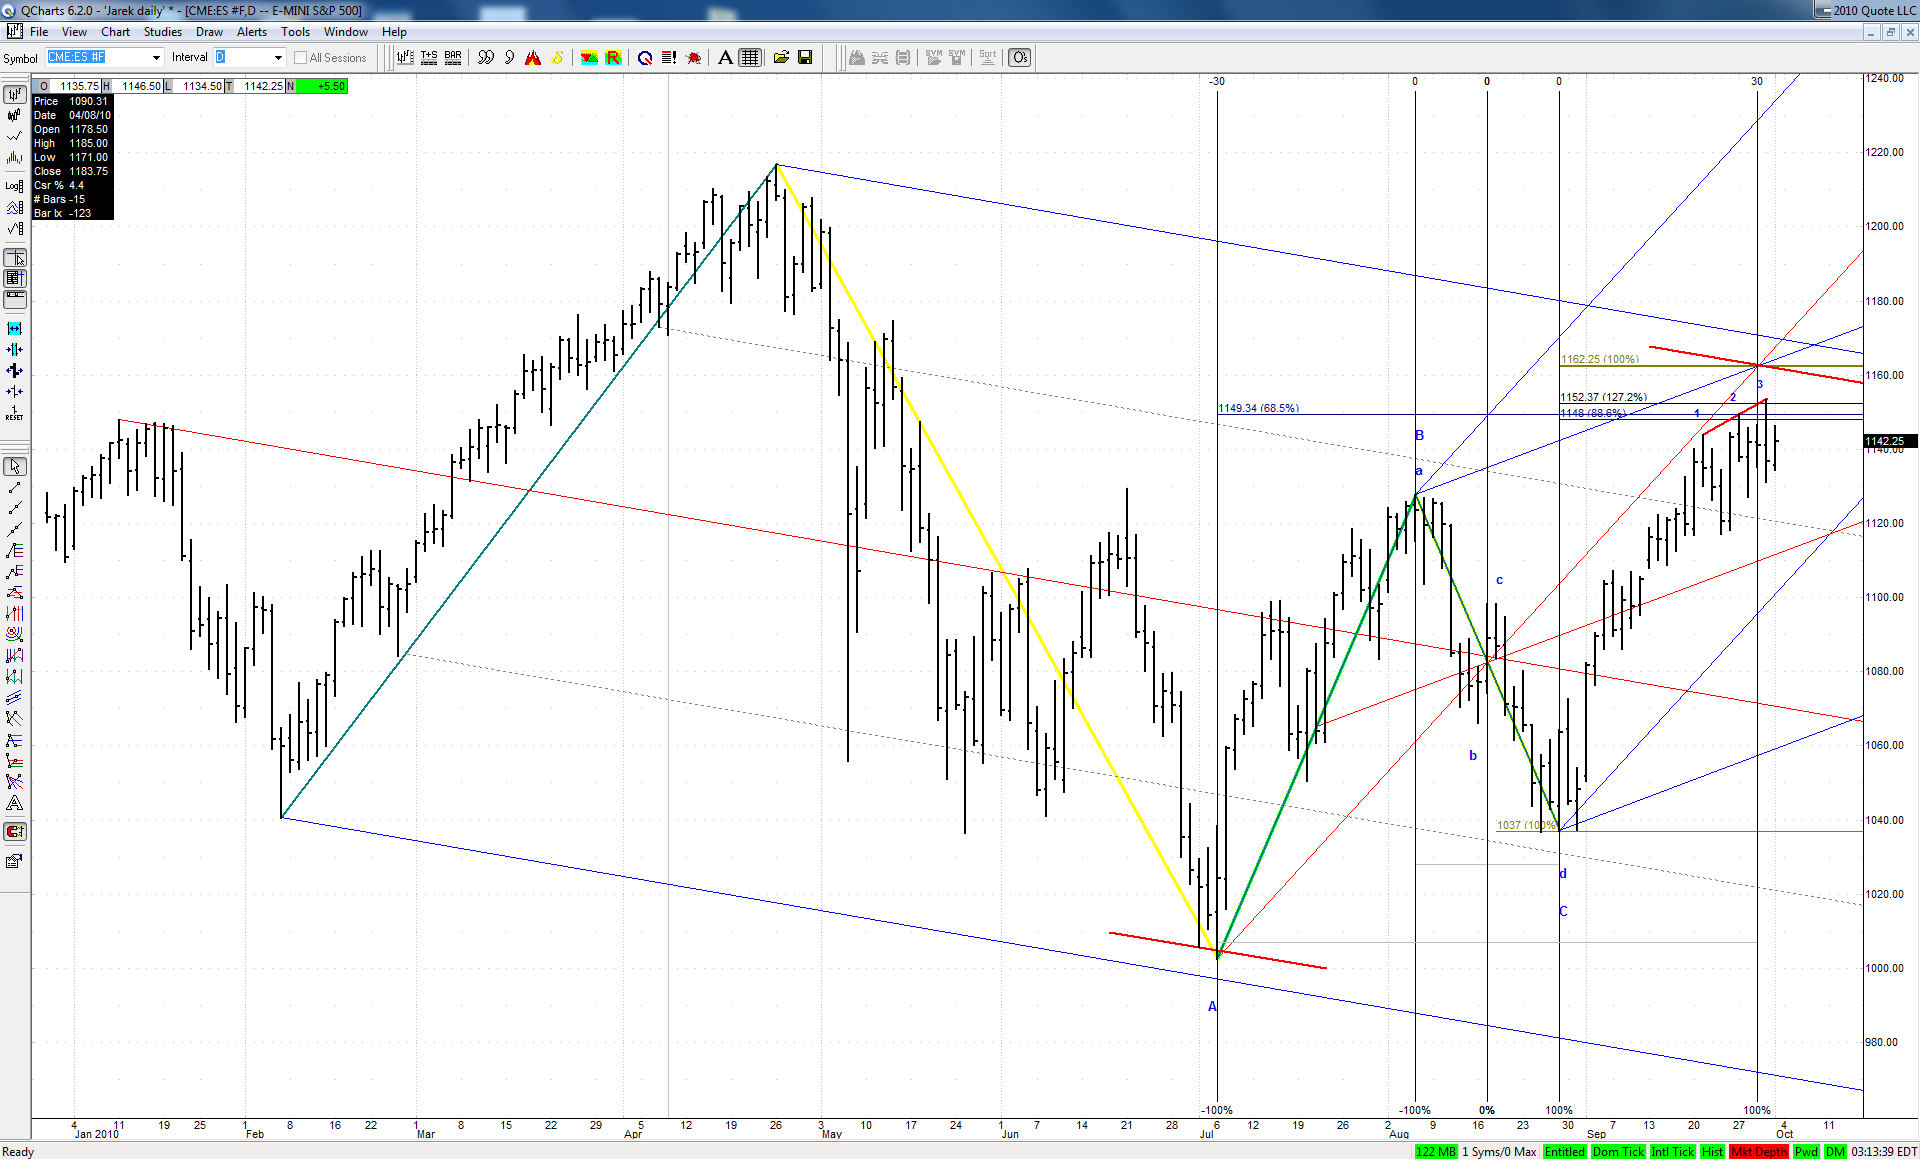
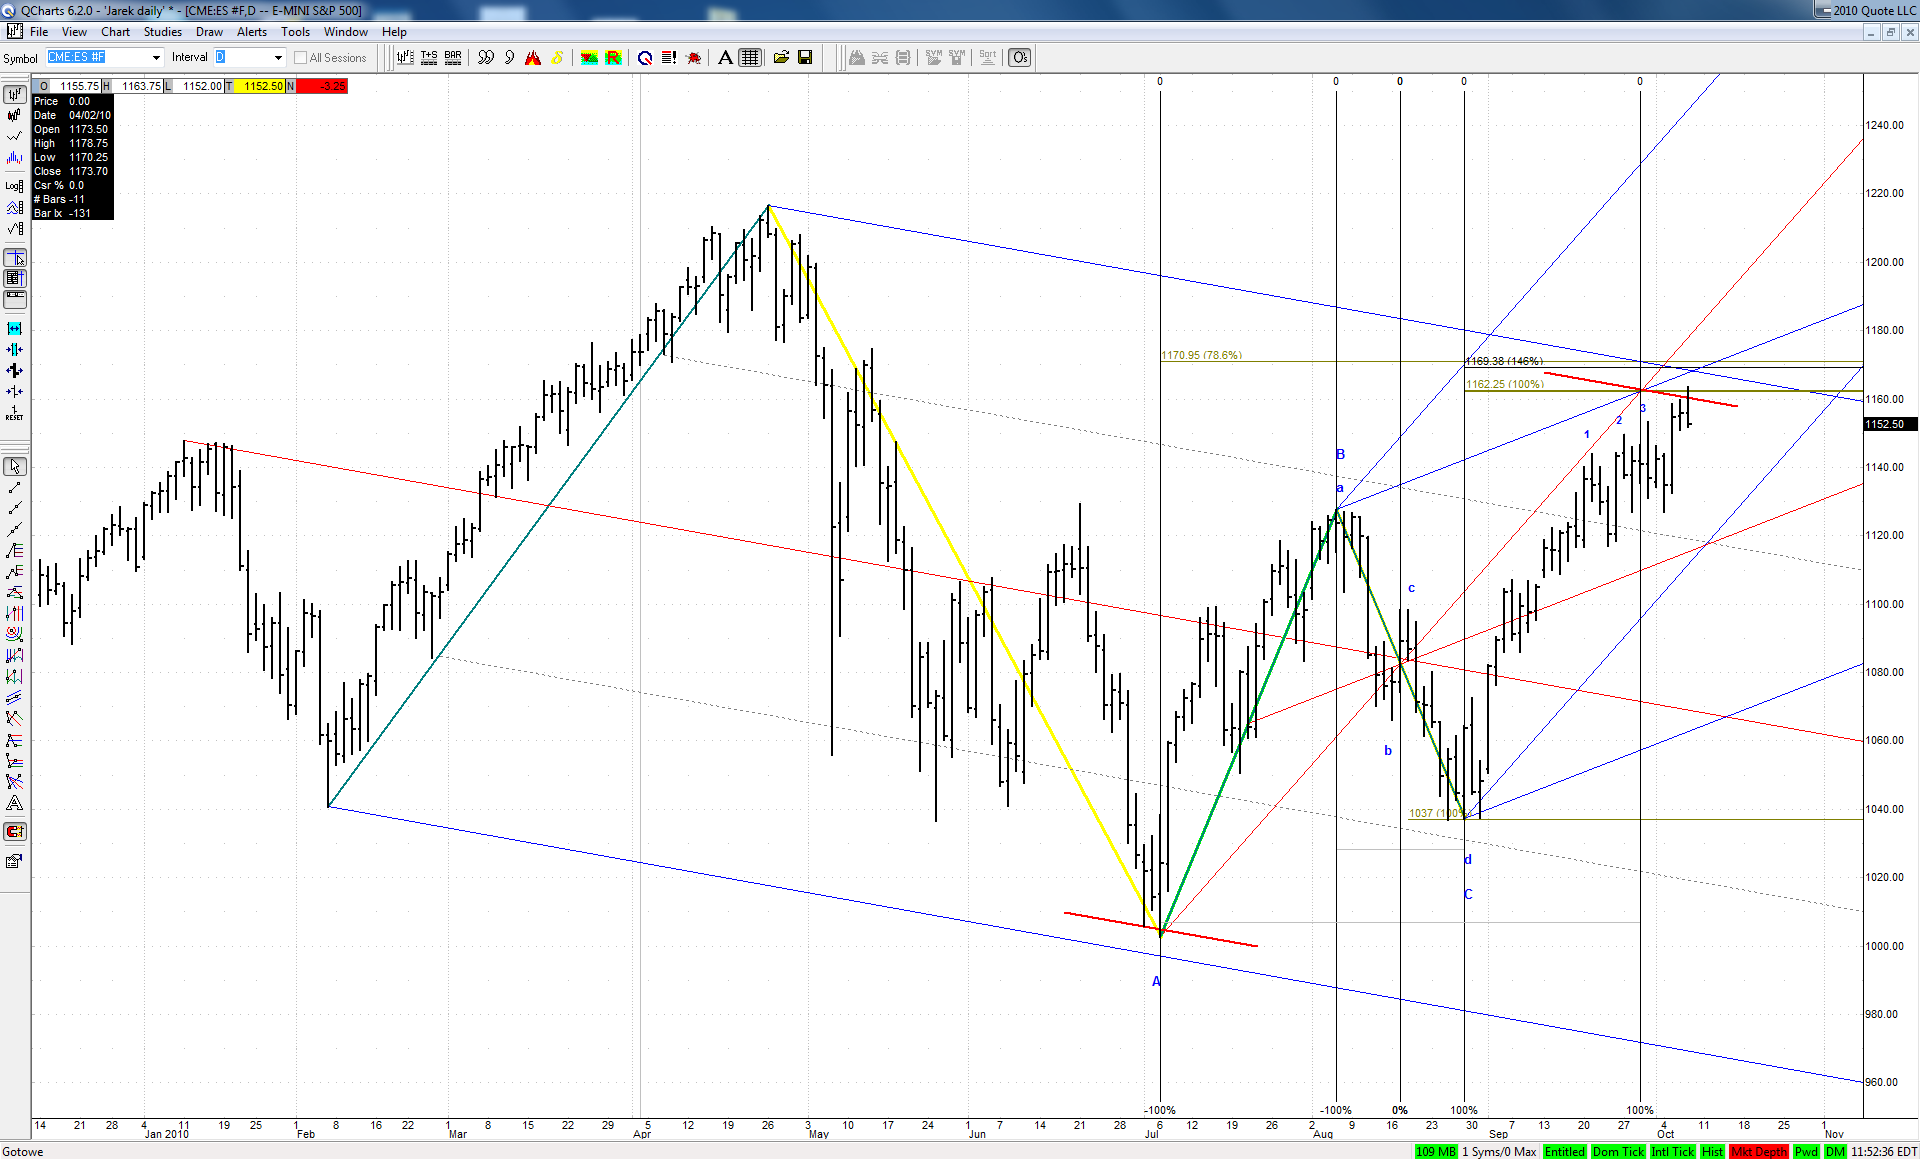
The question is: was this already it, 1 day and 9 points away from our perfect 'symmetrical' target or yet it needs to reach the 1.000 ABCD regardless of the time factor:
This 3D at spike line might suggest the former, but if it breaks to the upside it might break the whole ABCD as well and go up, up and away as per Jim's scenario
JI
jimkane
Rep: 3,058
Posts: 33,089
Originally posted by jimkane
It's a grind, but I think the odds are better the bigger pattern plays out a bit, and they go up from here.
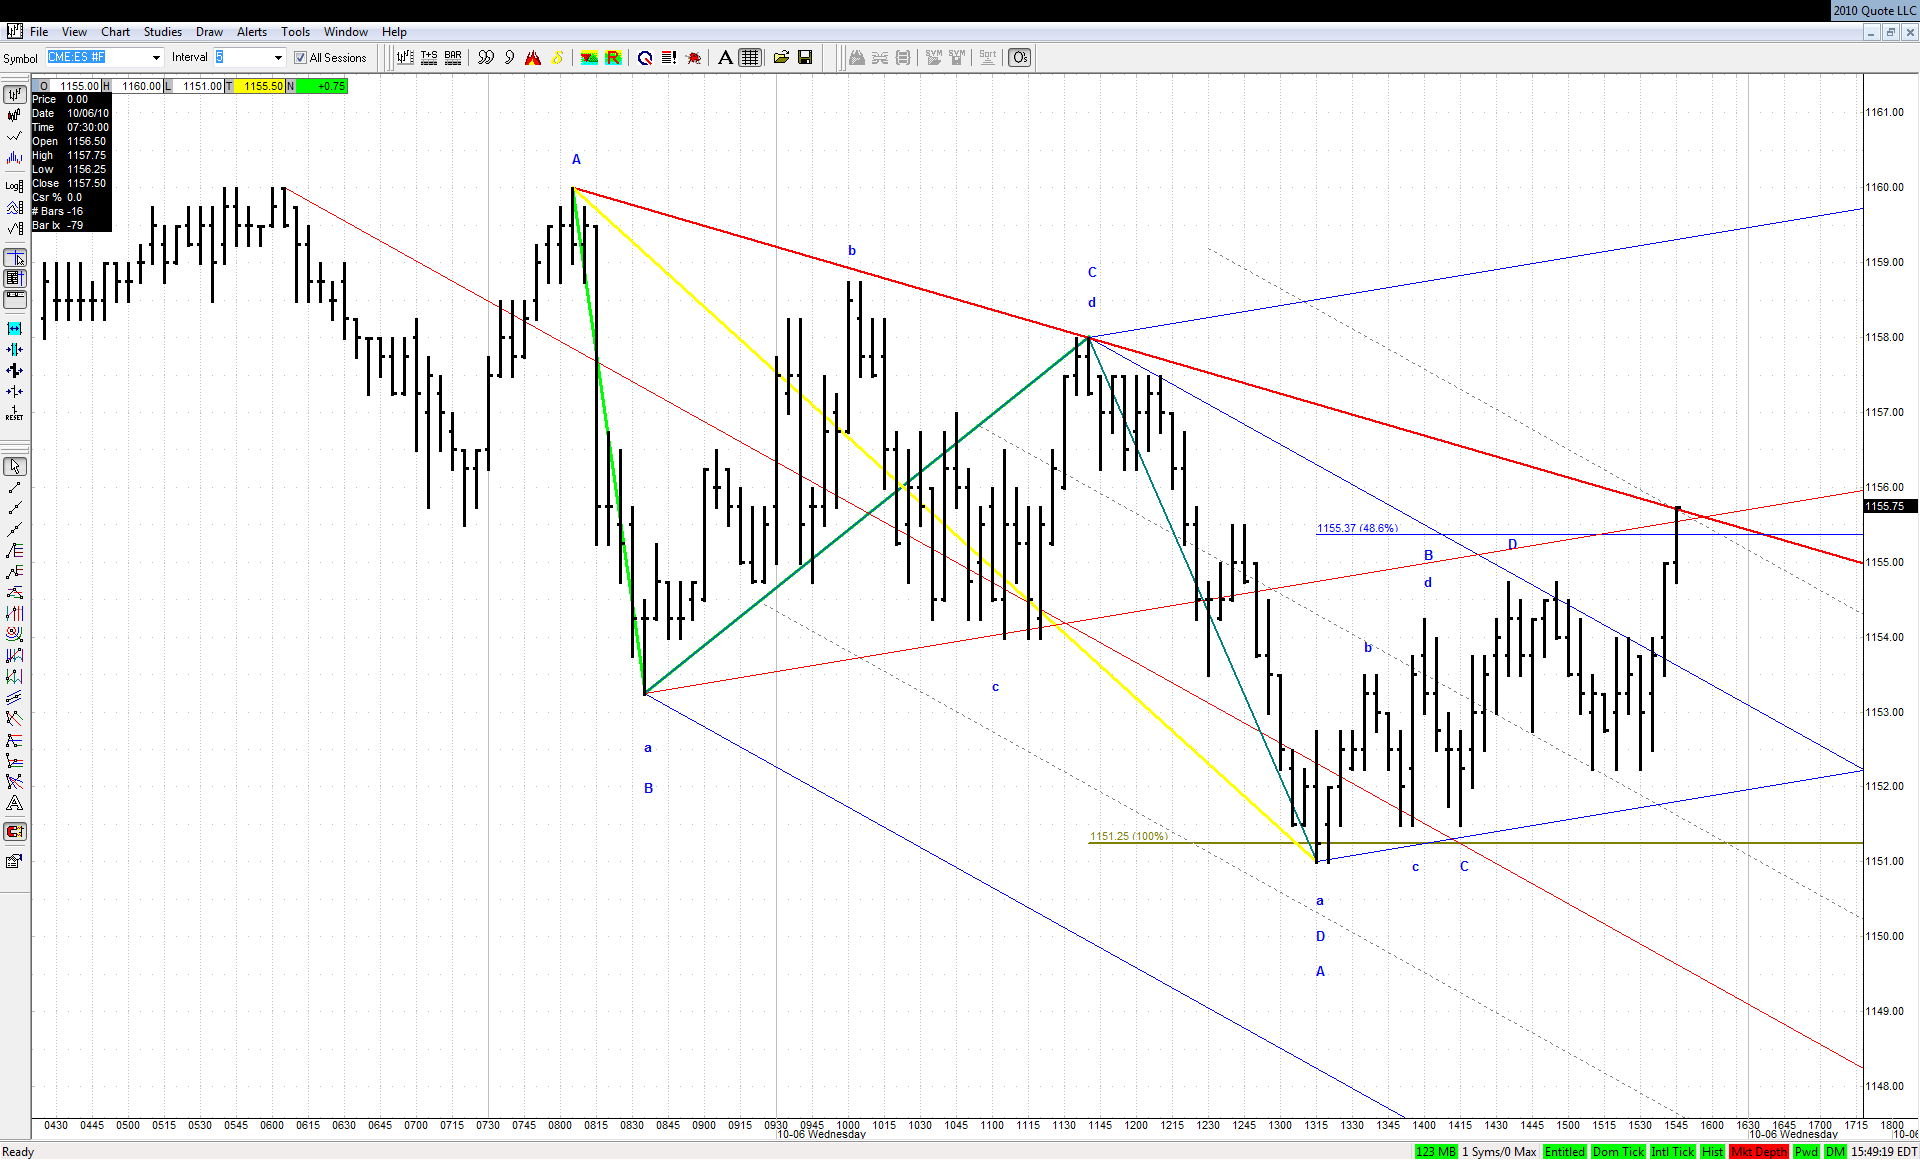
Sure, I mean, sometimes I don't read it right.
JI
jimkane
Rep: 3,058
Posts: 33,089
Now, it reacts dead off your TL, and pulls back to where? A .300/.447 overlap, and then up and over strong, playing out what? Exactly what Jim suspected with that reaction off the bigger ABCD. Sometimes it's so simple and obvious it seems amazing it actually does it. Now, could this be another variation of an ABCD in here? I think so, so I'm watching this area here with great interest, especially given they chose to close it here. My experience with this current market is that when it closes it at a pattern like this the odds (I'm making this number up just to give some feel to my point) are like 99% it blows the pattern out.
JI
jimkane
Rep: 3,058
Posts: 33,089
No posts for today???
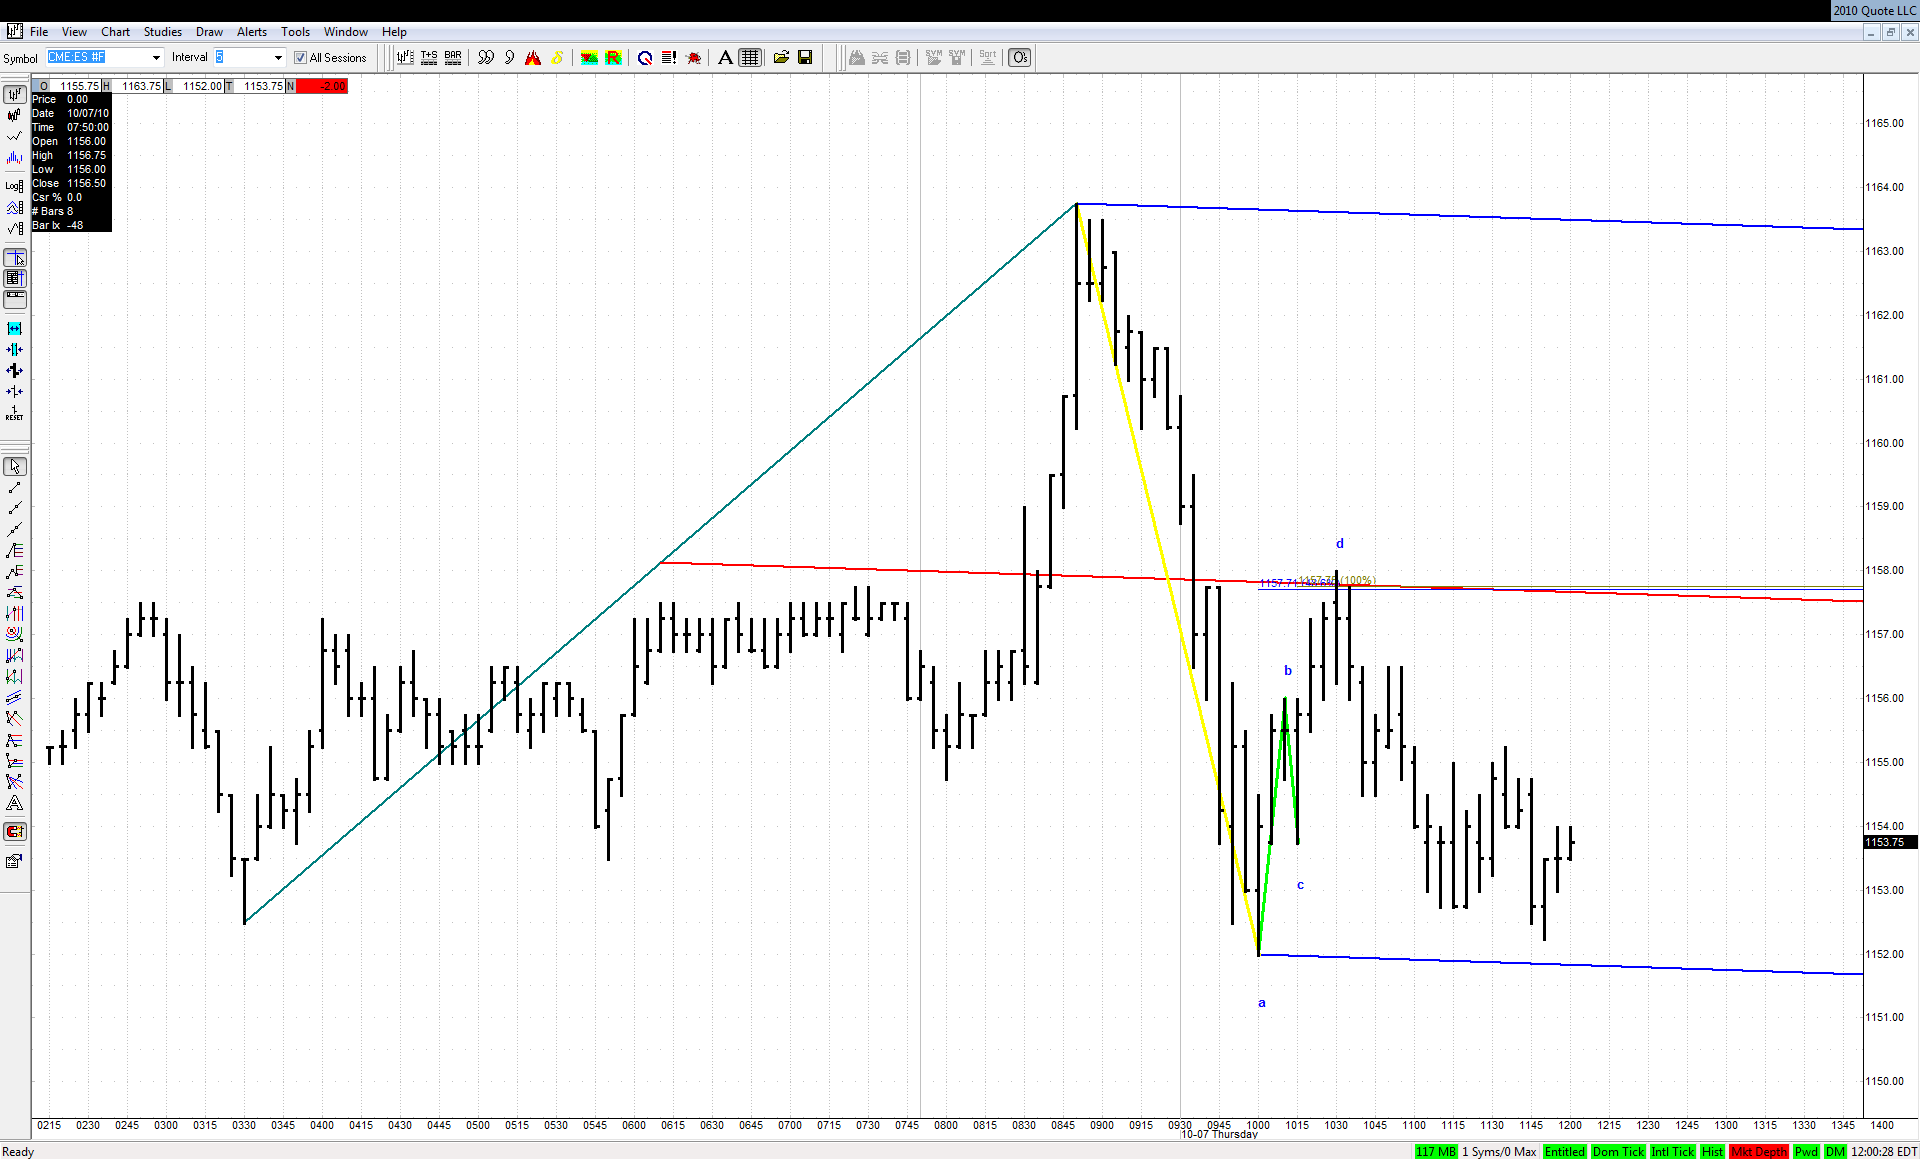
So, it did blow that small bearish ABCD out, as expected, and did a 1.272 move to a new high for the move, to 63.75. jarek, can you update the daily chart for us? Was that it? Bear move resumes?
JA
jarek
Rep: 94
Posts: 3,474
Looks like somebody is in a hurry on the short side - this quick abcd above was it as for correction of the first push down
JI
jimkane
Rep: 3,058
Posts: 33,089
Now notice it may be the BC leg of a bigger ABCD, if this isn't a 'W3' here. I hope it's a 'W3', as I'm short side bias both mid-term and intraday short-term.