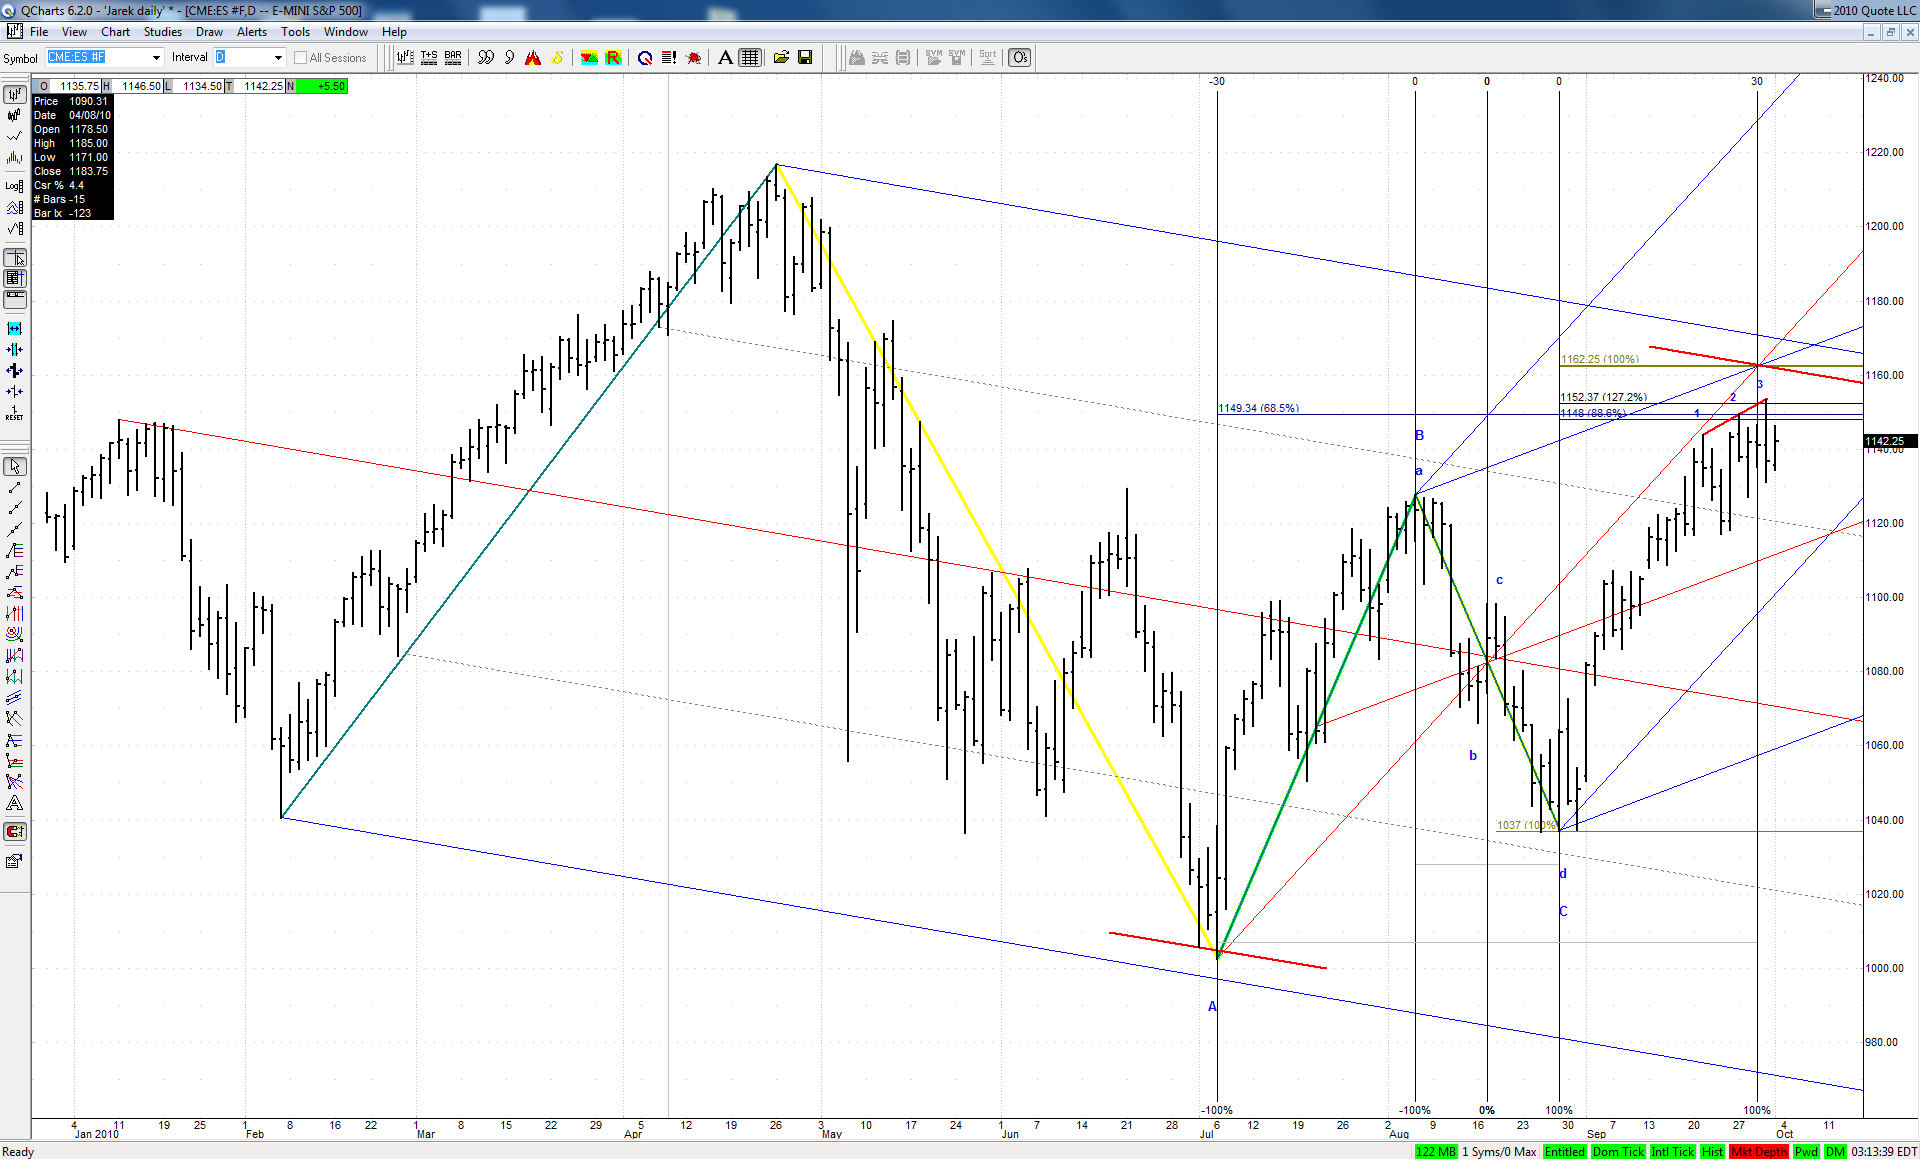
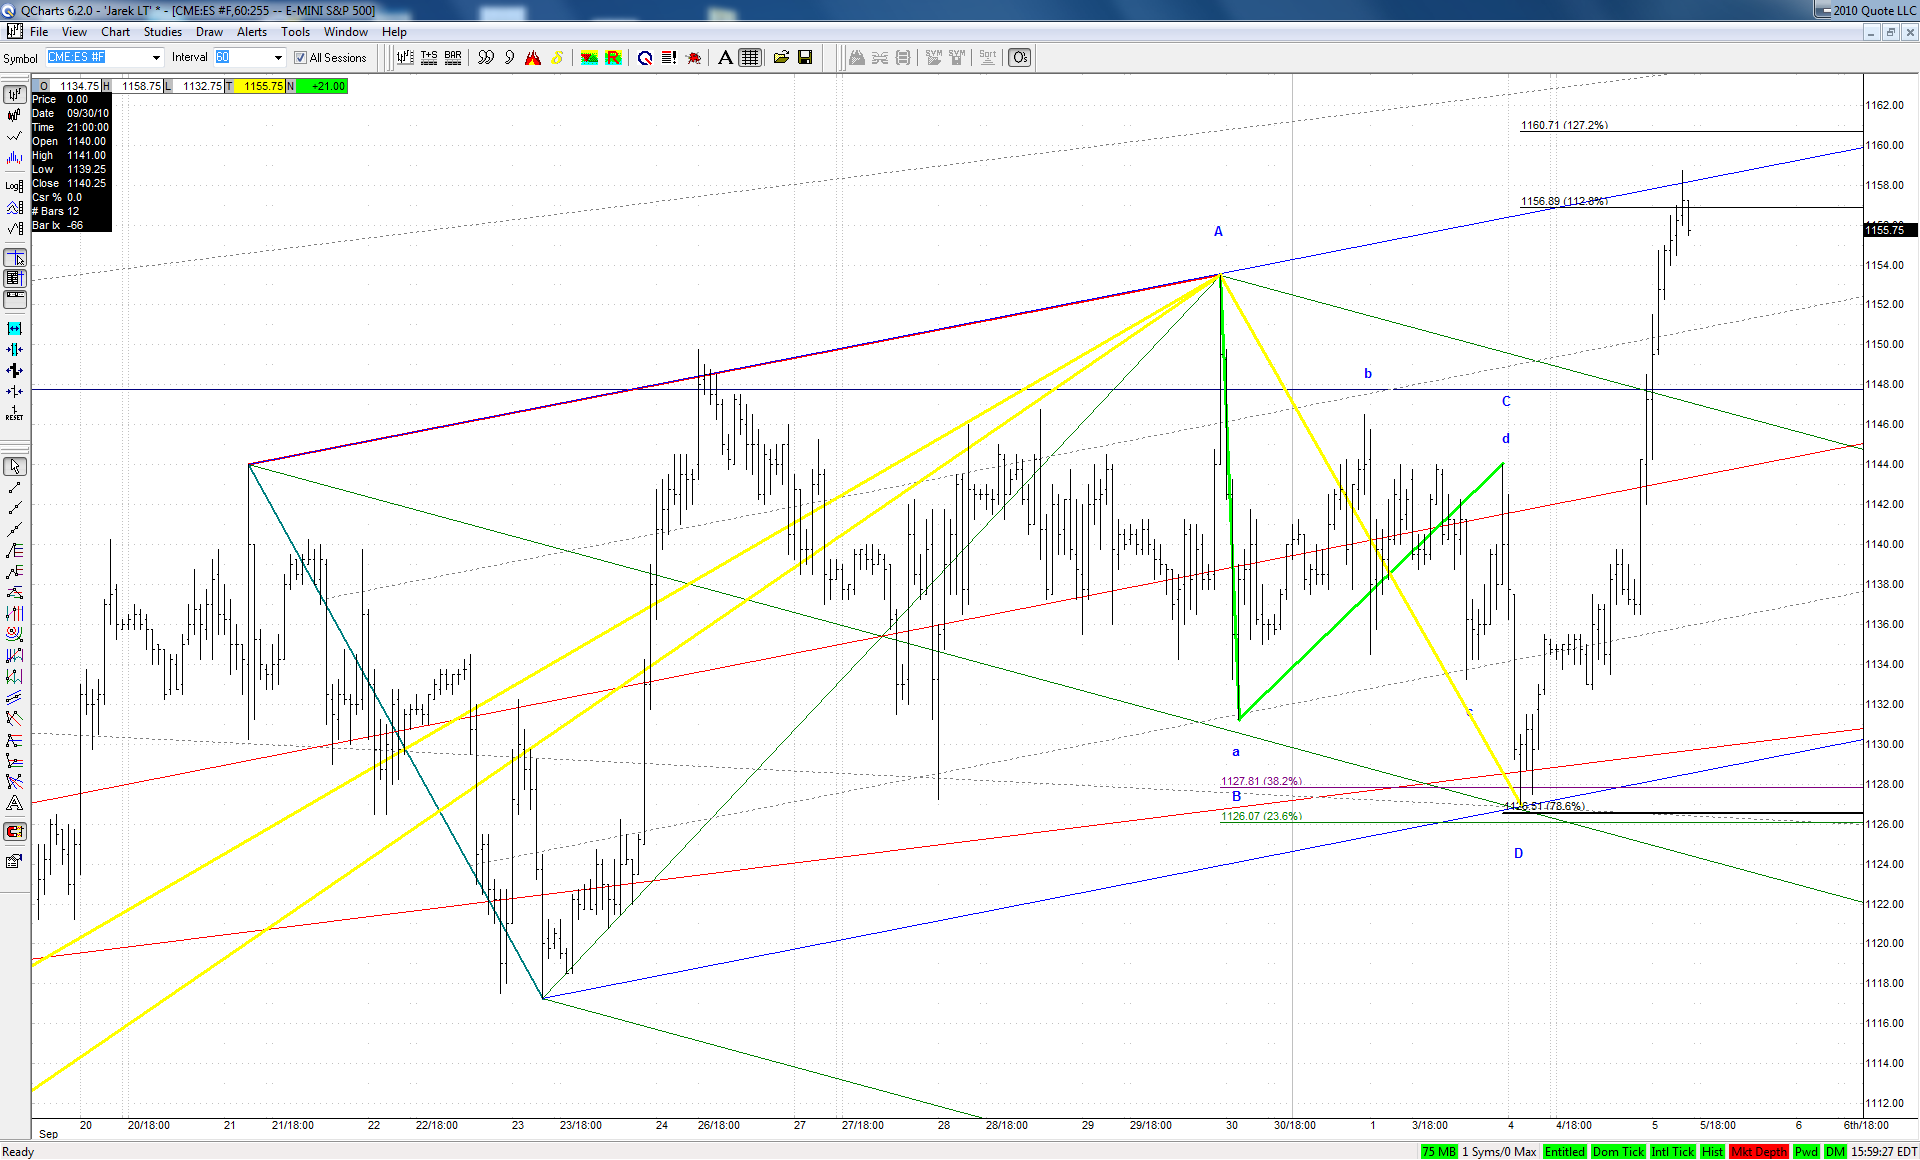
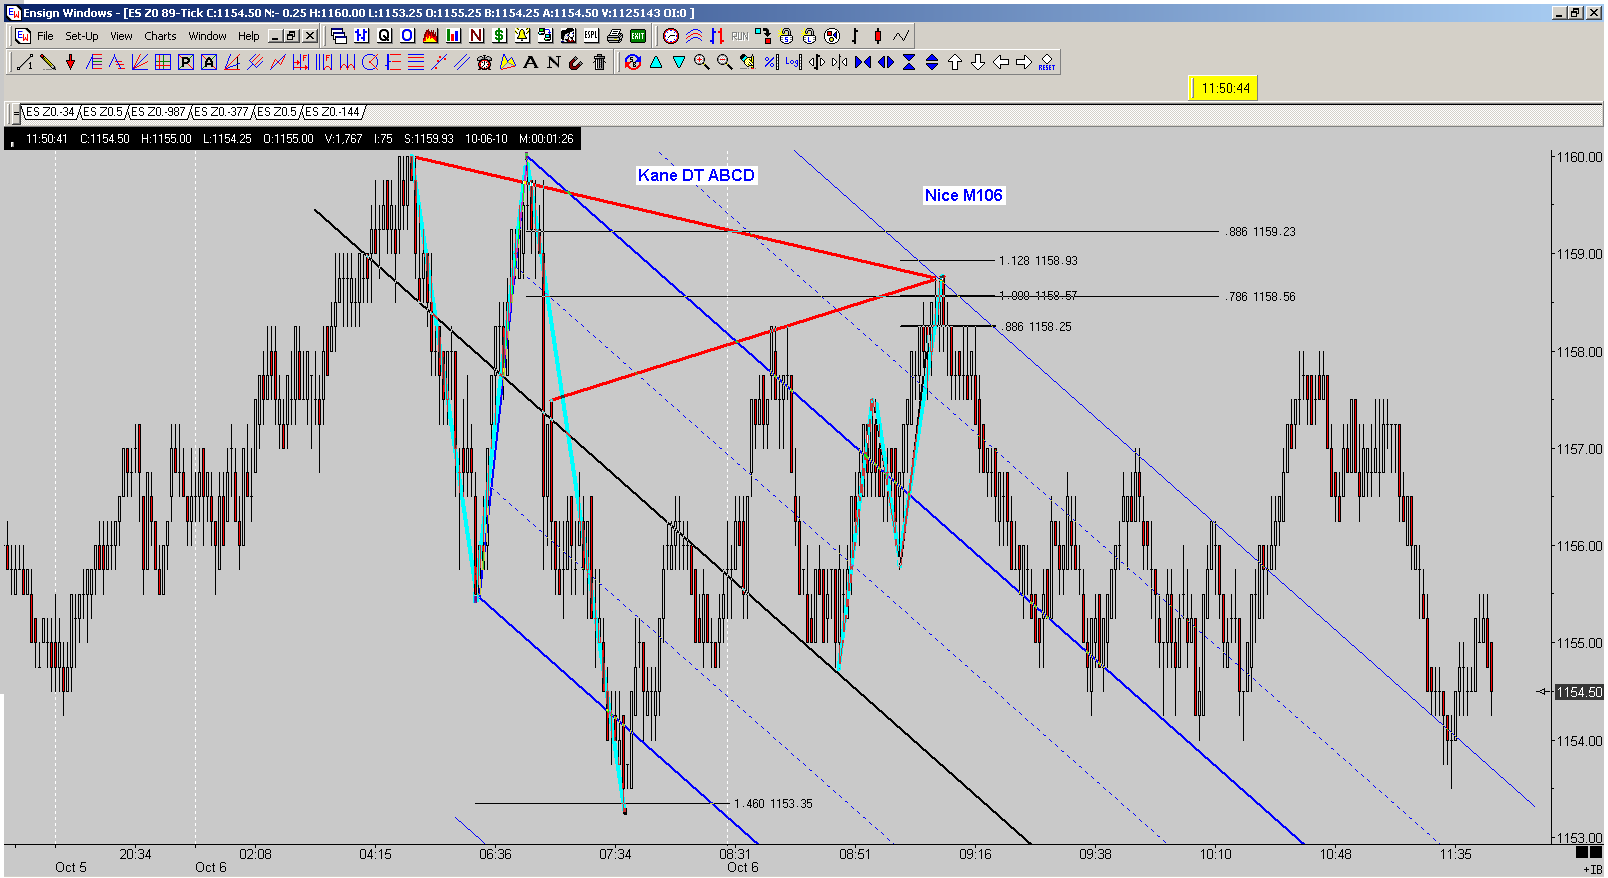
The question is: was this already it, 1 day and 9 points away from our perfect 'symmetrical' target or yet it needs to reach the 1.000 ABCD regardless of the time factor:
Click image for original size
This 3D at spike line might suggest the former, but if it breaks to the upside it might break the whole ABCD as well and go up, up and away as per Jim's scenario
Looks like there was no reason to be cautious on the long side - the setup played out close to perfection:
Click image for original size
JA
jarek
Rep: 94
Posts: 3,474
2
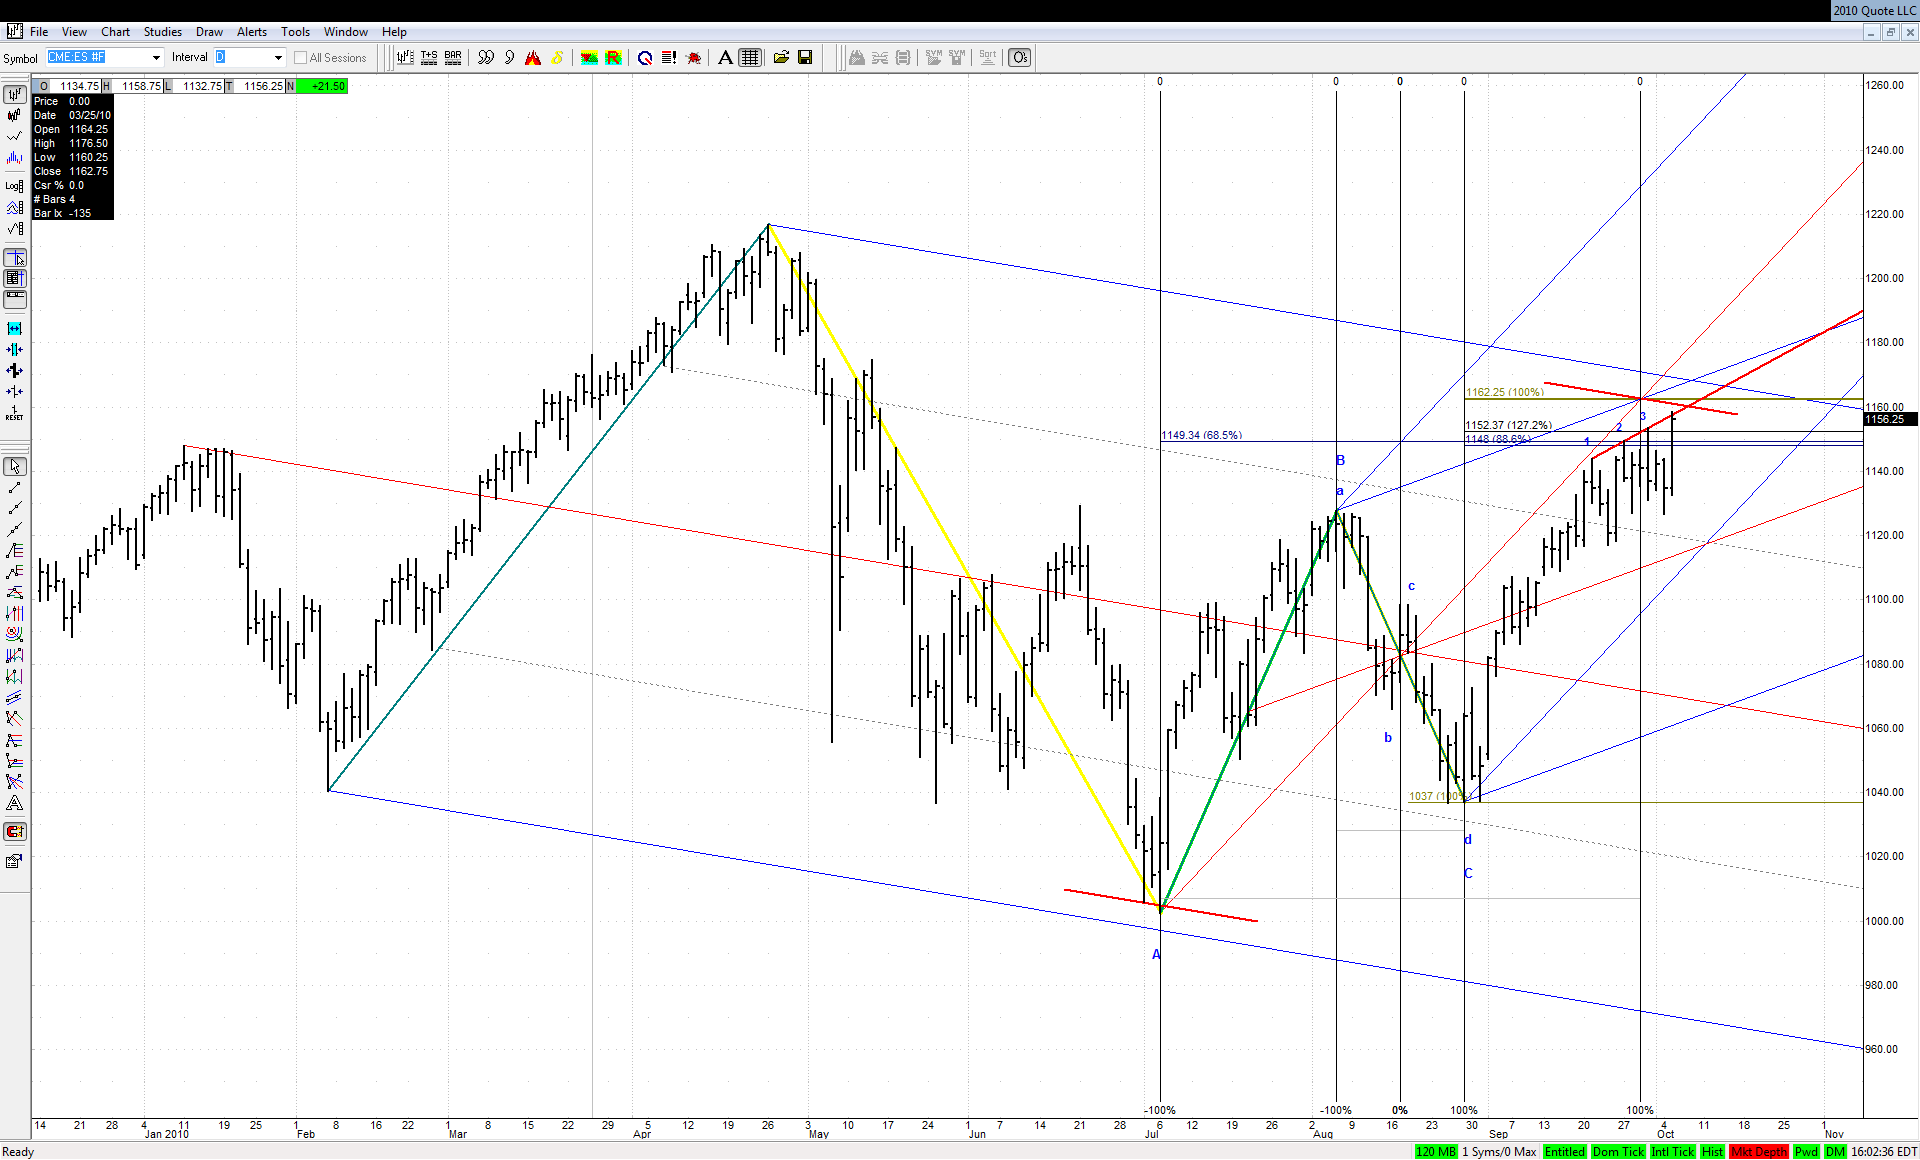
And here is the update of our setup on daily:
Click image for original size
The high so far was exactly on the extension of the spike line
JI
jimkane
Rep: 3,058
Posts: 33,089
1
(Edited )
In case anyone was wondering why I think we are at the most crucial juncture of this entire mess to date, think about our charts posted recently, my sarcasm, my 'W2' comments, the insider selling, and so on, and look at this chart:
Here's the source of the image and some discussion on it:
It think that what you are showing above fits very well to our daily bearish ABCD scenario. Even if longer term this thing is going to the moon, first they would probably like to get rid of some of the stowaways on the long side. If it starts falling heavily right now, many would think that this comparison to 1930s is going to play out fully and will bail out of their positions. In the most unexpected moment - but only for those not following KT methodology :-) - it will turn up and never look back ...
JI
jimkane
Rep: 3,058
Posts: 33,089
1
(Edited )
Well, the giant Euro ABCD is basically hit, just as the S&P ABCD is hit. Not a coincidence, I think. It will really be a crying shame when those blow out and turn out to be 'Wave 3's', and the U.S. nightcrawler gets hammered even worse than it is right now. I hope $10 gas at the pump is worth it...
JA
jarek
Rep: 94
Posts: 3,474
1
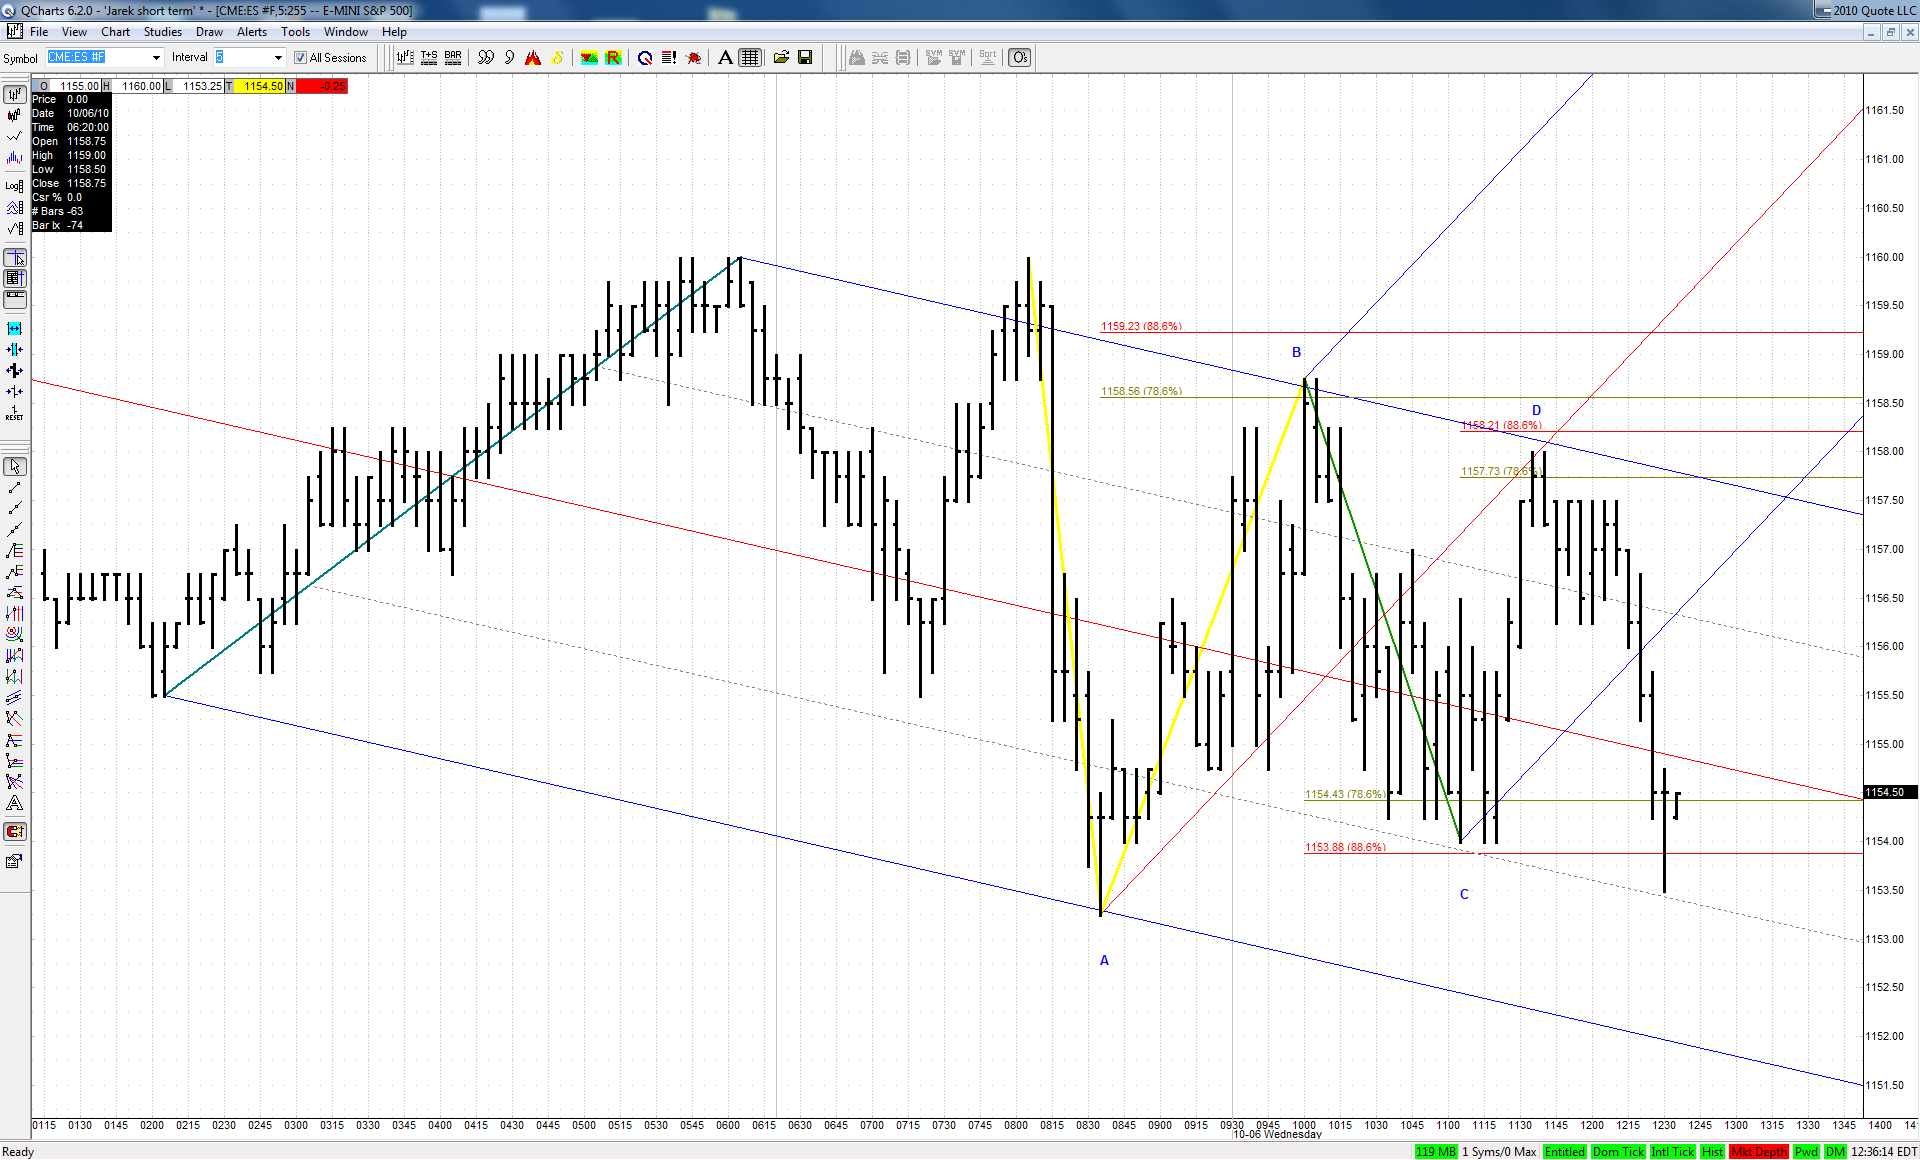
'Game Zone' rules today. Was this 4PT a W2 or a BC leg of yet another bullish ABCD?
Click image for original size
AL
albert
Rep: 99
Posts: 3,094
1
Kane DT ABCD & Kane Pattern-Line-Fib with Price reversing at confluence of 0.886 & 1.272 Fibo Retraces & 2 Spike Lines.
Al Kamego
Click image for original size
AL
albert
Rep: 99
Posts: 3,094
0
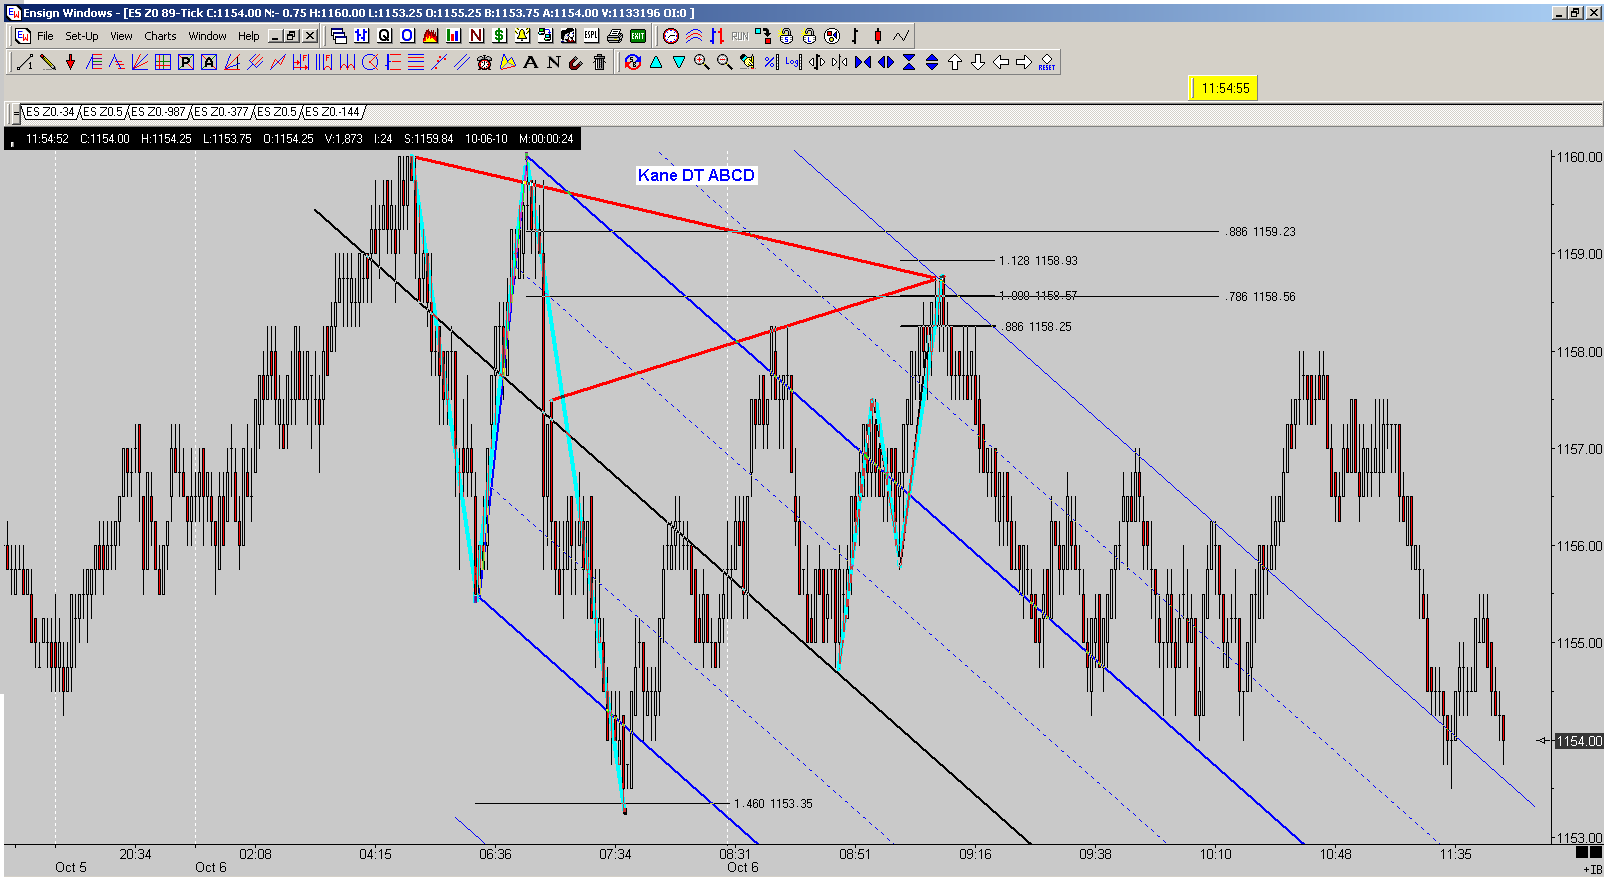
Here is the same chart without the "Nice M106" label. Too much information!