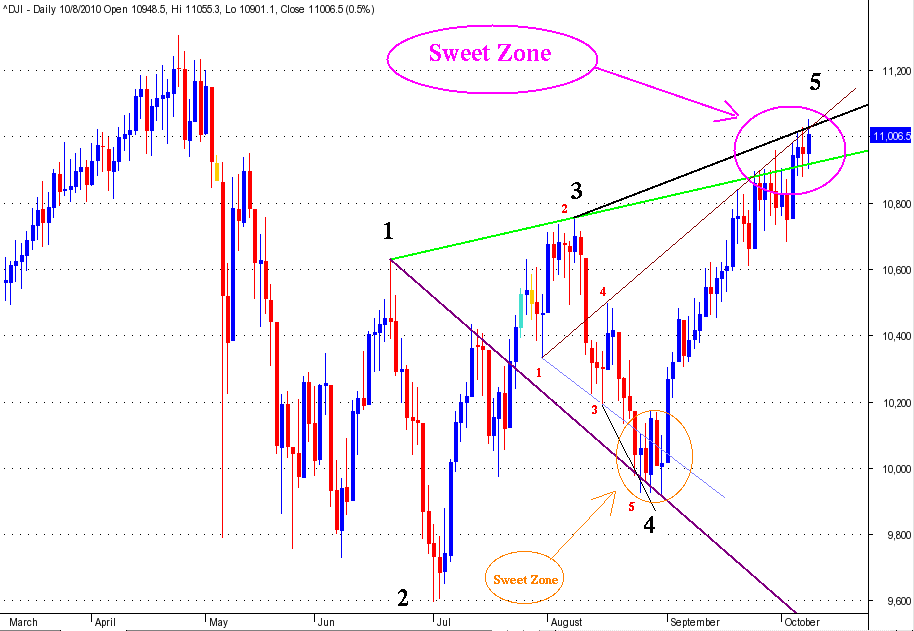
Structured Wolfe Wave setting up in DJIA
The Estimated Price at Arrival line implies a significant correction is coming over the next few weeks. If it lasts as long as the previous correction, it likely will drop to the 9000 level or lower.
Click image for original size
Will you be trading this as a swing trade? If so, what will be your target entry, stop and profit target?
I would trade this as a swing trade.
Entry, stop, target is too simplistic for me. I use a more proactive style of trade management.
I use options to swing trade, mostly Vertical Spreads but if IV is low enough, I will consider individual options. That gives me a built in catastrophic stop which protects against 'Black Swan' events.
Wrt this case, I like to see an increase in Volume at the turning point. That has not occurred yet. If Volume increases here (especially if it spikes), I would try to take a position in the 'Sweet Zone'.
Absent a Volume increase, I would wait until price starts to move down before entering.
I fine tune my entries on an hourly chart (and sometimes further on a 10 minute chart). I am looking for a Price Action entry. When multiple fractals align, you get your best trades.
Once in the trade, if it goes against me (in this case that means a BO to the upside, I don't mean by a few ticks but starts to run to the upside) I try to exit my position on the next down swing. This technique works very well with options and I rarely take the full catastrophic loss.
The Wolfe Wave target is the purple line drawn from 1-4. It makes it to that line frequently. My observation is it makes it 2/3 of the way to the target line almost every time. I monitor the trade on the daily and hourly charts looking to close the trade. Once price gets 1/2 way to the target line, I pay closer attention. This does not require much time. I might check on the hourly a couple of times a day.
I'd be interested to see your actual entry/exit when/if you take it (i.e. if everything lines up).
I'm a big fan of Nassim Nicholas Taleb and his two books The Black Swan and Fooled by Randomness. I think that using options has a lot of merit if you're targeting black swan events but I was always under the impression that Taleb advocated holding those options through to expiration to allow you to have continuous exposure to the upside of the black swan event. However, in this case I think that you're saying that you're protecting yourself from the negative impact of a black swan event and not trying to expose yourself to the gains that can come from a black swan event. Is this right?
I'm a big fan of Nassim Nicholas Taleb and his two books The Black Swan and Fooled by Randomness. I think that using options has a lot of merit if you're targeting black swan events but I was always under the impression that Taleb advocated holding those options through to expiration to allow you to have continuous exposure to the upside of the black swan event. However, in this case I think that you're saying that you're protecting yourself from the negative impact of a black swan event and not trying to expose yourself to the gains that can come from a black swan event. Is this right?
I don't understand how you would play Black Swan events. They are unpredictable (like the 9/11 attacks or a presidential assassination). Unless you have inside information you would not know they were going to occur.
I am not really concerned about Black Swan events that help my positions, they result in windfall profits. Black Swan events that hurt my positions have the potential to wipe out my account or worse so I need to be protected against that.
The biggest risk in holding positions overnight is the possibility of opening gaps against your position. Stops cannot protect you against opening gaps but options can. If you trade futures you know about Limit Moves. The record for Limits Moves is in Orange Juice. IIRC, OJ went Limit Up 21 days in a row due to weather events.
I don't like holding options until expiration. Unexpected things can happen during expiration week. Ever wonder why they use the term 'witching' to refer to option expiration day?
Options are a very effective risk management tool and can be used to take advantage of any market condition. If you use options intelligently, you can make more money with less risk and less capital than trading the underlying.
The way that Taleb recommends that you play Black Swan events is to be continuously exposed to an unlimited move while being protected against an adverse move.
I don't believe he explicitly states the use of options but from that description it implies that options are probably the most suitable method for applying this strategy.
The other thing that's interesting about that statement is the unlimited move which almost always means being on the long side because a short is normally limited when the underlying security hits zero whereas a long will have no limit; very much like the OJ example that you gave.
BH,
thanks for taking the time post a well annotated chart.
About 3 years ago I was looking for Wolfe Waves in different time frames for the ES. I actually caught a few that were substantial, but they seemed to be in the daily and weekly bars and after a few months of dud set-ups I found it didn't matter much for my style of trading (intraday).
Still, though when they come in it is fascinating.
Did you take the course?
Do you ever look for Wolfe Waves on intraday charts.
Please keep posting any comments you have to share about the Wolfe Waves and for that matter any observations you care to share about trading.
thanks
I have been studying Wolfe Waves for several months. I have only paper traded them so far but results are very promising. I like to test things very very thoroughly before risking real money.
I first came across WWs in a book called Street Smarts: High Probability Short-Term Trading Strategies. The description given there is incomplete.
I have not taken the course but I did read the manual from the course. There are very specific rules for what constitutes a WW. I have seen several online discussions about WWs but at least half the charts posted show wedges that don't qualify as WWs.
I have found WWs on intraday charts. Bill Wolfe is primarily an intraday trader and has example charts in his manual covering timeframes from 1 min to daily. They also work on tic and constant volume charts.
I made some notes highlighting the important points from the manual. If you like, I can post my notes.
Originally posted by PAUL9
Do you ever look for Wolfe Waves on intraday charts.
This blog
http://brianhoffmantradinglog.blogspot.com/
was referenced in another message. I was looking at the attached chart and thought it might be fun to see how many WWs I could find on a 200 tick chart.
Click image for original size
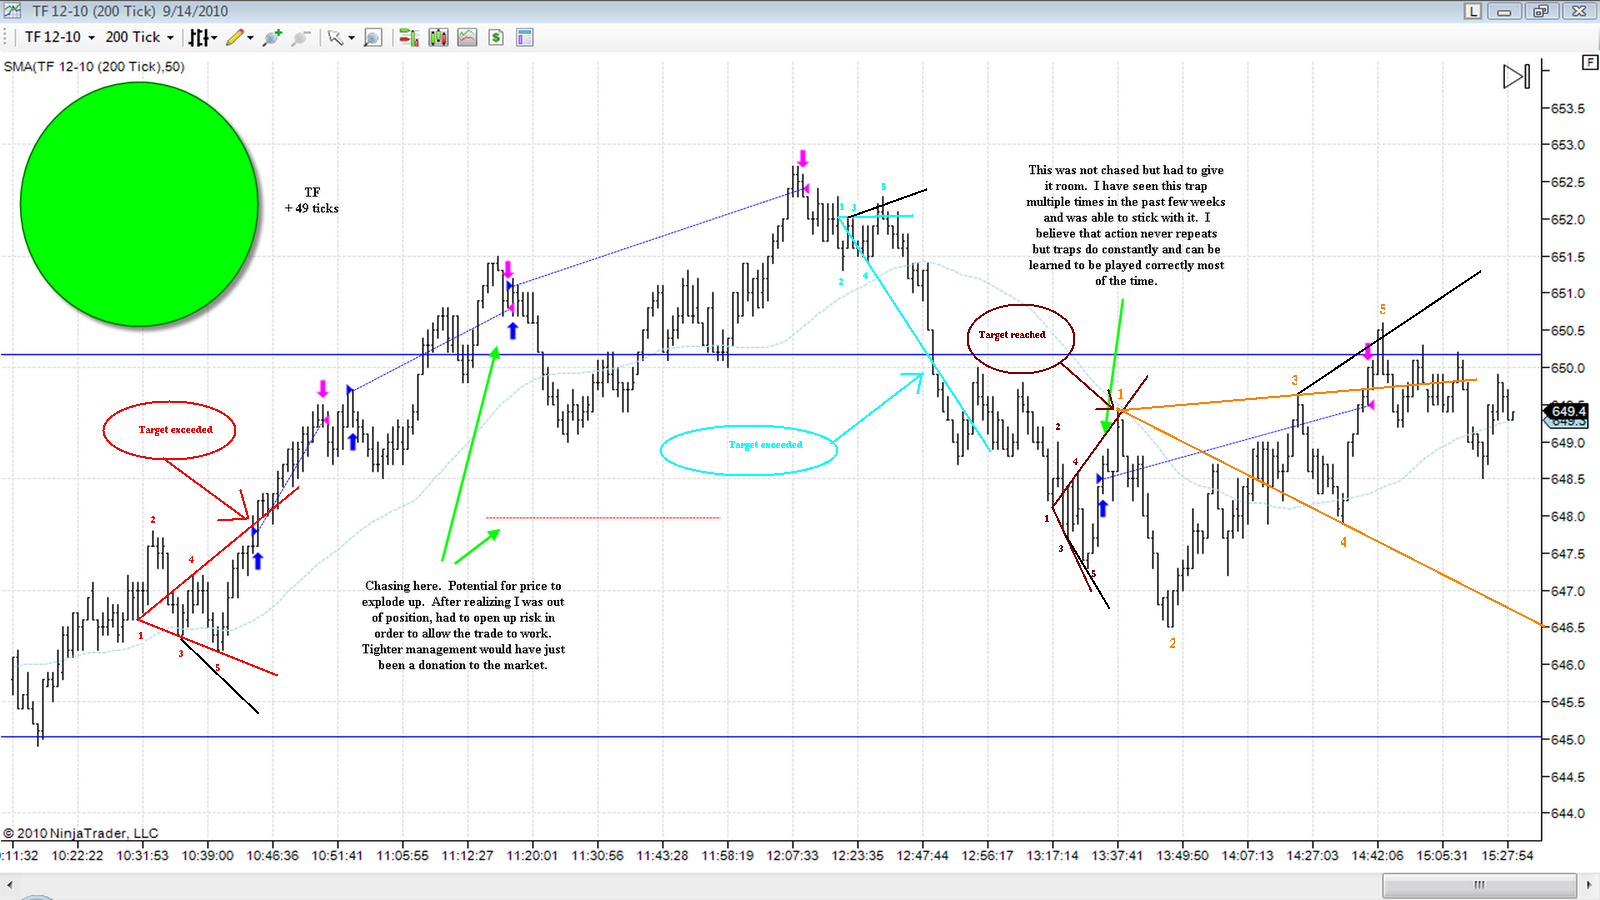
I found 4 WWs. All profitable. 3 of the 4 reached or exceeded the target line. The 4th was at the end of the chart. It dropped under 646 by the EOD, it probably would not have quite reached the Target Line.
Notice the 2nd WW, it is an advanced form because there is no Point 1 pivot that is not higher than Point 3. In cases like this, Bill Wolfe says to draw a horizontal line through Point 3 and where it intersects the 1st bar to the left is the 1 Point. In reality, this is a very small WW for this chart. In cases like this, I think it is best to use a smaller fractal to view the wave (maybe a 50 tick chart). It should then be possible to find a suitable pivot for Point 1.
BH,
I for one would really apreciate any notes and pointers you could provide.
When I used to look for them (I'm guessing about 2-3 years ago) the parameters I used were just misc stuff I got off the internet.
Please post,
actually, maybe I'll go through my files and see whether I can find the notes I used to use, If I do, I will post them and you could point short-comings if there are any.
Please post yours, it would be much appreciated.
Here are my notes.
A Wolfe Wave (WW) is a very specific type of Wedge.
There are 5 points needed to complete a WW.
You start by identifying Point 2. For a Bullish WW, it is the highest Point of the wave. For a Bearish WW, it is the lowest Point of the wave. It is best if it is a significant swing point.
Point 3 is the end of the next price swing away from Point 2 (below 2 for a Bullish WW and above 2 for a Bearish WW).
Point 1 is the starting point of the price swing that ends at 2 (below 2 for a Bullish WW and above 2 for a Bearish WW). Point 1 must be chosen to not exceed Point 3.
Point 4 is the end of the price swing that follows Point 3. It must overlap Point 1 but not exceed point 2.
Trend Lines 1-3 and 2-4 must converge.
Once Points 1,2 and 3 of a new WW form, we can estimate the position of Point 4. Draw a paralell of the 1-3 Trend Line at Point 2. The 3-4 price swing must terminate before reaching that line or the 1-3 and 2-4 Trend Lines won't converge. Next draw a Balance Line from Point 1 through the Balance Point of the 2-3 price swing. Point 4 is likely to end at the Balance Line.
Point 5 is the end of the price swing following Point 4 and likely will exceed the 1-3 Trend Line. This is the entry point for a move to the Target Line (also referred to as the Estimated Price at Arrival (EPA) Line).
Once you pass (or equal) point 3 you have a completed WW; however, the run over can be quite substantial on some WWs. To determine the Sweet Zone (SZ) entry area, connect a parallel of the 2-4 Trend Line to point 3 (sometimes Point 1). The SZ is the area between the 1-3 Trend Line and the 2-4 parallel. Previous S/R sometimes coincide with the SZ.
The EPA Line is the 1-4 Trend Line.
Estimated Time of Arrival (ETA) is apex of Trend Line 1-3 and 2-4 (this does not seem to be very accurate or useful for trading).
A well structured WW has a contrary WW between points 3 and 4.
For the best WWs, the 4-5 price swing is uninterupted. That means there are no corrections that create S/R points where a contrary WW might form while in the trade.
Price spikes at the 1 or 3 point can distort the WW and cause the 5 Point to not reach the level of Point 3.
WW trading is not trend trading. WW trading looks for precise moments to jump in for a fast measured move.
WW trading excels in fast choppy markets.
WWs develop after a trend line is broken. It is a natural reaction for price to try to get back onto a broken trend line. The right shoulder of a head and shoulders pattern is often a potentially explosive WW.
Important turning points are often accompanied by stopping volume. As the reversal gets going, volume has a tendency to lessen and then increase again at the next stopping point. On a chart, it will have a saucer like appearance.
When the market is trending, the SZ is rapidly expanding with time. This is not to your advantage when trading WWs that are against the main trend. Avoid WWs with a rapidly expanding SZ.
Ideally you would like the trade to run to the 1-4 line; however, resistance often occurs at Point 4. Get out at the first sign of trouble such as: a contrary Wave, unusually heavy volume or just a very nice fast profit.
If a contrary wave forms on the next lower fractal, consider the consequences of ignoring it. Is the 1-4 line very steep? Do I want to give back my profit trying to ride out the contrary wave?
A poorly structured WW has less of a chance than a Well Structured WW. If volume is not relatively heavy at the 5 point, you should be suspicious. As the price reverses, the volume should decrease. If it does not, be on the look out for a contrary WW forming on a lower fractal.
Also, I noticed another WW on the chart I posted. It is at the end of the chart and is contrary to the last wave marked so an early exit to the last trade is recommended.
If this is a #2 Bearish EW, it should start right about here. ES now trading at 1191.00 @ 13:22> If it is not then it should have void the EW. by 14:11
14:11 is a small time cycle, with 14:55 15:18, 15:48 and 16:03. I look for small highs and lows at support resistance on this times. Will see.
14:11 is a small time cycle, with 14:55 15:18, 15:48 and 16:03. I look for small highs and lows at support resistance on this times. Will see.
Originally posted by i1hunter
I have the WW but starts from the overnight. # 1, 08:30 @ 1191.25 H, # 4, 09:44 @ 1188.25. I think it is making a # 2 of a bearish EW If so then I will be looking at 1176 as the objective. Will see, it needs to finish #2 EW wave first. Will see, In due time will show us the way.
Bearish EW will be voided if price moves above today's high......
Emini Day Trading /
Daily Notes /
Forecast /
Economic Events /
Search /
Terms and Conditions /
Disclaimer /
Books /
Online Books /
Site Map /
Contact /
Privacy Policy /
Links /
About /
Day Trading Forum /
Investment Calculators /
Pivot Point Calculator /
Market Profile Generator /
Fibonacci Calculator /
Mailing List /
Advertise Here /
Articles /
Financial Terms /
Brokers /
Software /
Holidays /
Stock Split Calendar /
Mortgage Calculator /
Donate
Copyright © 2004-2023, MyPivots. All rights reserved.
Copyright © 2004-2023, MyPivots. All rights reserved.