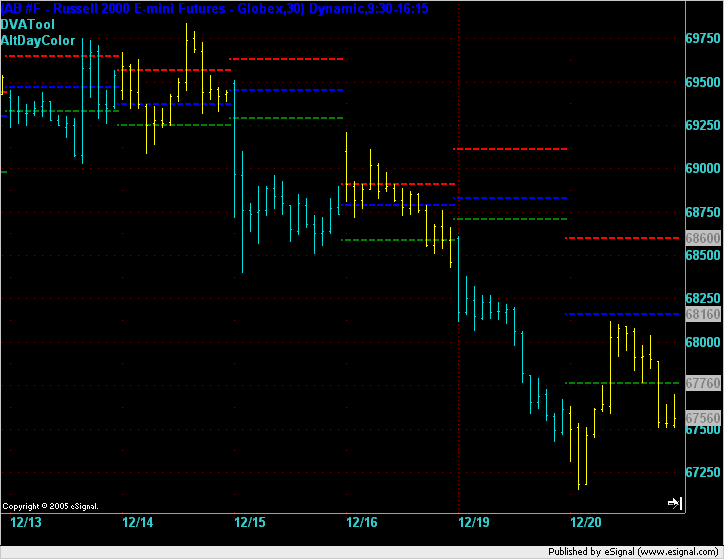
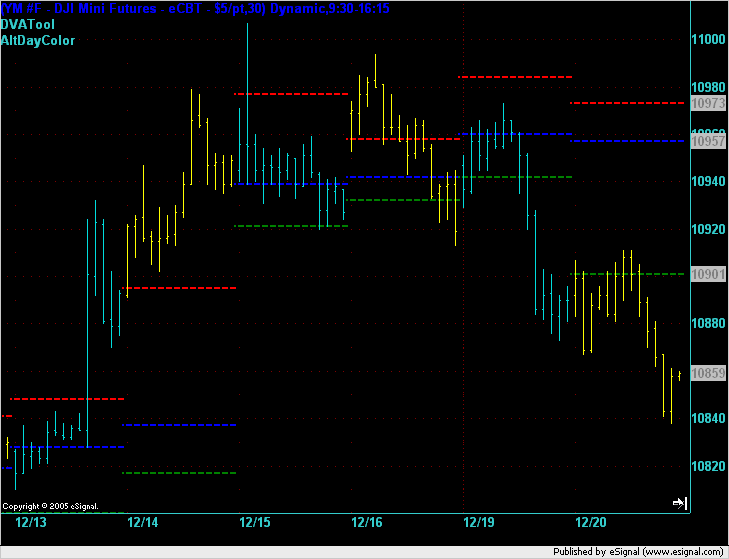
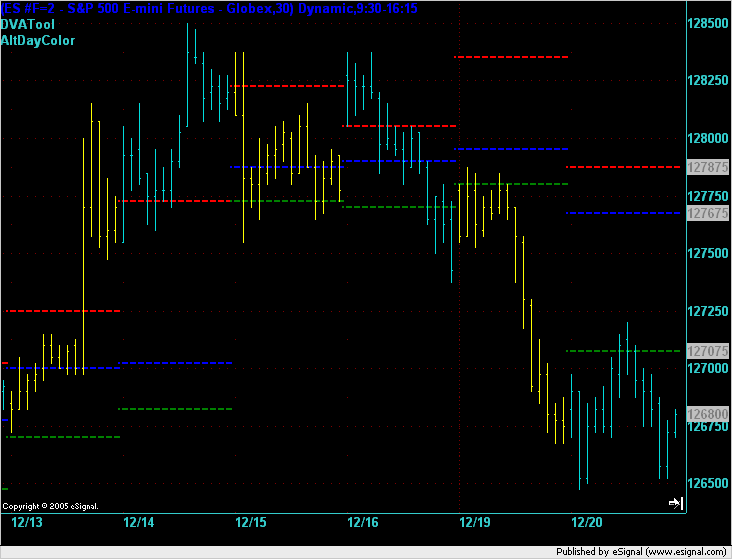
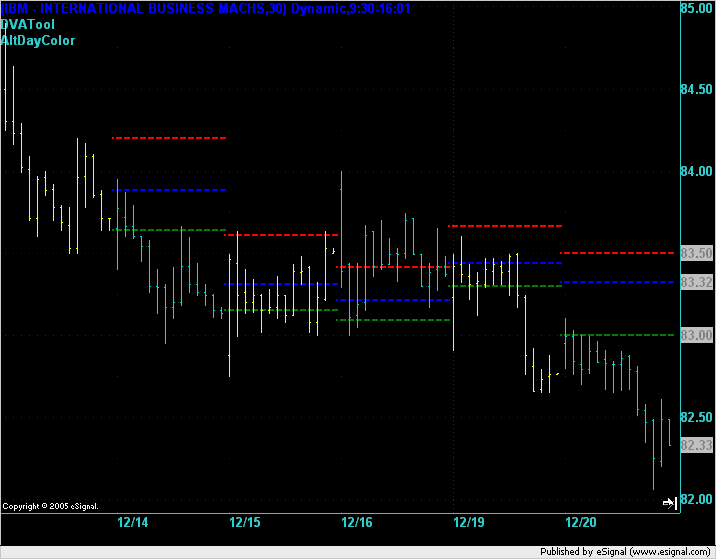
Market Profile charts for ER2, YM, ES, IBM
Here are some charts showing how the market reacted to Market Profile levels over the last week and a half for 4 different symbols: ER2 (AB), YM, ES, and IBM.
Each chart is a 30 minute bar chart with a time template of RTH on it. Days are alternately colored so that you can distinguish which day is which. The 3 horizontal lines are VAH, POC, VAL. If a line is missing this is probably because it overlaps with another.
Each chart is a 30 minute bar chart with a time template of RTH on it. Days are alternately colored so that you can distinguish which day is which. The 3 horizontal lines are VAH, POC, VAL. If a line is missing this is probably because it overlaps with another.
Emini Day Trading /
Daily Notes /
Forecast /
Economic Events /
Search /
Terms and Conditions /
Disclaimer /
Books /
Online Books /
Site Map /
Contact /
Privacy Policy /
Links /
About /
Day Trading Forum /
Investment Calculators /
Pivot Point Calculator /
Market Profile Generator /
Fibonacci Calculator /
Mailing List /
Advertise Here /
Articles /
Financial Terms /
Brokers /
Software /
Holidays /
Stock Split Calendar /
Mortgage Calculator /
Donate
Copyright © 2004-2023, MyPivots. All rights reserved.
Copyright © 2004-2023, MyPivots. All rights reserved.