ES Short Term Trading for 12-16-10
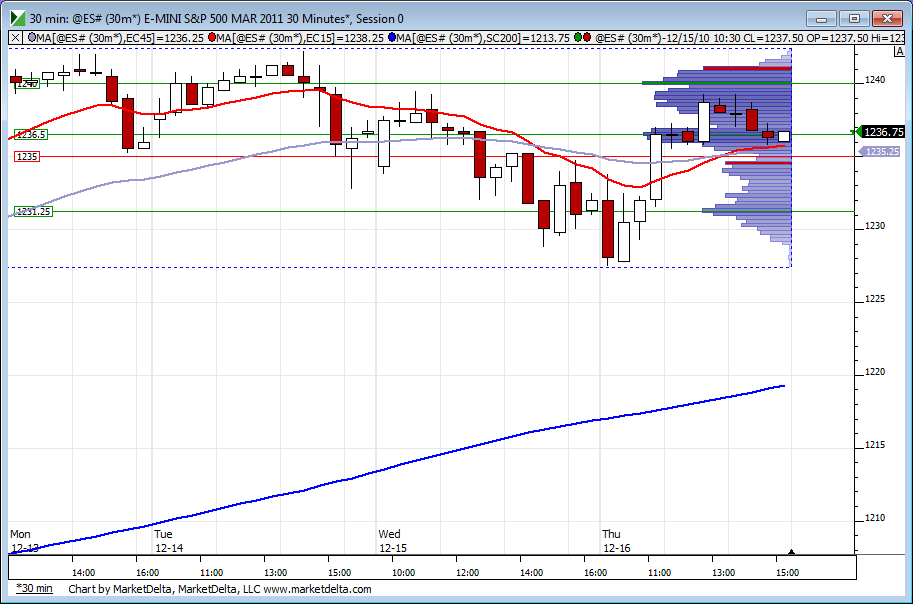
Here's my "map" of the ES on a 30min chart coming into Thursday's trading. Blue lines are potential signif PASR with Magenta semi-signif. Whitish dashed lines are Wkly Pvts and I've got a Red line at 1242 area which was/is a cluster of Fib numbers that now is also a PASR level as well. The 48-52 zone is a wide area of potential Resistance ... couldn't narrow it down any more and feel comfortable, but is something to work with for me. So I've got that big-assed zone, but am seeing:
*1242 area as very signif with 1244 Wkly Pvt nearby and a Daily R1 at 44 calculated off RTH
*1229-1227 as combination of signif and semi-signif PASR along with a Wkly Pvt and Daily Pvt
*1221.50-1219.50 next potential support of PASR and another Wkly Pvt (w/Daily Pvt at 22.50 as per RTH calcs.)
(not gonna list HVN's here as it would likely convolute things with an already pretty busy looking chart ... leaving that for Lorn, Bruce and others ... but am watching that too!)
Here's the All Trading Hours ES 30min chart with all the pretty lines and Disney Land colors.
so hard to manage last one....the risk to reward is always way off....If I am one point away from a target then where is a good place to put stop...? You can't leave it at one point risk because good odds the general "noise" will take you out....
But I hate watching market move without me after an exit.....there's a lot to be said for an "all in , all out" approach but that doesn't solve the personal issue and the "Pain" of watching it go higher without being on board...and I don't chase after an exit...
Ok, nuff rambling
But I hate watching market move without me after an exit.....there's a lot to be said for an "all in , all out" approach but that doesn't solve the personal issue and the "Pain" of watching it go higher without being on board...and I don't chase after an exit...
Ok, nuff rambling
Thanks Bruce. We got lucky on this one, Hope and see many more for all of us
that is a strange place for 4 matching high bars...on 5 minute......normally I wouldn'ttrade for those at highs but given that this is one last runner and it is 4 bars, I'm holding and still using my 15 minute close idea for the exit
'm done at 37 even..I can't watch this....just a bad time of day and so close to final target.....a good run out of those highs though
I know what you mean. I have seeing the market move further from my exit and have also seeing the market reversing right at my exit LOL I never know until after the fact......
If I'm one point away from the target, I use one for one for stop, or pull out, and give thanks for the profits I just got.....then get ready for the next trade. quote]Originally posted by BruceM
so hard to manage last one....the risk to reward is always way off....If I am one point away from a target then where is a good place to put stop...? You can't leave it at one point risk because good odds the general "noise" will take you out....
But I hate watching market move without me after an exit.....there's a lot to be said for an "all in , all out" approach but that doesn't solve the personal issue and the "Pain" of watching it go higher without being on board...and I don't chase after an exit...
Ok, nuff rambling
[/quote]
Volume building at the VA high, 1236.50 from YD....an obvious failure will go fill in the air below down into 34 area for complete fill......just watching and not trading now..
all triples from YD where run...a good example to look at..
range is just so small....
all triples from YD where run...a good example to look at..
range is just so small....
Notice that the ES stop right at the daily resistance trend line and now is working it intraday.
If above it then prev. day H. will be a resistance (1239.50) above that we have MdP at 1241.00 and above that the 12/14 H. at 1242.25. If the ES makes it that high it will be an outside bar. Even above yesterday's high will be an outside bar.
I think we are in wave 4 intraday (2M chart) and making the alphabet a,b,c,d,e. If so, wave 5 after lunch.
Below 1233.00 I will be incorrect on my count and will void my expectations for the 1242/44 objective.
ES trading 1235.75 @ 12:29
Will see, in due time my friends.......
the 37.50 was also a split of the two rats...50 and 25...I thought they'd be done with that by the end of Yesterday....
second attempt to move above 1229.25 (Previous day high was 1229.50) Needs to back down a bid and try one more time. will see.
ES trading 1238.00 @ 13:59
ES trading 1238.00 @ 13:59
Here is the profile for the week so far. Its been an overall low volume environment. 1235 LVN.
Click image for original size
Sure was Bruce.
Originally posted by BruceM
they just ran them.....that's one for the manual when we write it.....seriously though...anyone interested in triples should print out today's chart it was a beauty...
Emini Day Trading /
Daily Notes /
Forecast /
Economic Events /
Search /
Terms and Conditions /
Disclaimer /
Books /
Online Books /
Site Map /
Contact /
Privacy Policy /
Links /
About /
Day Trading Forum /
Investment Calculators /
Pivot Point Calculator /
Market Profile Generator /
Fibonacci Calculator /
Mailing List /
Advertise Here /
Articles /
Financial Terms /
Brokers /
Software /
Holidays /
Stock Split Calendar /
Mortgage Calculator /
Donate
Copyright © 2004-2023, MyPivots. All rights reserved.
Copyright © 2004-2023, MyPivots. All rights reserved.