ES Short Term Trading 01-20-2011
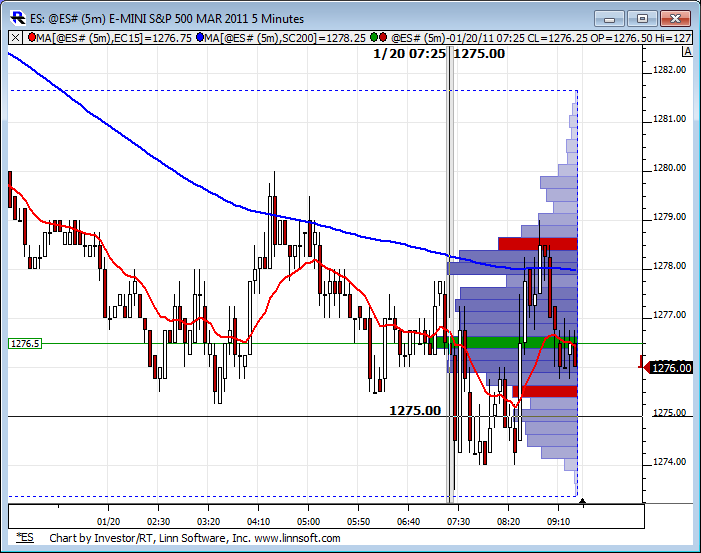
O/N Profile. Notice the blue 200-period moving average which prices have found resistance on...
Click image for original size
nice Kool!!
Click image for original size
Kudos, to you also Bruce! Its nice to start on a good note.... for a change!...now, so i dont have to post so much... numbers for me are 1268.50 and 1265.25 on the downside and 1283-84 and 1289.75 on the upside. Smaller targets for scalps are always possible as price action dictate,however. Im looking for a small rebound today(flat to higher) and tank again on friday. At least thats my overall bias from seasonal and historical considerations. (but of course ,nothing can be etched in stone!)
The 200MA (blue line) is obvious resistance today as is that HVN zone of 76.50 from the O/N. Should be telling if prices challenge that area again.
Click image for original size
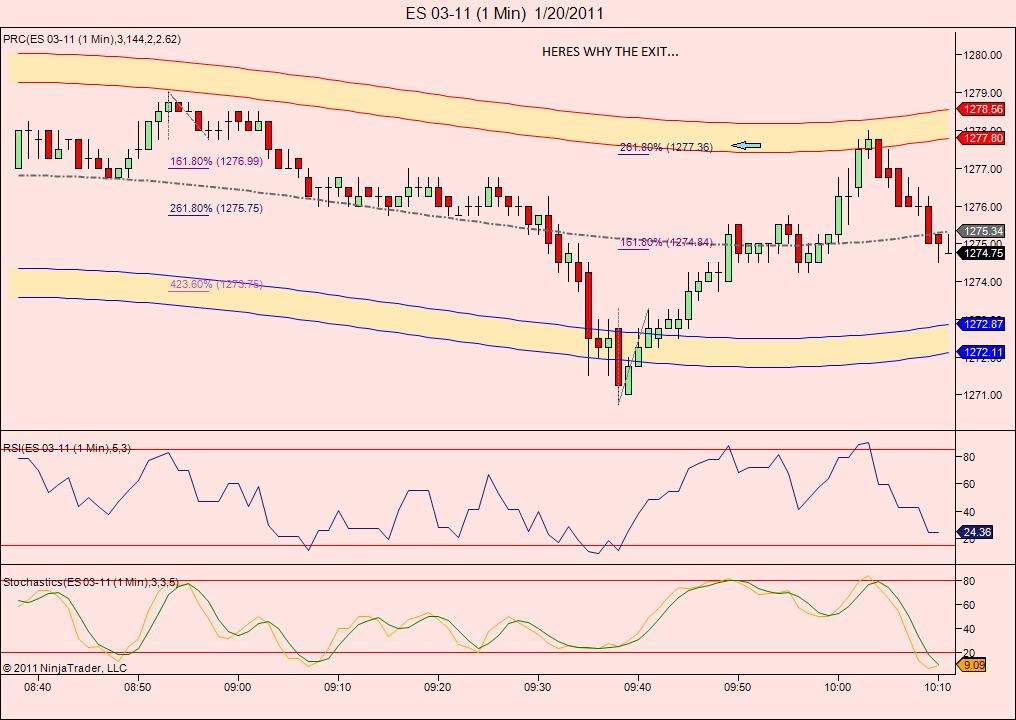
The fact that that we just made another new low makes me too nervous about 1268.50 (from the 13 min chart) to take another long here. The 5 min chart nailed the low, but in fairness ,i drew those projections after the fact.. i was looking for 1271.25(from the 13 min).. You saw the 1268 number, here is where the 1265 comes from....Total decline so far from 1296.25= 26 handles! Thats just about as far as it can go ,imho, before signalling something more serious! But we'll have to see.
Click image for original size
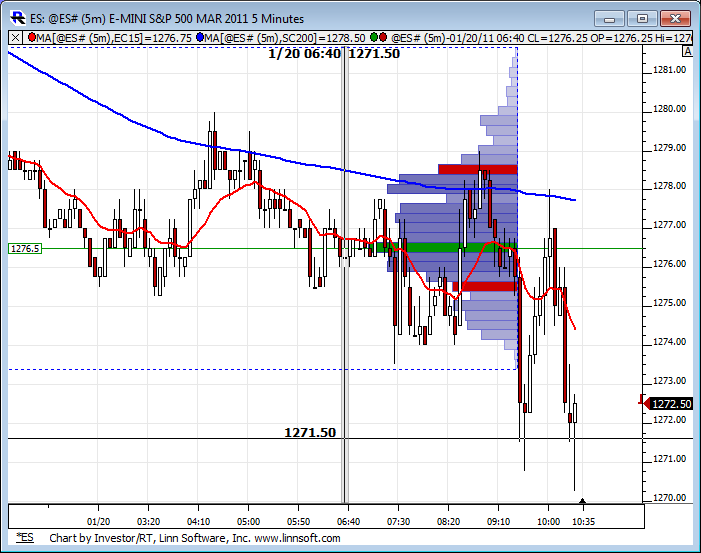
mORE CONSERVATIVE TRADERS SHOULD WAIT FOR 1265.0 OR SO, BUT IM BUYING ONE AT 1268.25 IF IT HITS IN THE NEXT 3 MIN
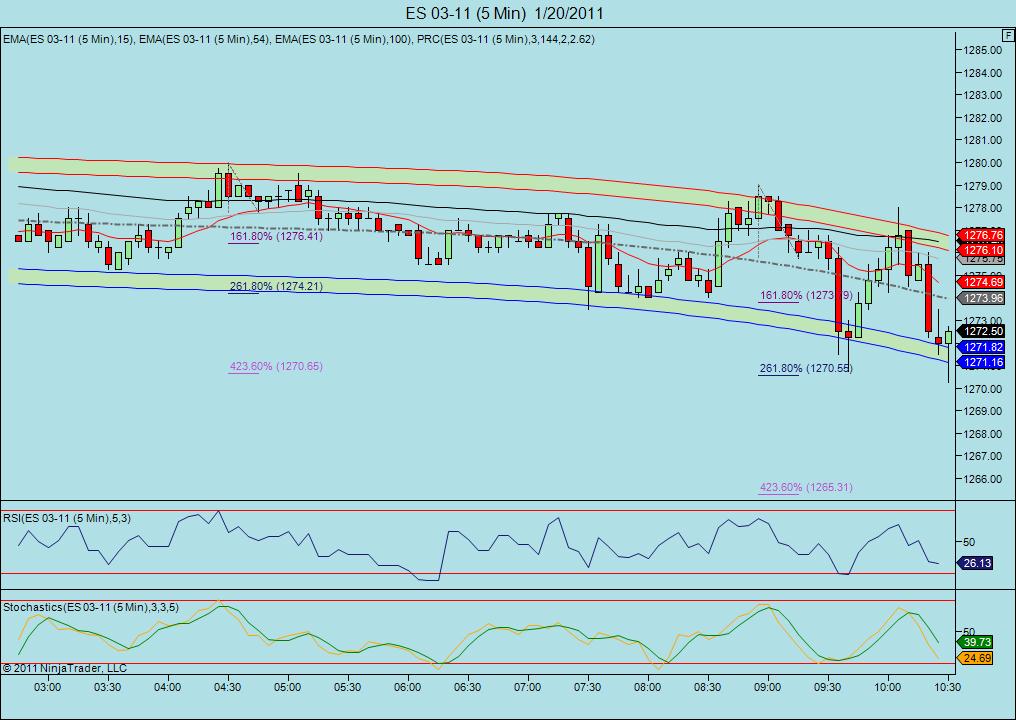
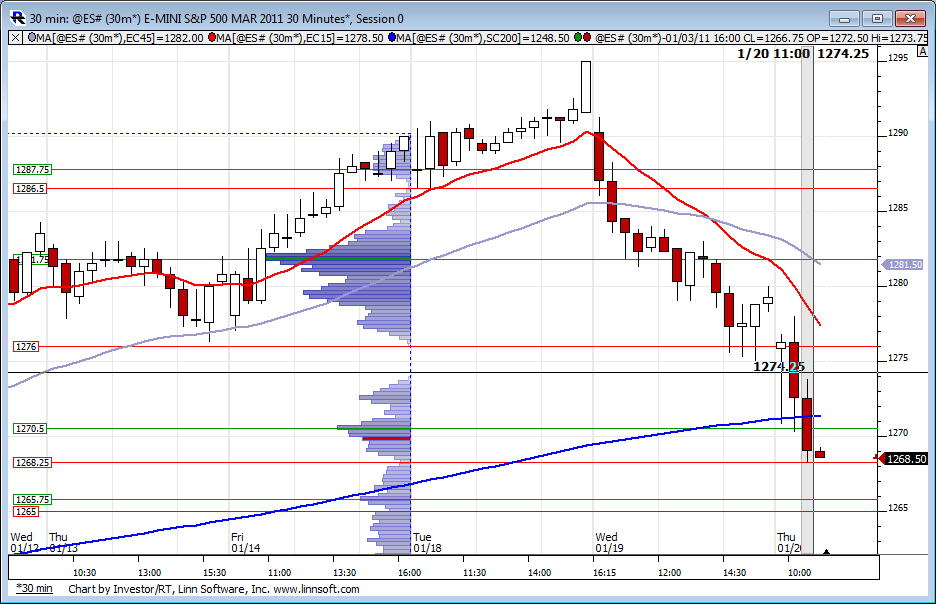
30 min chart showing prices attempting to break below the 200MA at this time frame. Just had a 30-min close underneath it. The profile on the chart is last weeks for your info.
Click image for original size
@$@!$$...Bingo on 1268.25(off by one min, big deal!) but no freakin fill!...cancelling order and getting some rest...
30 min chart would setup a nice reversal if this 12pm ET bar closing over 1269. Looking for 1265.50 to hold (1/10 settle and 1/11 RTH low). Also 21day SMA on ES day session at 1266.68. GL
We got the reversal bar, looking for OR test at 1275 and then day session pivot at 1281.50.
Good eyes and sorry for not seeing this post earlier. Gaps in the data are my least favorite target as I have seen them fail the most. Although I do like to keep track of them . I still have one at 1219 I think and down at 1190 so trying hold for those would have been a mistake.
On this day here I would have prefered to see something else to go along with that gap or else I would have waited until we came back out of the 60 minute low. It's a good target as it is on a low so an obvious inflection point. If the weakness in the NQ can carry over into Monday then we should see that run out soon but not because of the gap in data. I guess many don't follow that idea...probably just as well then...thanks for the reply
On this day here I would have prefered to see something else to go along with that gap or else I would have waited until we came back out of the 60 minute low. It's a good target as it is on a low so an obvious inflection point. If the weakness in the NQ can carry over into Monday then we should see that run out soon but not because of the gap in data. I guess many don't follow that idea...probably just as well then...thanks for the reply
Originally posted by dutch
I noticed looking over everyones posts on todays price action (very informative) there was not one mention in regards to the 5min gap left from 11:30 to 11:35.
Question...being in a possible short term downtrend, would you look to this gap as a target,or would this gap have little or no influence in your planing.
Thanks
Emini Day Trading /
Daily Notes /
Forecast /
Economic Events /
Search /
Terms and Conditions /
Disclaimer /
Books /
Online Books /
Site Map /
Contact /
Privacy Policy /
Links /
About /
Day Trading Forum /
Investment Calculators /
Pivot Point Calculator /
Market Profile Generator /
Fibonacci Calculator /
Mailing List /
Advertise Here /
Articles /
Financial Terms /
Brokers /
Software /
Holidays /
Stock Split Calendar /
Mortgage Calculator /
Donate
Copyright © 2004-2023, MyPivots. All rights reserved.
Copyright © 2004-2023, MyPivots. All rights reserved.