ES short term trading 1-26-11
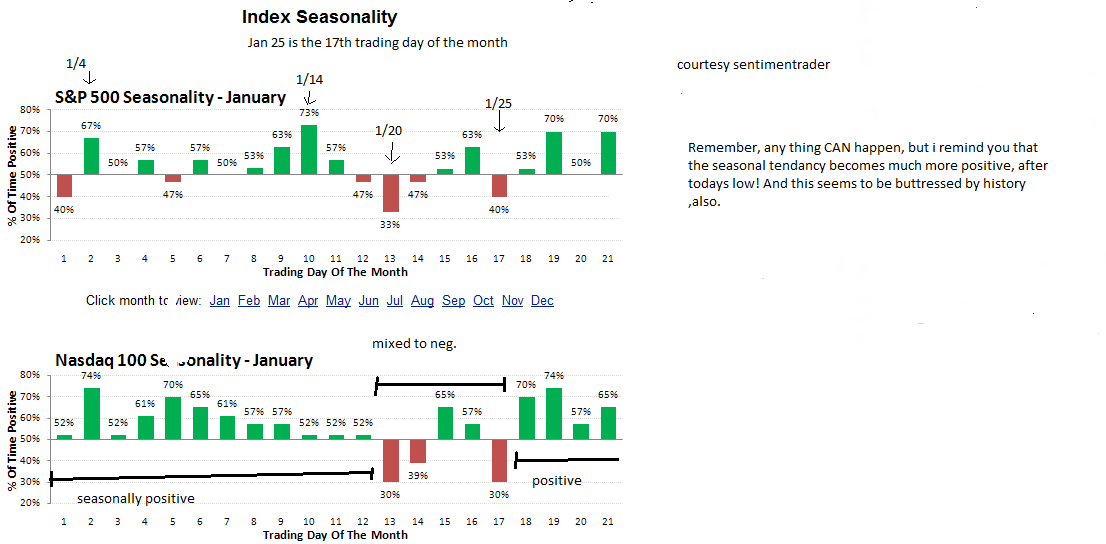
First, a quick, but important note. Ive been encouraged with all the views on this thread lately, but remember the reason i started it... so we can all learn from each other! Please dont be afraid to post trades, as long as the REASONING is also presented. Look, honestly, whether you make a good or bad call, or trade, really doesnt matter. We are more interested in the reasons and methods! Thats how we learn from each other!... now i'll stick my neck out first! ... So far the 'alternate' scenerio i presented on the weekend preview appears to be in force. (marginal new highs coming, then a big down turn!). Whether it turns out to be accurate is too soon to tell. I expect today to be somewhat boring sideways mish-mash (and difficult to trade beyond small scalps) untill the fed announcement at 2:15. As you may know, i base my 'alternate ' scenerio view mostly on seasonals (which turn positive for the rest of the week now, and historical considerations, for example, from Frank Hogelucht:the market "was trading at a higher level the session immediately following the State of the Union Addresses on 17 out of 20 occurrences (thereof the last 13). Chances for an +/- 1.0% change two sessions later (in this event on Wednesday, January 26) are 9 : 1 (9 occurrences with a 1.0%+ up-move, but only 1 occurrence with a -1.0%+ loss), and downside potential was regularly limited (except in 1931) over the course of the then following four sessions (the remainder of this week)." Note, my .line in the sand around 1265 or so ,to confirm a downtrend was never violated, so price action, for me is still bullish. However, i cant emphasise enough, that i expect a decent down turn very soon, for all the resons on the weekend preview!
Note, from yesterday,...
Click image for original size
... note also that the nas was up a larger % than the s&p yesterday, ie: leading on the upside rebound , which i deem as bullish.
for todays hoped for action, note the channels on the 30 min chart... i would think that they would contain todays action, at least, till the fed announcement....
Click image for original size
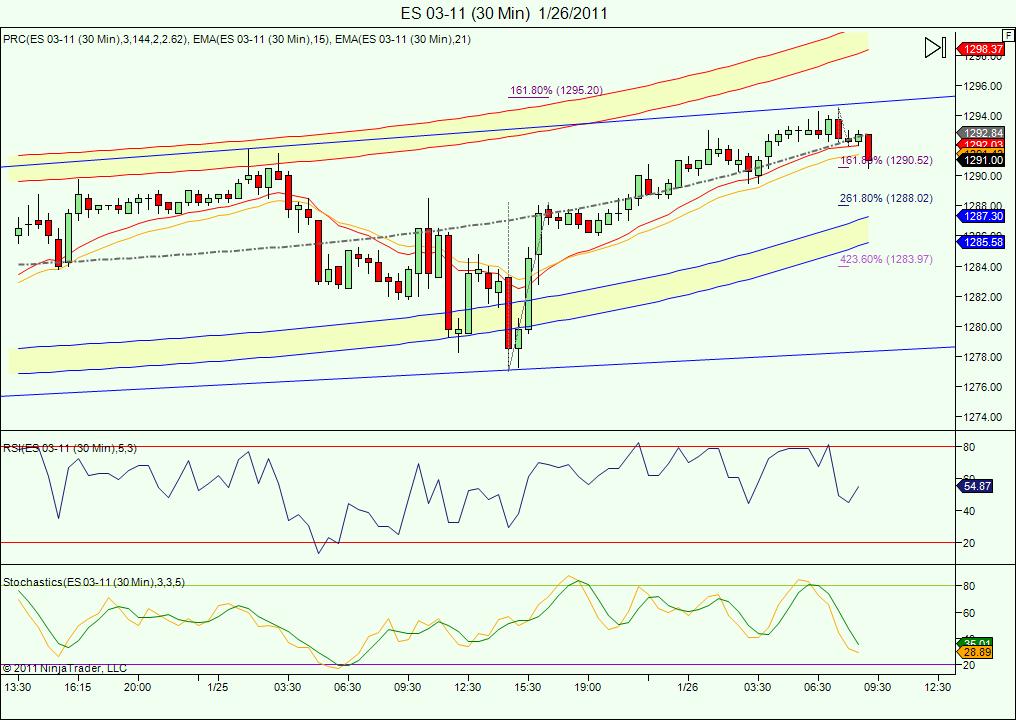
... it shows also the numbers i am watching especially on the downside.
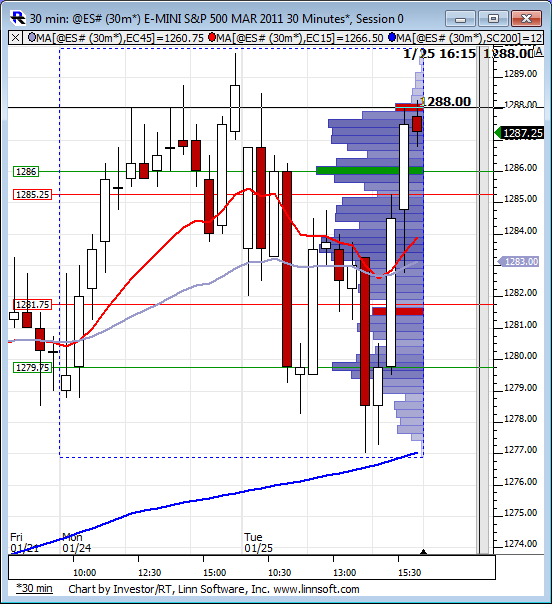
Profile for the developing week (RTH only). Some important zones on this chart namely 79.75 as major support and upper zones where a bunch of volume is spread around.
Click image for original size
I've laid out fairly specific ideas of the 'expected' action today and the rest of the week ,BUT, and this is important!. Any big deviation from that ,would indicate to me something important has started!... good trading all!.. just went long at 1290.75...
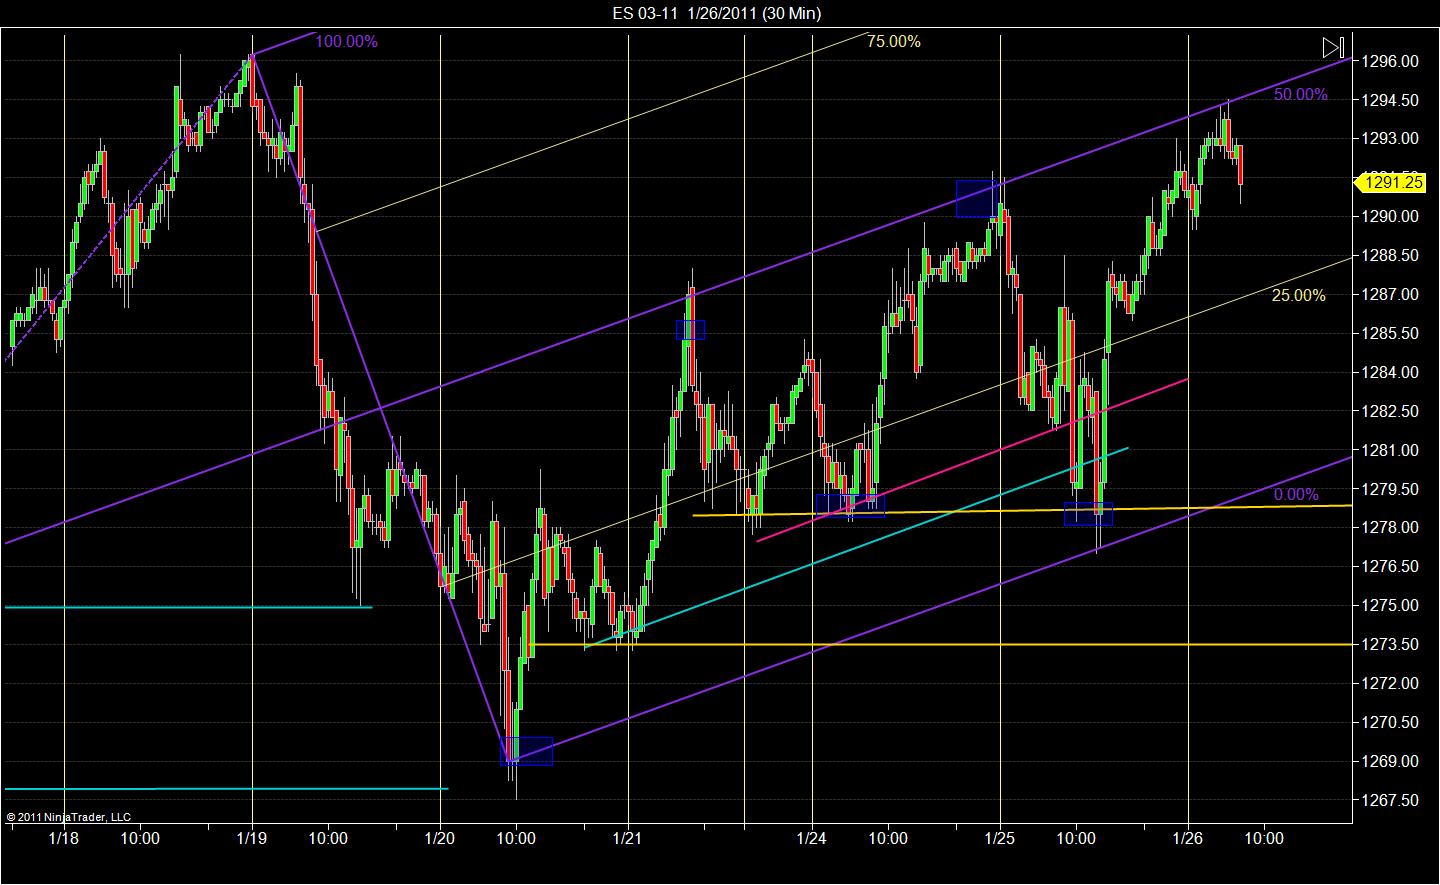
Here is the chart i use for analysis. It helps me locate a trend and possible turning points. AS you can see by the blue squares, once you fine the correct trend lines, you can make very inform and high probability trades.unfortunately, i usually go against what i see so i struggle with trusting my own analysis. I guess we all have our demons. i will use these lines until they become useless. I start with a long term chart, daily usually to get the long term trend and start refining it down from there until i get to a 30 minute chart which i like to trade from but i also use a 5 minute chart to refine the trade if possible which gets me into trouble more often than not. I also use a TPO chart for S/R lines and a VWAP during the day ( thanks to lorn). I also incorporate the fib projections which seems to fit with the pitchfork style perfectly( thanks to KOOL!!) I base my entries off simple market rules such as previous close, gaps, opening hour high low(taught by Bruce) and usually have a risk/reward of 3-1 or better. This room has become very important to my learning and has helped more than any other information source on the web. Kool, Lorn and Bruce, you guys are awesome and i thank you for all your help and advice and the work you guys put in everyday to teach all of us that come to this site.
this was a quick glimpse into my trading techniques. hope some of it is useful or at least entertaining. have a great trading day everyone!
this was a quick glimpse into my trading techniques. hope some of it is useful or at least entertaining. have a great trading day everyone!
Click image for original size
Interesting ,Optimus! Im going to study your chart when i get more time! for now, going below the 1290.50 level by a few ticks is ,to me, anin dication the market may want to proceed lower to the next number at 1288.00. for that reason, right or wrng im covering here at 1291.00
i was thinking the market to trade down to 88-87 to yesterday's close and then remain somewhat flat. so i am expecting a boring day but should be good for a few scalps
Have to agree with Kool on today's action. I have a 5 wave move completeted from 1267.50 to 1289.75 during RTH. This move was corrected yesterday down to 1277 and we are headed up in wave 3. I think we see a pullback this morning or into lunch hour that will allow for a buy in the 1284-1286 range. This coincides with the 3day pivot 1284.08 and its range of 1282.50 - 1285.58. I have a target of 1298.50 for today which is a weekly fib extension from the April '10 peak. We should see this late in the session after the FOMC minutes are released. GL today!
I'm using 92.25 based on O/N volume surges, the high of last week near 96.25 and that 87.50 too.....I prefer to be short for the gap fill unless we start getting closes above the O/N high on the 30 minute..then fades will be higer risk
Lots of good posts and ideas today... thx gang!..I will be in and out a lot today, but as it stands right now ,id be inclined to try a long scalp at 1288 or sell maybe at 1292.50 (currently the upper prc band on the 5 min chart..), but that could always change with price action!
eventually they decide that they have had enough of jerking it back and forth through the pre fed price...today it's 94.25.....and just keep moving it without returning...I don't want to get caught on the wrong side of that final move away from there
If I had to pick a direction it would be down but that is really only due to some minor weakness in NQ...not tradeable for me
they still can't get that close above 60 minute high....interesting so far
If I had to pick a direction it would be down but that is really only due to some minor weakness in NQ...not tradeable for me
they still can't get that close above 60 minute high....interesting so far
Emini Day Trading /
Daily Notes /
Forecast /
Economic Events /
Search /
Terms and Conditions /
Disclaimer /
Books /
Online Books /
Site Map /
Contact /
Privacy Policy /
Links /
About /
Day Trading Forum /
Investment Calculators /
Pivot Point Calculator /
Market Profile Generator /
Fibonacci Calculator /
Mailing List /
Advertise Here /
Articles /
Financial Terms /
Brokers /
Software /
Holidays /
Stock Split Calendar /
Mortgage Calculator /
Donate
Copyright © 2004-2023, MyPivots. All rights reserved.
Copyright © 2004-2023, MyPivots. All rights reserved.