ES short term trading 1-26-11
First, a quick, but important note. Ive been encouraged with all the views on this thread lately, but remember the reason i started it... so we can all learn from each other! Please dont be afraid to post trades, as long as the REASONING is also presented. Look, honestly, whether you make a good or bad call, or trade, really doesnt matter. We are more interested in the reasons and methods! Thats how we learn from each other!... now i'll stick my neck out first! ... So far the 'alternate' scenerio i presented on the weekend preview appears to be in force. (marginal new highs coming, then a big down turn!). Whether it turns out to be accurate is too soon to tell. I expect today to be somewhat boring sideways mish-mash (and difficult to trade beyond small scalps) untill the fed announcement at 2:15. As you may know, i base my 'alternate ' scenerio view mostly on seasonals (which turn positive for the rest of the week now, and historical considerations, for example, from Frank Hogelucht:the market "was trading at a higher level the session immediately following the State of the Union Addresses on 17 out of 20 occurrences (thereof the last 13). Chances for an +/- 1.0% change two sessions later (in this event on Wednesday, January 26) are 9 : 1 (9 occurrences with a 1.0%+ up-move, but only 1 occurrence with a -1.0%+ loss), and downside potential was regularly limited (except in 1931) over the course of the then following four sessions (the remainder of this week)." Note, my .line in the sand around 1265 or so ,to confirm a downtrend was never violated, so price action, for me is still bullish. However, i cant emphasise enough, that i expect a decent down turn very soon, for all the resons on the weekend preview!
thanks...that helps
Originally posted by WS
I took the trade because it bounced back from 1296.00 ( 1296.25 was 01/19/11's high) The 10min has a 1.618% at 1296.25 (missed by 0.25) with the 60m stoch in oversold, and the daily chart has a time fib. for today. So I gave it a shot.
Will see, ES trading 1291.75 @ 11:26Originally posted by BruceM
Did you take the trade because it was below the overnight high or was there another reason...? I guess my real question is that I'm wondering what your particular fade is based on in case I missed an area ...
Lets hope it keeps going for us all...I'm not sure they are gonna make this quick and easy for us but hope they do...single prints come into play down into the 91.50 area so 91.50 - 92.25 is a key area for me to see the next close pointOriginally posted by WS
great work guy's.
I think that today is the start of the down trend. For that the ES will need to stay below 1296.25 and will be a nice down trend for at list few days. I'm short at 1294.75 with stp at 1296.50. Looking for a retest of YD high and possibly PvP.
Will see if it give it to us. (I may pull out before the F's announcement)
ES trading 1293.00 11:01Originally posted by BruceM
selling 93.50 now....will add near O/N high...target is open print ...will watch that 10:30 close
Holy crap! i was filled after all at 1290.50!!! funny i didnt hear the fill which occurred as i was posting ..one off here at 1292.50 (i hope..not fille ... no there it is
stop moved to breakeven on the runner...
Originally posted by koolblue..."fwiw.. using candle bodies(high close to high close) would indicate a short term low coming on this 5 min bar which starts now...but we'll see "... Finally ,a little luck!
i have a buy (one only) at 1290.50...tho i suspect closer to 1287.25 before all is said and done....
Click image for original size

Flat now at the noon time close....one thing I am experimenting with Lorn is using the opening range as a filter but so far I haven't found that as reliable in relation to the 30 minute closes.
thanks for posting that chart....we could run a study to find out how many times in a row will a 30 minute close be above or below the previous 30 minute bars high or low...in the trend direction....could be interesting
thanks for posting that chart....we could run a study to find out how many times in a row will a 30 minute close be above or below the previous 30 minute bars high or low...in the trend direction....could be interesting
Originally posted by Lorn
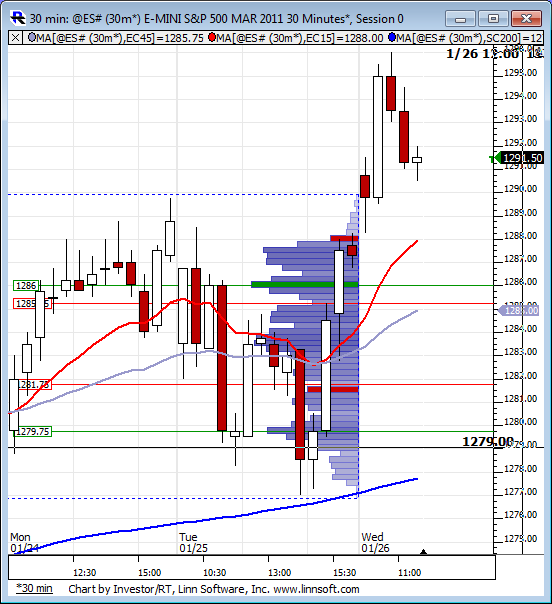
Here is the chart with 30 min closes...two lower closes from the high...can we get a third?
Originally posted by BruceM
for anyone who likes the 30 minute close idea this is probably a most important post...
By understanding what a trend trader would look for us faders can understand what we DON'T want to see on our trades.
I don't have time for a chart now but a trend trader would like the closes to keep getting higher. In relation to today they would be looking at the close outside of Yesterdays RTH first, then the close outside the Overnight, and then the close outside the 60 minute high and last weeks RTH high. What we want to see and come to expect as faders are reversals from those closes. And the "filling" in of the air pockets and single prints on the 30 minute and 5 minute time frames.
As I type we have closed back below the O/N high and the 60 minute high so that in theory is good for us shorts. Obviously we could get another reversal up on a close basis too.
So it is not perfect.
Let he whose method is without losses cast the first stone...
Don't worry, no preaching today...I'll spare you all that babble!
Click image for original size
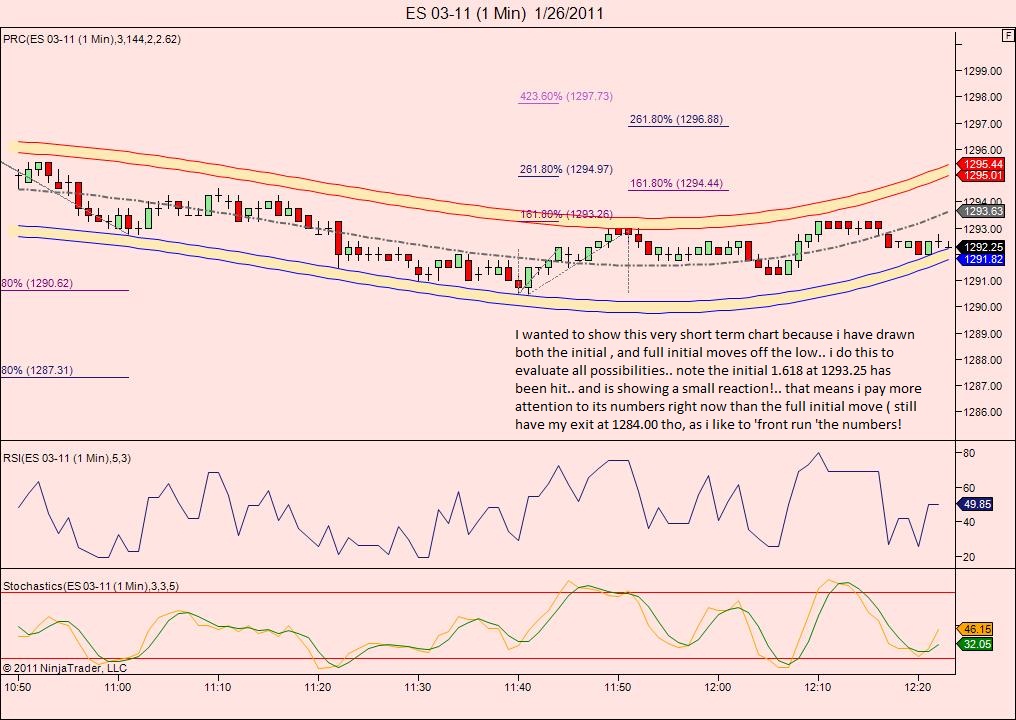
well, i ended up going in for 2 long at 1290.50 and offed one altho i'll probably get stopped on the other.. but if not i'll likely exit around 1284.00, looking for 1284.50-1285
nice fade kool!!
Originally posted by BruceMactually ,it was a bit lucky! both the fill, and i forgot to change the amount (which i have defaulted at 2 es). Sometimes i get too exited and trying to post while making and working a trade can lead to mistakes!.. in this case it worked in my favor! Still not sure why i didnt hear my fill? Lucky i checked my dom! at any rate the price target and cycle worked perfectly! lol
nice fade kool!!
Click image for original size
..Remember, as always, any touch of 1290.50 negates all these projections!
ok, my exit should come prtty soon.. at any rate, my stop has been raised to 1291.00 from entry as it is below the 12:20 low and below all median lines ,mov avg's ets on my 1,5 and 13 min charts....
eventually they decide that they have had enough of jerking it back and forth through the pre fed price...today it's 94.25.....and just keep moving it without returning...I don't want to get caught on the wrong side of that final move away from there
If I had to pick a direction it would be down but that is really only due to some minor weakness in NQ...not tradeable for me
they still can't get that close above 60 minute high....interesting so far
If I had to pick a direction it would be down but that is really only due to some minor weakness in NQ...not tradeable for me
they still can't get that close above 60 minute high....interesting so far
Emini Day Trading /
Daily Notes /
Forecast /
Economic Events /
Search /
Terms and Conditions /
Disclaimer /
Books /
Online Books /
Site Map /
Contact /
Privacy Policy /
Links /
About /
Day Trading Forum /
Investment Calculators /
Pivot Point Calculator /
Market Profile Generator /
Fibonacci Calculator /
Mailing List /
Advertise Here /
Articles /
Financial Terms /
Brokers /
Software /
Holidays /
Stock Split Calendar /
Mortgage Calculator /
Donate
Copyright © 2004-2023, MyPivots. All rights reserved.
Copyright © 2004-2023, MyPivots. All rights reserved.