ES short term trading 1-28-11
If you refer to yesterdays 9:16 post showing the projection off of the low, and the 9:36 post also i refer to the 1298.50 level.. it should come as no surprise that once again we just made a marginal new high at 1298.50 .. currently short from 1298.25 trying for 1295.50.... beyond that,my analysis of the last few days and weeks APPEARS TO BE IN FORCE, SO I WONT RE- HASH IT TODAY. The upper channel line i showed yesterday looks to be around 1301.50 currently. Still looking for sideways to up thru tues next week!
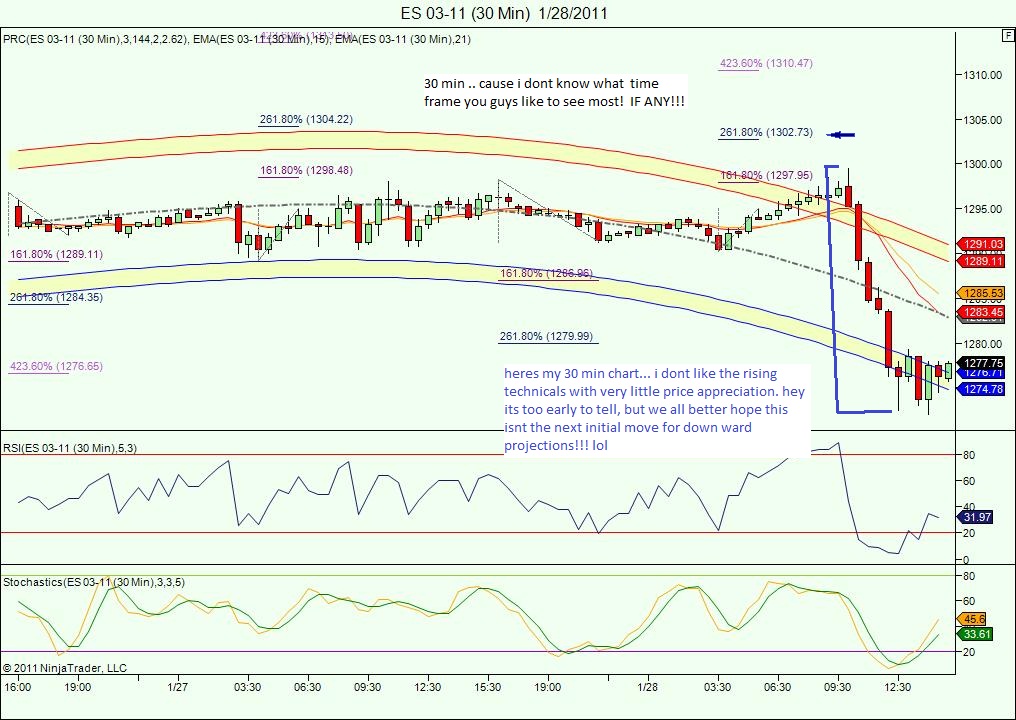
Click image for original size
I'm very sorry guys and gals Do I have to double explain my self in every post? Today's support or last low was at 1272.50. Even KoolB posted it! There is a cluster of fibs there for support! Man! put attention! So I try a trade from that area! Plus the small time frame Isolators where oversold at the time it hit the 1272.50 at 13:38 and 13:44.
This is real time posting and trading, You guys and gals have charts you are looking at. So, there should be some type of congruency with the posts you are reading.
Most people don't trade and post because it is very challenging to do the two.
Anyhow, see my post at 12:34. There I mentioned a possible test of today's low! What else do you like me to say? I don't use the sophisticated stuff you guys use, only use S/Rs and isolators.
My apologies if my posting isn't any good.......
Originally posted by BruceM
Hey WS..I'm getting tired of asking for some explanations to be honest....You get defensive when I do sometimes but what is your real point in posting if it isn't to help educate others? I know it takes more effort to post reasons and I don't think you just post out of ego although that is part of it for all who post on forums consistently...
I don't want to waste my eyes if I can't learn....if anyone agrees than please vote this post up and if I'm way off base then vote it down or tell us your thoughts here in the forum.
We are working hard not to have a forum that has posts with no logic....even if it is after the trade ( preferred actually) as one can take more time explaining..
I hope I'm not pissing some off!Originally posted by WS
Flat 1275.50 @ 14:17
Originally posted by WS
Moved stop up to 1274.50 and ready to get out if my indicators deteriorate before hitting the stop.
ES trading 1276.25 @ 14:08
Originally posted by WSRelax, man!.. were just trying to share ideas here(whether right or wrong!) Here's an example .. id like to see the trendline .Is it the same one i had posted, or different? And how do you get those targets? From the charts i showed ,or some similar method? or some completely different method? i dont see any chart reason to pick those. I ,for one, just want to learn! Im smart enough to know i dont know everything!!!
Notice that it's hitting the resistance trend line in the lower intraday charts. (10M.) @ 1277.00 or so.
1277.00 is a intraday S/R, so a test will take place here and possibly a test of the recent low 1272.50.
To the outside : Moving above 1277.00 and 1279.25, will target 1283.00 and 1287.00.
Moving below 1272.50 will void the above.
I'm currently flat and waiting for the proper set up.
ES trading 1277.25 @ 12:33
I guess if you are talking about smaller time frames and oscillators it would be nice to have some visuals and perhaps a "lecture" on how you synthesize all the data...what is "put attention" ?
I have found that by typing in stuff and explaining, it helps me reinforce my own ideas and trading. It may not help you to explain your ideas...I don't know...sometimes somebody puts forth a subtle distinction and interpretation of the ideas that changes things for me...a deeper sense of awareness of my own concepts
So we have an ongoing journal for ourselves too...perhaps you don't need that...if so then my question still stands as " what is the intent of the posts ?"
You can be honest here if the intent is just for ego stroking than that is ok...we just need to put things in perspective....By posting ideas it can help improve them too...
Kool. Don't you have a charting platform in front of you? Trace the line in a 10M chart! Ok, so I mentioned 1277.00 S/R, you guys will have something like S3 support @ 1276.50 That's very close in my book. Oh well, what can I say.........
Originally posted by koolblue
Originally posted by WSRelax, man!.. were just trying to share ideas here(whether right or wrong!) Here's an example .. id like to see the trendline .Is it the same one i had posted, or different? And how do you get those targets? From the charts i showed ,or some similar method? or some completely different method? i dont see any chart reason to pick those. I ,for one, just want to learn! Im smart enough to know i dont know everything!!!
Notice that it's hitting the resistance trend line in the lower intraday charts. (10M.) @ 1277.00 or so.
1277.00 is a intraday S/R, so a test will take place here and possibly a test of the recent low 1272.50.
To the outside : Moving above 1277.00 and 1279.25, will target 1283.00 and 1287.00.
Moving below 1272.50 will void the above.
I'm currently flat and waiting for the proper set up.
ES trading 1277.25 @ 12:33
Notice also on the last 30 min chart i posted the last little peak at 1279.25, then the decline to 1273.00 ,the red bar just to the right of the peak bar.. that projects a 1.618 at 1269.00 very close to the 1268.75 ive been showing on my other charts and timeframes... i just dont feel this 1272 level is 'the low' for this correction. But we'll see!
Originally posted by WSok , granted but why 1283 and 1287? Thats what im most interested in...
Kool. Don't you have a charting platform in front of you? Trace the line in a 10M chart! Ok, so I mentioned 1277.00 S/R, you guys will have something like S3 support @ 1276.50 That's very close in my book. Oh well, what can I say.........
Originally posted by koolblue
Originally posted by WSRelax, man!.. were just trying to share ideas here(whether right or wrong!) Here's an example .. id like to see the trendline .Is it the same one i had posted, or different? And how do you get those targets? From the charts i showed ,or some similar method? or some completely different method? i dont see any chart reason to pick those. I ,for one, just want to learn! Im smart enough to know i dont know everything!!!
Notice that it's hitting the resistance trend line in the lower intraday charts. (10M.) @ 1277.00 or so.
1277.00 is a intraday S/R, so a test will take place here and possibly a test of the recent low 1272.50.
To the outside : Moving above 1277.00 and 1279.25, will target 1283.00 and 1287.00.
Moving below 1272.50 will void the above.
I'm currently flat and waiting for the proper set up.
ES trading 1277.25 @ 12:33
Kool..I like the longer term which would be 15 minutes or more...but I enjoy looking at all your charts though and it's interesting how the smaller time frames intertwine with the longer ones..so if you got the time to post charts then I'm sure there are viewers for them.
Originally posted by koolblueyup!!!!
Notice also on the last 30 min chart i posted the last little peak at 1279.25, then the decline to 1273.00 ,the red bar just to the right of the peak bar.. that projects a 1.618 at 1269.00 very close to the 1268.75 ive been showing on my other charts and timeframes... i just dont feel this 1272 level is 'the low' for this correction. But we'll see!
Originally posted by BruceMno prob.. i
Kool..I like the longer term which would be 15 minutes or more...but I enjoy looking at all your charts though and it's interesting how the smaller time frames intertwine with the longer ones..so if you got the time to post charts then I'm sure there are viewers for them.
ll show them more often
A PICTURE IS WORTH A THOUSAND WORDS...I thought your chart looked "clean"..thanks for posting it
Emini Day Trading /
Daily Notes /
Forecast /
Economic Events /
Search /
Terms and Conditions /
Disclaimer /
Books /
Online Books /
Site Map /
Contact /
Privacy Policy /
Links /
About /
Day Trading Forum /
Investment Calculators /
Pivot Point Calculator /
Market Profile Generator /
Fibonacci Calculator /
Mailing List /
Advertise Here /
Articles /
Financial Terms /
Brokers /
Software /
Holidays /
Stock Split Calendar /
Mortgage Calculator /
Donate
Copyright © 2004-2023, MyPivots. All rights reserved.
Copyright © 2004-2023, MyPivots. All rights reserved.