ES Short Term Trading 01-31-2011
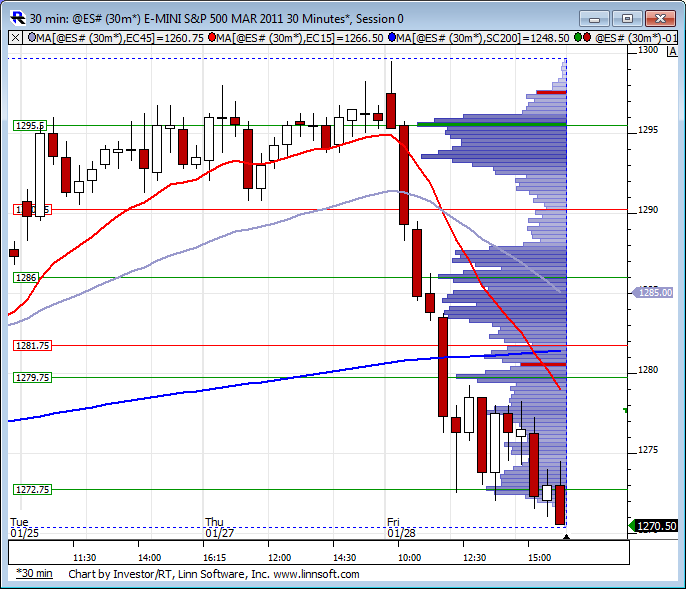
Here is last weeks profile to get is ready for the new week.
Click image for original size
Kool...I'm trying to remember what you told me about this concept in the past and that is about synchronizing time frames...
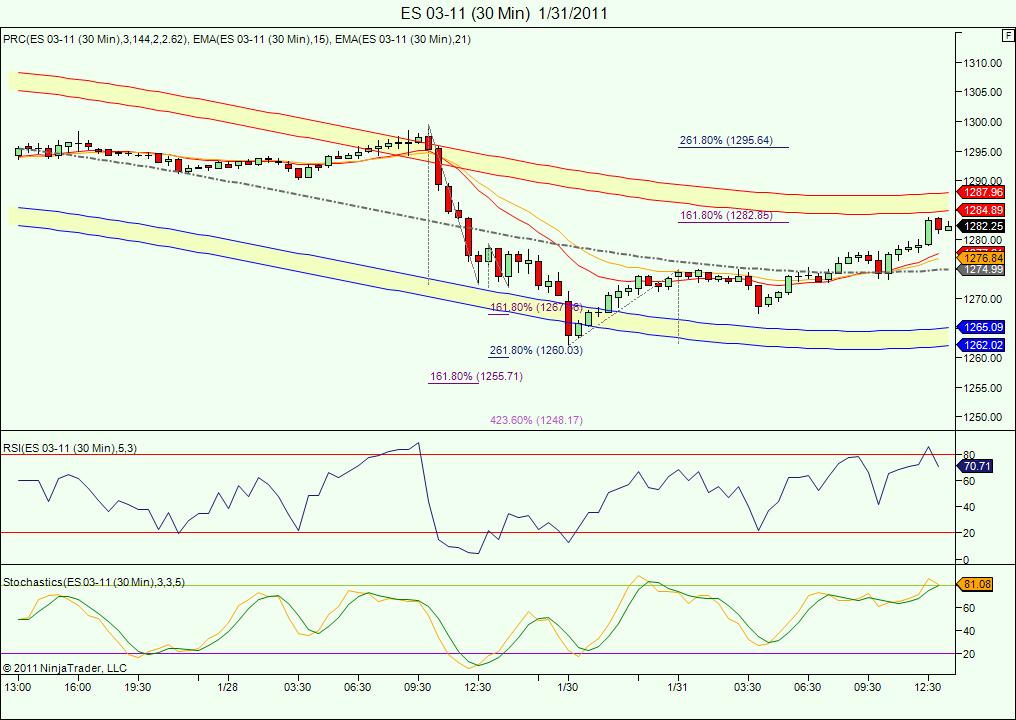
If we take that O/N low at the 1262 area up to the swing high in O/N at 1274.50 we get a 1.62 projection up to 1282 area...so what will negate the 2.62 from hitting today..or actually any day going forward from here?
I guess what would you need to see in order to invalidate that longer term projection....I get messed up when I look at this and incorporate multiple time frame..Are there some quick and dirty rules or a link where you have explained it somewhere...?
I know you aren't feeling 100% so when you have a chance and are up to it, i'd appreciate it
and add on to my question is : what kind of down impulse will we need to see that will make you change an opinion on a longer time frame move..?
UGH!! triples and quads forming...I'm starting to dislike them because they are forming TOO much....this low volume rally since the November lows has brought on too many...
Best we can hope for in this situation is a drive up that takes out the quads and the current RTH high into the 84 - 85 area and then rolls over to get the triples at 81 area...
Best we can hope for in this situation is a drive up that takes out the quads and the current RTH high into the 84 - 85 area and then rolls over to get the triples at 81 area...
FWIW - THE nq has yet to trade below a previous 30 minute low today in RTH...so they will need a test soon I would think
Originally posted by BruceMgood question...observe the 30 min chart...of course, we have hit (and excedded the 1.618 as you pointed out.. and as you correctly suppose, the odds now favor the 2.618 being achieved. Im of the opinion that wont be untill tomorrow tho, since i have 2 different cycles that pinpoint tues as a cycle turn day... course anything can happen. as far as when i would suspect that would not be the case and instead we head back down, if we would have fallen just shy of the 1.618 (hence my short at 1282.00) ,i would have felt better about that outcome,as im already on record as saying that on low of 1262.25 is not anywhwere in my work as a possible end of the correction that started at 1299.50. Beyond that i dont have any hard rules as when to suspect the 1.618 is all we get, except as you pointed out, cross referencing with the shorter term charts and seeing for instance if 2.618's are hit more often on the downside or upside... Hope that helps answer your question..
Kool...I'm trying to remember what you told me about this concept in the past and that is about syncronizing time frames...
If we take that On low at the 1262 area up to the swing high in O/N at 1274.50 we get a 1.62 projection up to 1282 area...so what will negate the 2.62 from hitting today..or actually any day going forward from here?
I guess what would you need to see in order to invalidate that longer term projection....I get messed up when I look at this and incorporate multiple time frame..Are there some quick and dirty rules or a link where you have explained it somewhere...?
I know you aren't feeling 100% so when you have a chance and are up to it, i'd appreciate it
Click image for original size
To add to Kool's comments.
Any projection off a major pivot is only invalidated when the originating pivot is taken out.
However, discretion of the trader certainly comes into the equation as time and price develops away from the originating pivot and evidence builds towards a take out of that originating pivot.
Any projection off a major pivot is only invalidated when the originating pivot is taken out.
However, discretion of the trader certainly comes into the equation as time and price develops away from the originating pivot and evidence builds towards a take out of that originating pivot.
Originally posted by BruceM
Kool...I'm trying to remember what you told me about this concept in the past and that is about synchronizing time frames...
If we take that On low at the 1262 area up to the swing high in O/N at 1274.50 we get a 1.62 projection up to 1282 area...so what will negate the 2.62 from hitting today..or actually any day going forward from here?
I guess what would you need to see in order to invalidate that longer term projection....I get messed up when I look at this and incorporate multiple time frame..Are there some quick and dirty rules or a link where you have explained it somewhere...?
I know you aren't feeling 100% so when you have a chance and are up to it, i'd appreciate it
Note the cycle ...turn point at this 30 min bar ,1:30-2:00. The shorter term charts have it closer to 2:00
Click image for original size


Hi Bruce, Thanks again for your input. This may be a little wordy, but this should give an indication of the 'fade the first move by a Fibonacci of the Stretch calculation and applying that price rotation to the formula (3, -1). The -1 is the counter trend 'fade' price move. I am looking forward to your shared mutual interests.
YMH1: Sold short in 1st minute: 11753. Reversed at 11698 and offset the long at 11638 (1.618% bounce off the low).(Rational: Settlement: 11775- 2.618% of today's Stretch (26 x 2.618=68. 11775-68= 11707. Friday's last trade was 11762 -68=11694. Friday's settlement: 11775-68=11707 or 11751-68=11683. Average of the three projected a low=11694. Tonight's low is 11690. Prices bounced back to unchanged and filled the gap. January 31
YMH1: Applying the (3, -1) formula to the strategy that trades from unchanged and fades the first move by today's Stretch calculation, 21. Previous settlement lifted up to the high, i.e, 11930+21=11951 and reversed back to unchanged. Prices fell below unchanged by 63 pts, i.e., 11930- (3x21)= 11967. 11964 = low.
Another nearly perfect fit. 25 January 12:44PST
YMH1 strategy; price rotations basis 1.618% and 2.618% of today's Stretch calculation, 24=X. 1.618X=38 and 2.618X=38: Trading from unchanged, 11822 lifted 50% of 24 and failed 11838 to 11806 reversing to 11870 (1st high ... 11806+64=11870= +2.618X +2pts). 11870 fell to 11808=62pts=2.618X. Unchanged + 4.25% of X=11924=11822+102=11924. High:11936. 24 January 12:34PST
Basis YMH1: Trading from unchanged and fading the first move by today's Stretch (26=X) calculation and applied to the (3, -1) formula, satisfied this formula and range projection within a small margin of error, 3 pts above the low and 5 pts below the high. 11774-X=11748 11745=low). 11774+ (3x26)=11852. High-low=112 pts, i.e., 11857-11745=112. 110=4.25% of today's Stretch, 26, calculation.
21 January 16:12PST
I'm sick in the head (lol) and going back to bed.
Take a look at the March $5 Dow intra-day chart. The trading strategy is to fade the first move, e.g., when it is counter-trend. The first move was down almost 1.618% of today's Stretch calculation (25), and then reversed, from unchanged, three of today's Stretch calculations. This fit...s the (3, -1) formula.
18 January 14:13PST
YMH1, Trading from unchanged; fading first move as applied to (3, -1) formula,; Stetch calculation =24=X, 1.618X=38, 2.618X=62 and 4.25X=102: Unchanged, 11683+Stretch, 24=11683+24=11707. At 11708 reversed in the early A session. 11708- (24x3)=11636=11707-72=11636. 11627, 14 Jan low reversed up to 11740. The low 11627 + 4.25X= 11729, i.e., 11627 + 102 = 11729. Prices have started a retraceal lower from the 11740 high. 14 January 12:07
Emini Day Trading /
Daily Notes /
Forecast /
Economic Events /
Search /
Terms and Conditions /
Disclaimer /
Books /
Online Books /
Site Map /
Contact /
Privacy Policy /
Links /
About /
Day Trading Forum /
Investment Calculators /
Pivot Point Calculator /
Market Profile Generator /
Fibonacci Calculator /
Mailing List /
Advertise Here /
Articles /
Financial Terms /
Brokers /
Software /
Holidays /
Stock Split Calendar /
Mortgage Calculator /
Donate
Copyright © 2004-2023, MyPivots. All rights reserved.
Copyright © 2004-2023, MyPivots. All rights reserved.