ES Short Term Trading 01-31-2011
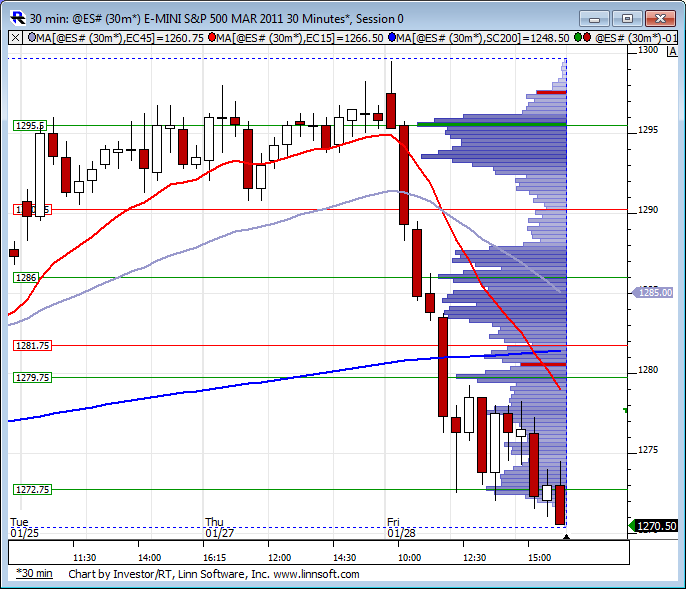
Here is last weeks profile to get is ready for the new week.
Click image for original size
thanks I'll need to study the charts again later...Lorn , u r saying that the only way we know that we aren't going to hit the 2.62 is if we trade below the 1262....I get that...
I just think there must be some way to qualify a move in the opposite direction ...in this case down that would tell us with good odds that the 2.62 is not going to be hit and that the 1262 will trade again....
Ideally this would happen long before we are even close to the 1262 area again...
I'll need to revisit this later...thanks again to you both
we've had multiple closes near this 79 area today...so that is the area for the close players to overcome ..if we get a 3 pm close under 79 then that will not be good for the long view as they are accepting prices below the single prints and the key areas by having two closes down there....
confusion has me sidelined again as we have those quads and a crummy high and triples above...
when in doubt, sit it out
confusion has me sidelined again as we have those quads and a crummy high and triples above...
when in doubt, sit it out
I'm not big on hard fast rules when it comes to trading. Any trader who sticks around long enough will eventually witness every so called rule broken.
I think Kool has a good grasp on what to look for in terms of projections themselves giving clues to when a larger projection might be failing.
The 1.618 projection is most commonly the resistance level in corrections of a trend, so when we see projection's start to consistently hit 2.618 and even higher levels in the opposite direction of the larger projection being used, a crack in the trend of the larger projection is beginning to show up.
Other evidence such as volume, VWAP, CD and the like help determine when a projection is failing but require experience in those areas.
Originally posted by BruceM
thanks I'll need to study the charts again later...Lorn , u r saying that the only way we know that we aren't going to hit the 2.62 is if we trade below the 1262....I get that...
I just think there must be some way to qualify a move in the opposite direction ...in this case down that would tell us with good odds that the 2.62 is not going to be hit and that the 1262 will trade again....
Ideally this would happen long before we are even close to the 1262 area again...
I'll need to revisit this later...thanks again to you both
78.50 is also the 50 % mark for the day so this 3 pm close will be fun to watch..don't want the close to be down there..if u r long...just not sure how these folks take trades inside a range...I find it difficult but that's what makes trading so cool,,,,,
for me trading on the fringe of ranges is my comfort level..to others they enjoy the warm safe place of a nice cozy range...this way the market won't run away from them too fast...
Love this stuff..never two days the same...I'd perish at a regular job!!
for me trading on the fringe of ranges is my comfort level..to others they enjoy the warm safe place of a nice cozy range...this way the market won't run away from them too fast...
Love this stuff..never two days the same...I'd perish at a regular job!!
close theory would have that as a good close and on our way to make new highs...lets see how much theory goes with reality.....only thing that would negate that now is another bad close below 78.50 - 79 at 3:30...
Bruce,
I've been an intra-day equity index trader since 1984, and have been fading the first move since the early 1990s. I don't use Fibonacci ratios intra-day. However, I do use Fibs of the Stretch calculations, e.g., 1.618%, 2.618% and 4.25%, with extraordinary success that fits the (3, -1) formula, i.e., -1 representing the first move that is faded, followed by a reversal back to unchanged and three more (sometimes from the low +3). Today's crisis in Egypt projected a 2.618% low reversal (11707 where the 31 January low printed at 11690) quite accurately. Do you follow this strategy (if not enjoy)? My point, if you do follow this strategy, do you have any data that suggests an extended follow through, i.e., 2.618% three times (today's 11690 +68x3)=11894, with a follow through of an additional 100-150 points before a pullback, which would change the fade the first move to fade the last move. This looks like the (3, -1) pattern could change from fade the early session move to fade the late session move. Note: The $5 Dow futures have produced a margin of error reflecting better than 3:1 reward : risk ratios most days, i.e., within a few ticks for these reversal levels.
Do you have any back data for this strategy that I am applying? I'll swap thoughts if you do. Thanks for your shared mutual interests.
Sorry Hunter I don't follow this but it sounds interesting. I have noticed your posts in the other thread too. To be honest I find it hard to follow without charts and having the math spelled out in a form my 3rd grader can understand. Do you have some examples of the calculations or could you do a thread for the emini S&P ? It would be cool to see the numbers before the RTH open and really understand how they are derived.
Lorn and Kool have a super handle on the 1.62 and 2.62 extensions...
I'm probably asking a lot but perhaps you'd like to post the numbers in the AM in the daytrading thread here with the logic and areas to participate.
Lorn and Kool have a super handle on the 1.62 and 2.62 extensions...
I'm probably asking a lot but perhaps you'd like to post the numbers in the AM in the daytrading thread here with the logic and areas to participate.
small short started from 88.25 this morning....good odds for a gap fill today...market is up 5.5 points....will manage only on a close above the current overnight highs on 30 minute
real resistence sits up at the 93.50 - 95 area today ....need a new thread later..too early for this
Hi Bruce, Thanks again for your input. This may be a little wordy, but this should give an indication of the 'fade the first move by a Fibonacci of the Stretch calculation and applying that price rotation to the formula (3, -1). The -1 is the counter trend 'fade' price move. I am looking forward to your shared mutual interests.
YMH1: Sold short in 1st minute: 11753. Reversed at 11698 and offset the long at 11638 (1.618% bounce off the low).(Rational: Settlement: 11775- 2.618% of today's Stretch (26 x 2.618=68. 11775-68= 11707. Friday's last trade was 11762 -68=11694. Friday's settlement: 11775-68=11707 or 11751-68=11683. Average of the three projected a low=11694. Tonight's low is 11690. Prices bounced back to unchanged and filled the gap. January 31
YMH1: Applying the (3, -1) formula to the strategy that trades from unchanged and fades the first move by today's Stretch calculation, 21. Previous settlement lifted up to the high, i.e, 11930+21=11951 and reversed back to unchanged. Prices fell below unchanged by 63 pts, i.e., 11930- (3x21)= 11967. 11964 = low.
Another nearly perfect fit. 25 January 12:44PST
YMH1 strategy; price rotations basis 1.618% and 2.618% of today's Stretch calculation, 24=X. 1.618X=38 and 2.618X=38: Trading from unchanged, 11822 lifted 50% of 24 and failed 11838 to 11806 reversing to 11870 (1st high ... 11806+64=11870= +2.618X +2pts). 11870 fell to 11808=62pts=2.618X. Unchanged + 4.25% of X=11924=11822+102=11924. High:11936. 24 January 12:34PST
Basis YMH1: Trading from unchanged and fading the first move by today's Stretch (26=X) calculation and applied to the (3, -1) formula, satisfied this formula and range projection within a small margin of error, 3 pts above the low and 5 pts below the high. 11774-X=11748 11745=low). 11774+ (3x26)=11852. High-low=112 pts, i.e., 11857-11745=112. 110=4.25% of today's Stretch, 26, calculation.
21 January 16:12PST
I'm sick in the head (lol) and going back to bed.
Take a look at the March $5 Dow intra-day chart. The trading strategy is to fade the first move, e.g., when it is counter-trend. The first move was down almost 1.618% of today's Stretch calculation (25), and then reversed, from unchanged, three of today's Stretch calculations. This fit...s the (3, -1) formula.
18 January 14:13PST
YMH1, Trading from unchanged; fading first move as applied to (3, -1) formula,; Stetch calculation =24=X, 1.618X=38, 2.618X=62 and 4.25X=102: Unchanged, 11683+Stretch, 24=11683+24=11707. At 11708 reversed in the early A session. 11708- (24x3)=11636=11707-72=11636. 11627, 14 Jan low reversed up to 11740. The low 11627 + 4.25X= 11729, i.e., 11627 + 102 = 11729. Prices have started a retraceal lower from the 11740 high. 14 January 12:07
Emini Day Trading /
Daily Notes /
Forecast /
Economic Events /
Search /
Terms and Conditions /
Disclaimer /
Books /
Online Books /
Site Map /
Contact /
Privacy Policy /
Links /
About /
Day Trading Forum /
Investment Calculators /
Pivot Point Calculator /
Market Profile Generator /
Fibonacci Calculator /
Mailing List /
Advertise Here /
Articles /
Financial Terms /
Brokers /
Software /
Holidays /
Stock Split Calendar /
Mortgage Calculator /
Donate
Copyright © 2004-2023, MyPivots. All rights reserved.
Copyright © 2004-2023, MyPivots. All rights reserved.