ES Short Term Trading 02-10-2011
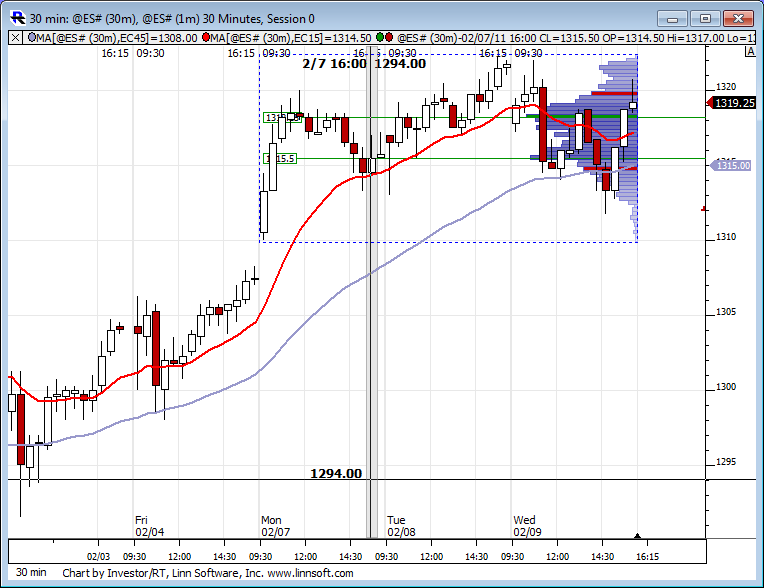
Here we are again. Like deja vu from yesterday. Notice the weekly profile still sporting the bell curve shaped profile. As Bruce said yesterday, it was a neutral day. That curve proves it, even with the wild up down moves in price. And I also think this shows true trending action happens even less then 20% of the time as Bruce and others have mentioned. I recall the great Paul Tudor Jones in Market Wizards stating trending action happens less then 15% of the time so he always wanted to fade new highs and lows.
Click image for original size
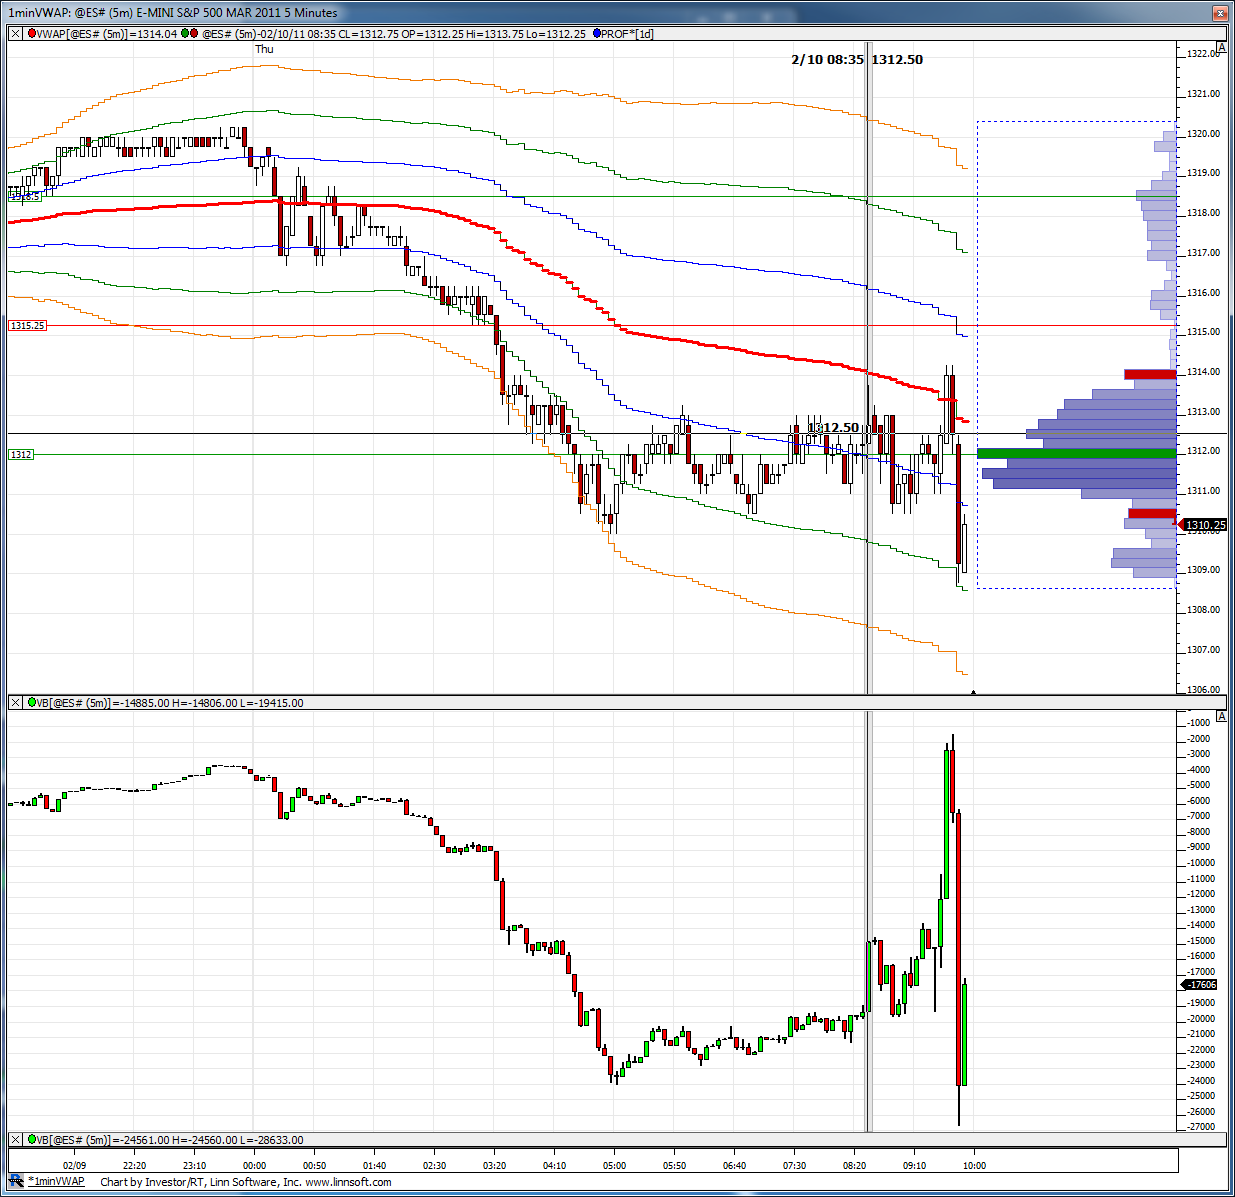
Here is the O/N profile. Lots of volume coming in here at this bottom range.
Click image for original size
Thought everyone might find this chart quite enlightening...
Click image for original size
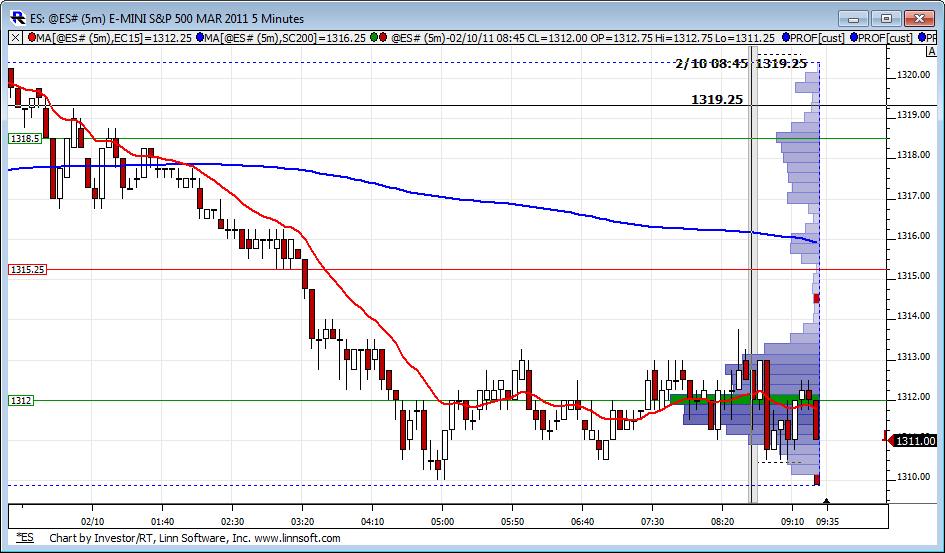
so we get a close only one tick below YD RTH low but they are unable to close it below the O/N low....and so far that has led to buying...and based on your CD chart Lorn, they were unable to get a 30 minute close below the O/N low in CD too....I think!!
A very common price close pattern that happens when reports fire off into the market
I have 1315 a a key volume price based on one minute volume....from yesterday
A very common price close pattern that happens when reports fire off into the market
I have 1315 a a key volume price based on one minute volume....from yesterday
That is correct Bruce.
Originally posted by BruceM
so we get a close only one tick below YD RTH low but they are unable to close it below the O/N low....and so far that has led to buying...and based on your CD chart Lorn, they were unable to get a 30 minute close below the O/N low in CD too....I think!!
A very common price close pattern that happens when reports fire off into the market
I have 1315 a a key volume price based on one minute volume....from yesterday
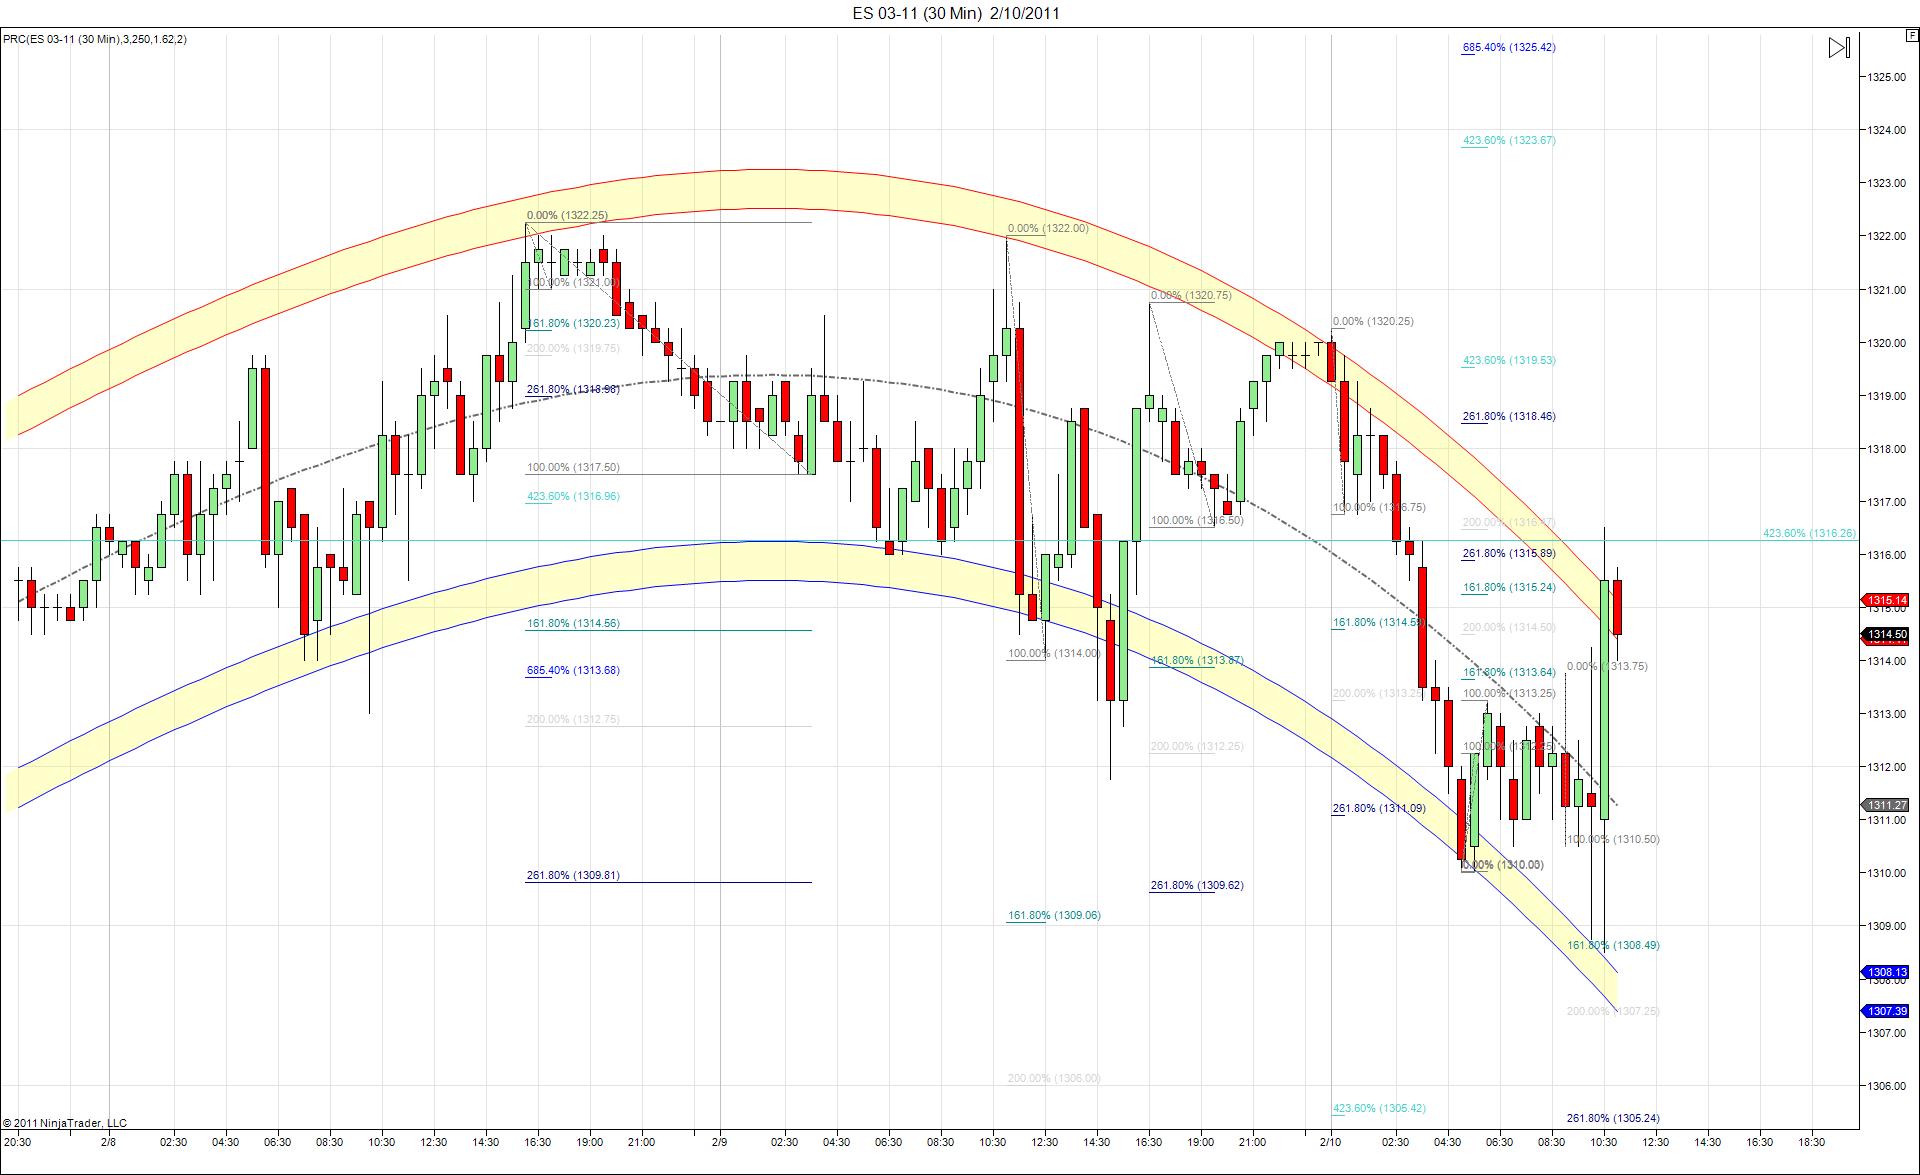
Here is a 30 min fib projection chart. You can see all the confluence showing up down in the 1308.50-1309.75 area.
Click image for original size
I'm not gonna ramble too much about this today but the folks who are buying the hour high breakout for the gap fill want to see a close outside the IB high and us faders want to see a close back inside that range....
Let me reiterate that this would be the ideal situation in order to hold runners for longer targets if you were using the method as a mechanical idea.
As day traders we don't want to throw all caution to the wind either...and obviously we wouldn't want to see new highs especially since that gap looms above and they seem to be accepting that 1315 volume from yesterday..
let the battle of the closes begin.....
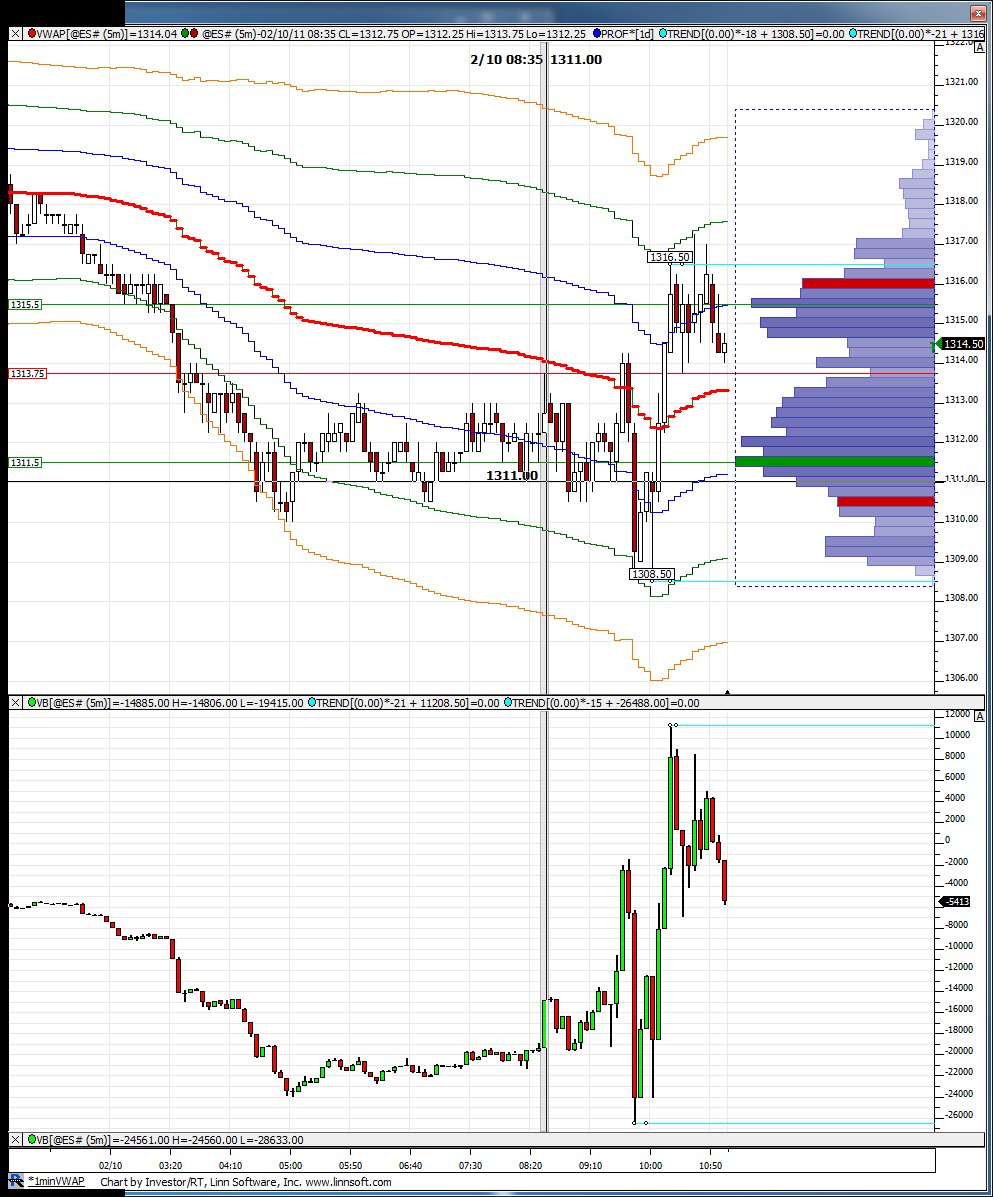
Adding to what Bruce is saying here is VWAP chart and I have marked the 1st hour high and low both on price and on the CD. You can see the divergence at the high suggesting higher prices for now might be more challenging.
Click image for original size
Originally posted by LornGreat work, Lorn! Finally someone who appreciates the real magic of Kools tools projections! I had an order in at 1309.50 this morning about 4:00 am as a result, hoping to get hit and place a stop and just go to bed! Well, we hit 1310.00 and began to rebound. I had a big thing all typed for the thread showing the same exact projections (1309.00-1309.75)and reasons(like todays positve seasonality ,etc,)you had to buy it! By this time the market had already rebounded to around 1312 and i thought it could take forever, so i cancelled my order and went to bed! Too bad, that was the buy of the day! It looks like the thread is in good hands with your excellant work!..Kudos!
Here is a 30 min fib projection chart. You can see all the confluence showing up down in the 1308.50-1309.75 area.
Click image for original size
Short from 1318.50...
I have my eyes on a 13.75 retest....hopefully we won't get too much trouble at that hour high....ideal would be to close back below now that gap is filled..
Hey Joe, can you pop up some charts for us when u have time..? I'd like to see those....thanks
Originally posted by CharterJoe
Originally posted by sij
may iask > that prc bands on kool's graphs are these the same as cog?
No there not the same I personally like starc bands better 15/144/2.618 on a 1min time frame....
Emini Day Trading /
Daily Notes /
Forecast /
Economic Events /
Search /
Terms and Conditions /
Disclaimer /
Books /
Online Books /
Site Map /
Contact /
Privacy Policy /
Links /
About /
Day Trading Forum /
Investment Calculators /
Pivot Point Calculator /
Market Profile Generator /
Fibonacci Calculator /
Mailing List /
Advertise Here /
Articles /
Financial Terms /
Brokers /
Software /
Holidays /
Stock Split Calendar /
Mortgage Calculator /
Donate
Copyright © 2004-2023, MyPivots. All rights reserved.
Copyright © 2004-2023, MyPivots. All rights reserved.