ES Short Term Trading 02-10-2011
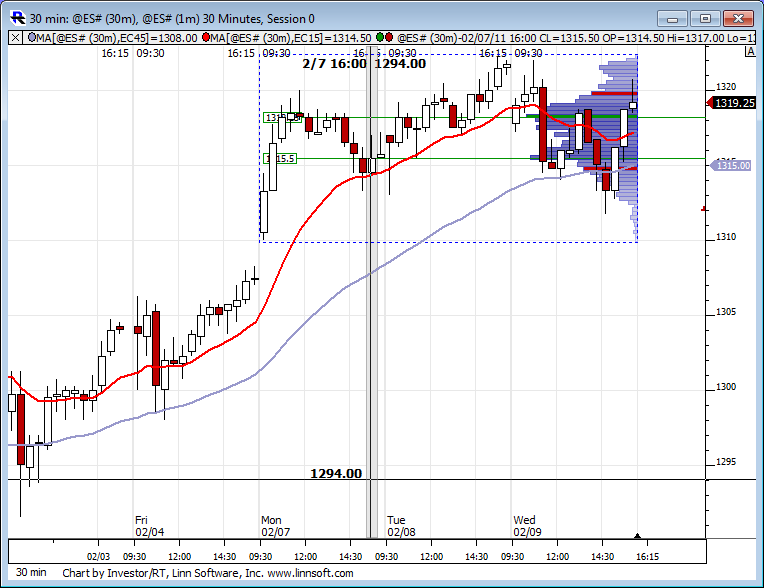
Here we are again. Like deja vu from yesterday. Notice the weekly profile still sporting the bell curve shaped profile. As Bruce said yesterday, it was a neutral day. That curve proves it, even with the wild up down moves in price. And I also think this shows true trending action happens even less then 20% of the time as Bruce and others have mentioned. I recall the great Paul Tudor Jones in Market Wizards stating trending action happens less then 15% of the time so he always wanted to fade new highs and lows.
Click image for original size
I wonder if a rate of change "indicator".... yes I said that word..INDICATOR would help filter signals between CD and the ES.....perhaps when they both flip may provide a good signal as the divergences don't always come.....just an idea.....not very well versed in indicators...
Originally posted by Lorn
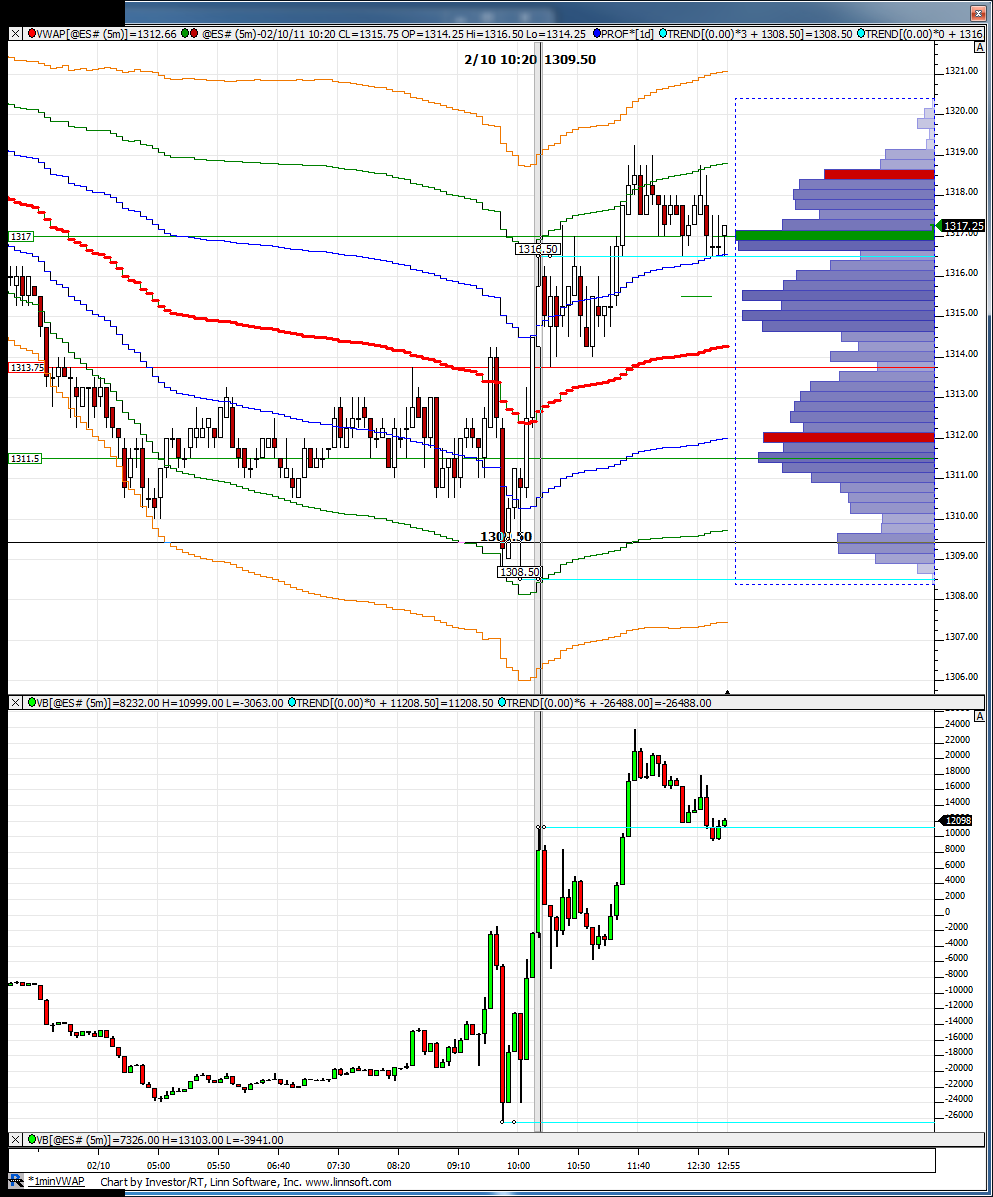
You can see Bruce as per CD they are trying to support the break out.
Originally posted by BruceM
I was really hoping those hour high players would just step aside and let my short do it's job...HA!!
Click image for original size
Originally posted by koolblue
well, this is the second(and larger ie:more important cycle turn) turning point . I'm hoping it turns out to be a high.The charts all look so dam bullish i'm getting worried as i want to be long ,but we'll see
Click image for original size
well they sure seem to be having trouble maintaining trade outside the hour high now..NQ finally gets a close below it's hour highs....
can't chase...I missed my entry!
can't chase...I missed my entry!
Spot on!
Originally posted by BruceM
can't chase...I missed my entry!
I think the "P" pattern in mp is one of the hardest to trade WHILE it's forming.....we trended up, to create the stem of the "P" and then the consolidation comes.....creating the fat part of the "P"....so if you miss the fade and don't sell the rallies then you become a breakout trader and would have to sell on the decline which I can't do beacuse they just might bring it back up into the center of that consolidation....
Where is my Johnny Walker when I need it ????
Where is my Johnny Walker when I need it ????
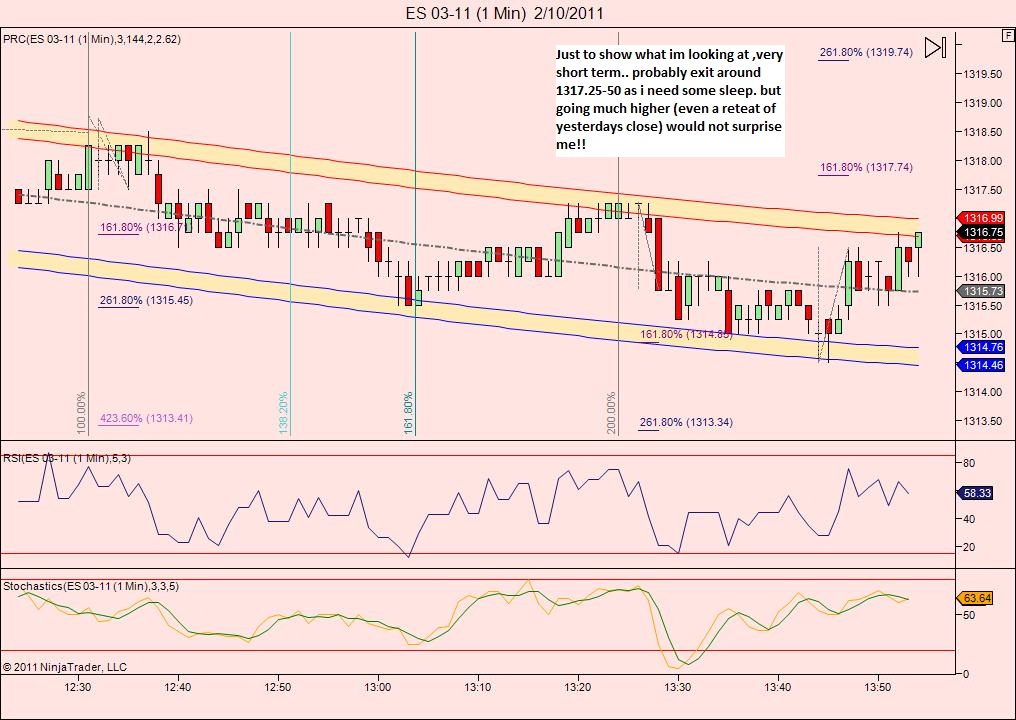
Originally posted by koolblue"I still think it might! I just want to try a long around that 1313.25-1314.75 zone!"..."i have a little cycle turn coming at about 1:10 and another possible around 1:30 "..."And that print of 1316.25 is price action re-inforcing my view (of a move to 1314.75 or so) I hope!lol "... Finally, now please Lord, dont take it down to 1313.25-50
Originally posted by koolblueIm just looking for a small re trace hereto 1314.50-1316 area... longs are preferred today...
Short from 1318.50...
Took one off at 1316.75 for 2 more handles in the bank! holding the runner and stop to 1314.50... having a good day!
Nice one Kool!!
Originally posted by BruceMThx friend ..i really nailed it today...
Nice one Kool!!
Click image for original size
they just can't get it closed back outside that hour high for anyone watching in their spare time..
I certainly hope it keeps going up for you Kool but I just hate that ledge at 1314.....they should need to test above a previous 30 minute high now and triples above but I'm frozen...good for u though!!
I certainly hope it keeps going up for you Kool but I just hate that ledge at 1314.....they should need to test above a previous 30 minute high now and triples above but I'm frozen...good for u though!!
Hey Joe, can you pop up some charts for us when u have time..? I'd like to see those....thanks
Originally posted by CharterJoe
Originally posted by sij
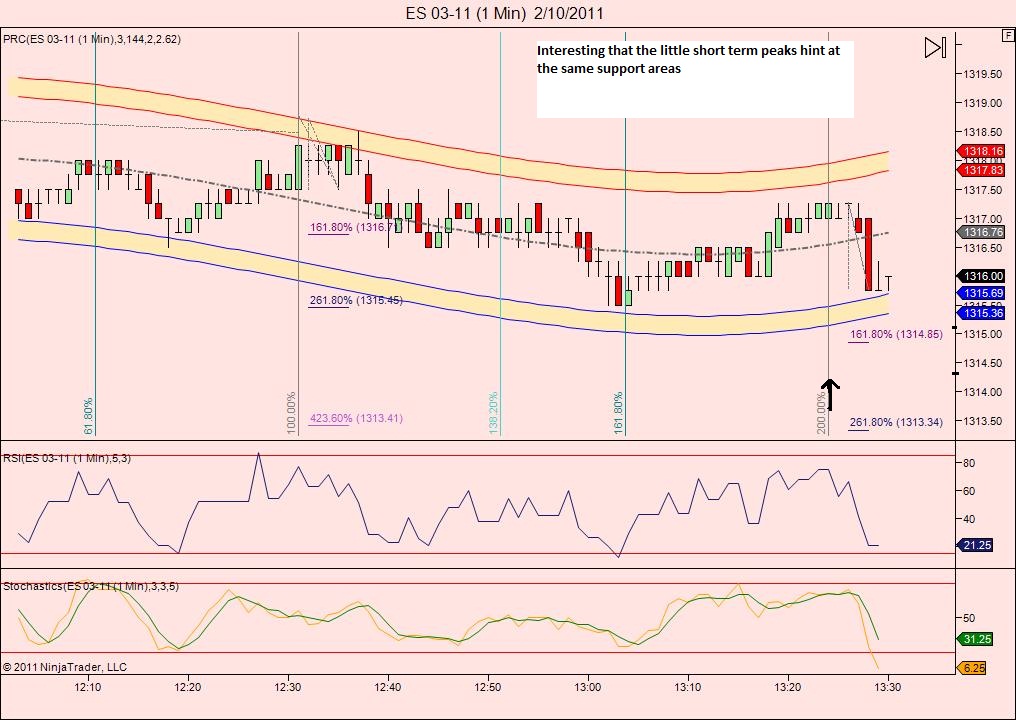
may iask > that prc bands on kool's graphs are these the same as cog?
No there not the same I personally like starc bands better 15/144/2.618 on a 1min time frame....
Emini Day Trading /
Daily Notes /
Forecast /
Economic Events /
Search /
Terms and Conditions /
Disclaimer /
Books /
Online Books /
Site Map /
Contact /
Privacy Policy /
Links /
About /
Day Trading Forum /
Investment Calculators /
Pivot Point Calculator /
Market Profile Generator /
Fibonacci Calculator /
Mailing List /
Advertise Here /
Articles /
Financial Terms /
Brokers /
Software /
Holidays /
Stock Split Calendar /
Mortgage Calculator /
Donate
Copyright © 2004-2023, MyPivots. All rights reserved.
Copyright © 2004-2023, MyPivots. All rights reserved.