MyPivots
Sign In
JA
jarek
Rep: 94
Posts: 3,474
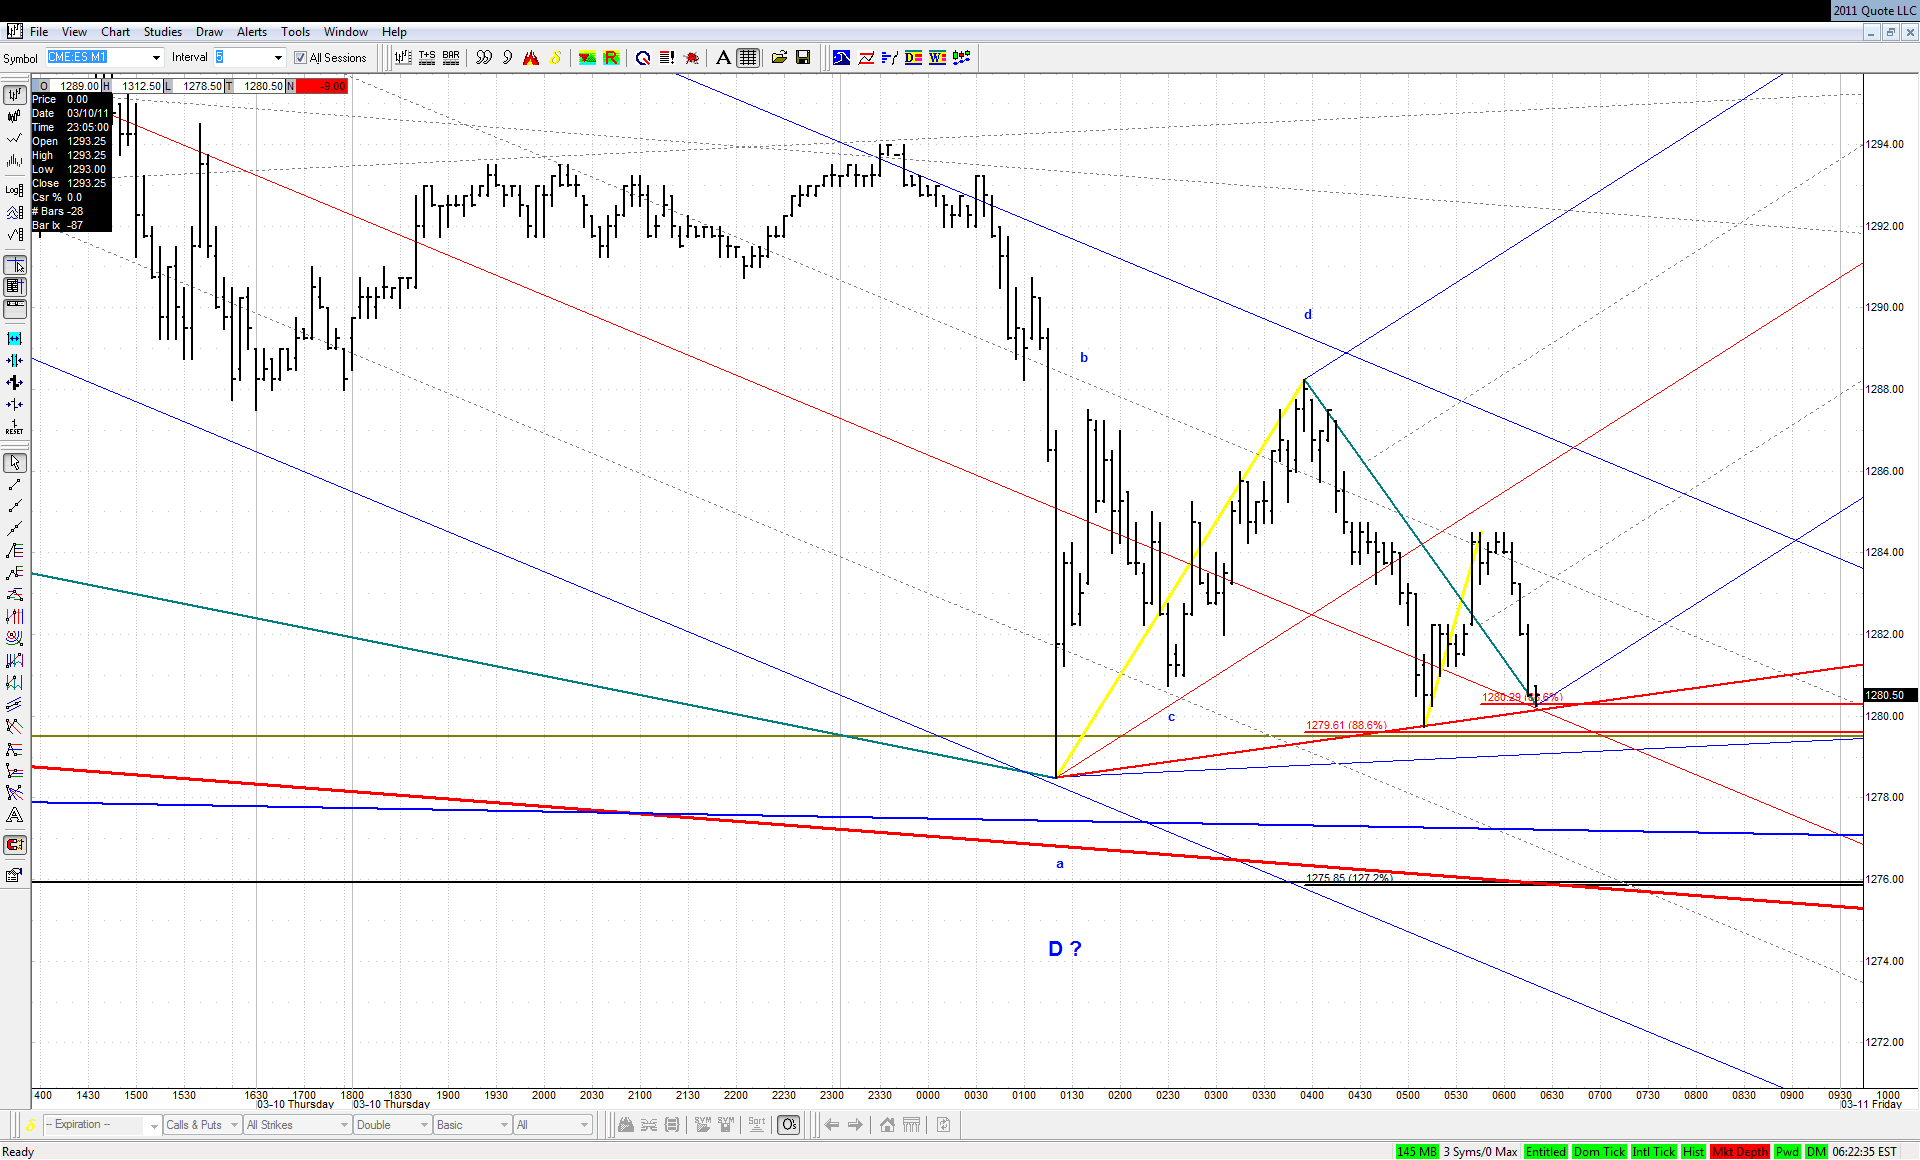
ES is shaping up nicely for my new scenario, especially with the smallest Schiff set respected very well so far:

Click image for original size
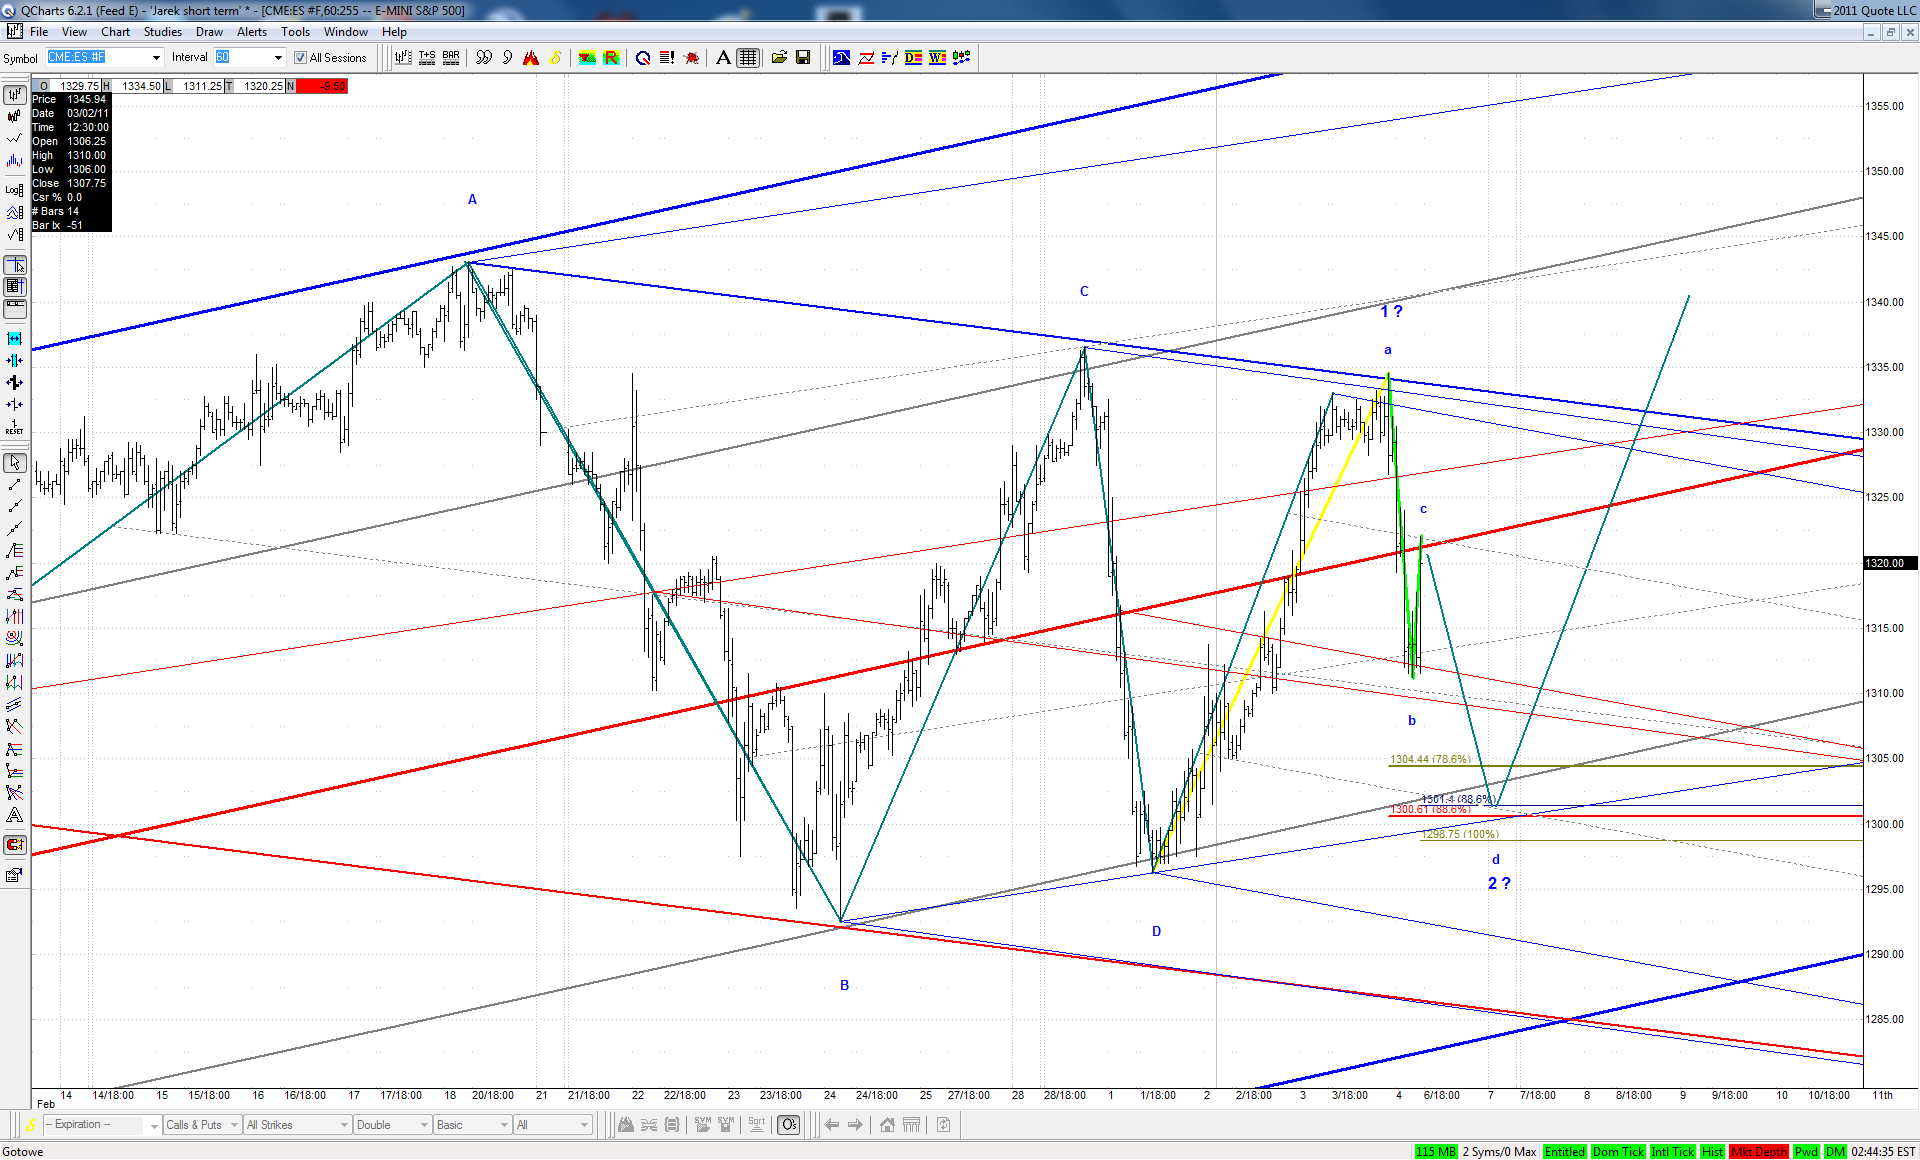

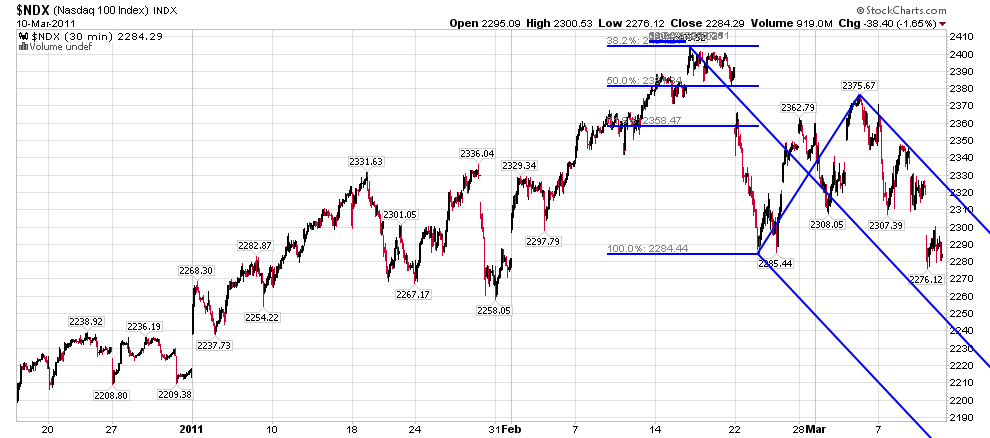
However the W4 triangle on the main index could have already been completed on Friday and in such case the usual Sunday/Monday procedure should take place from the start of trading.
JA
jarek
Rep: 94
Posts: 3,474
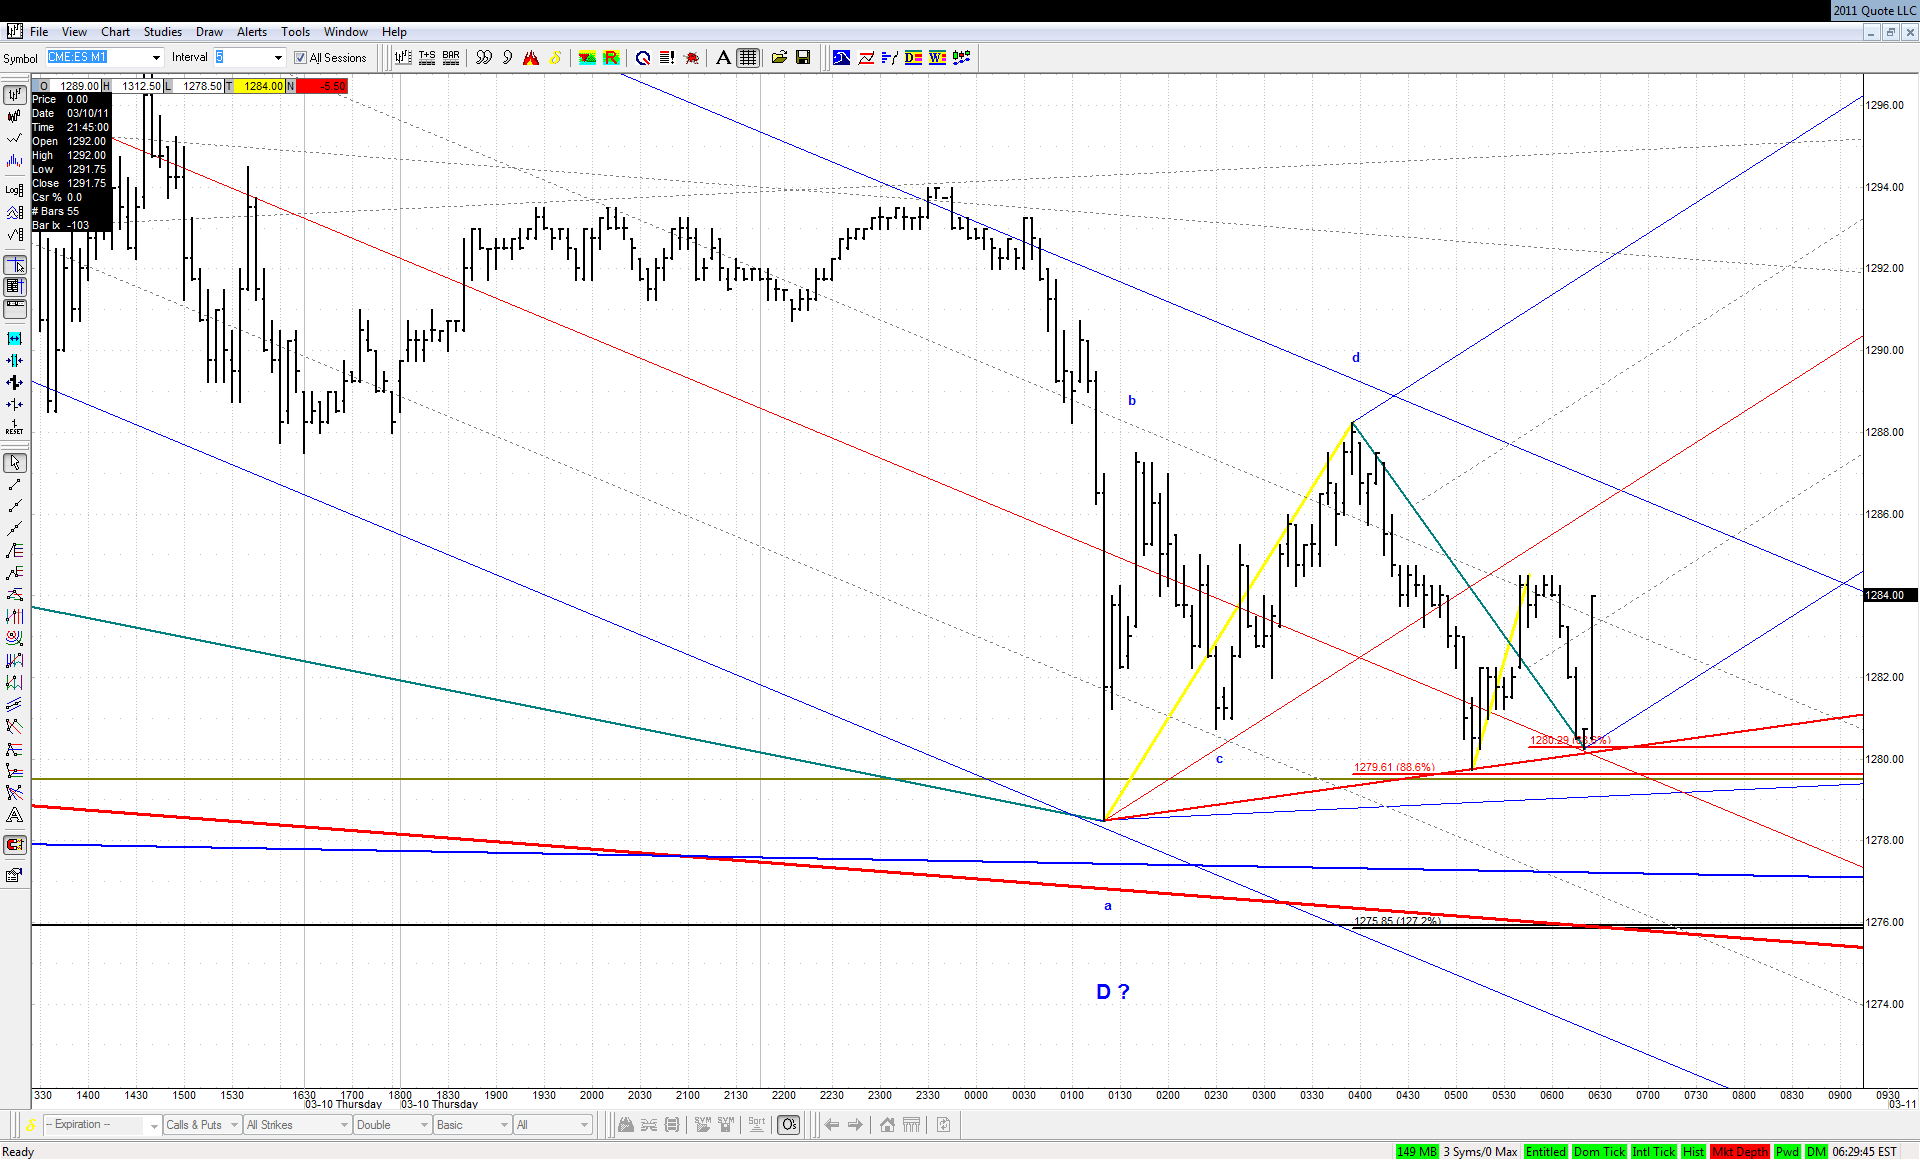
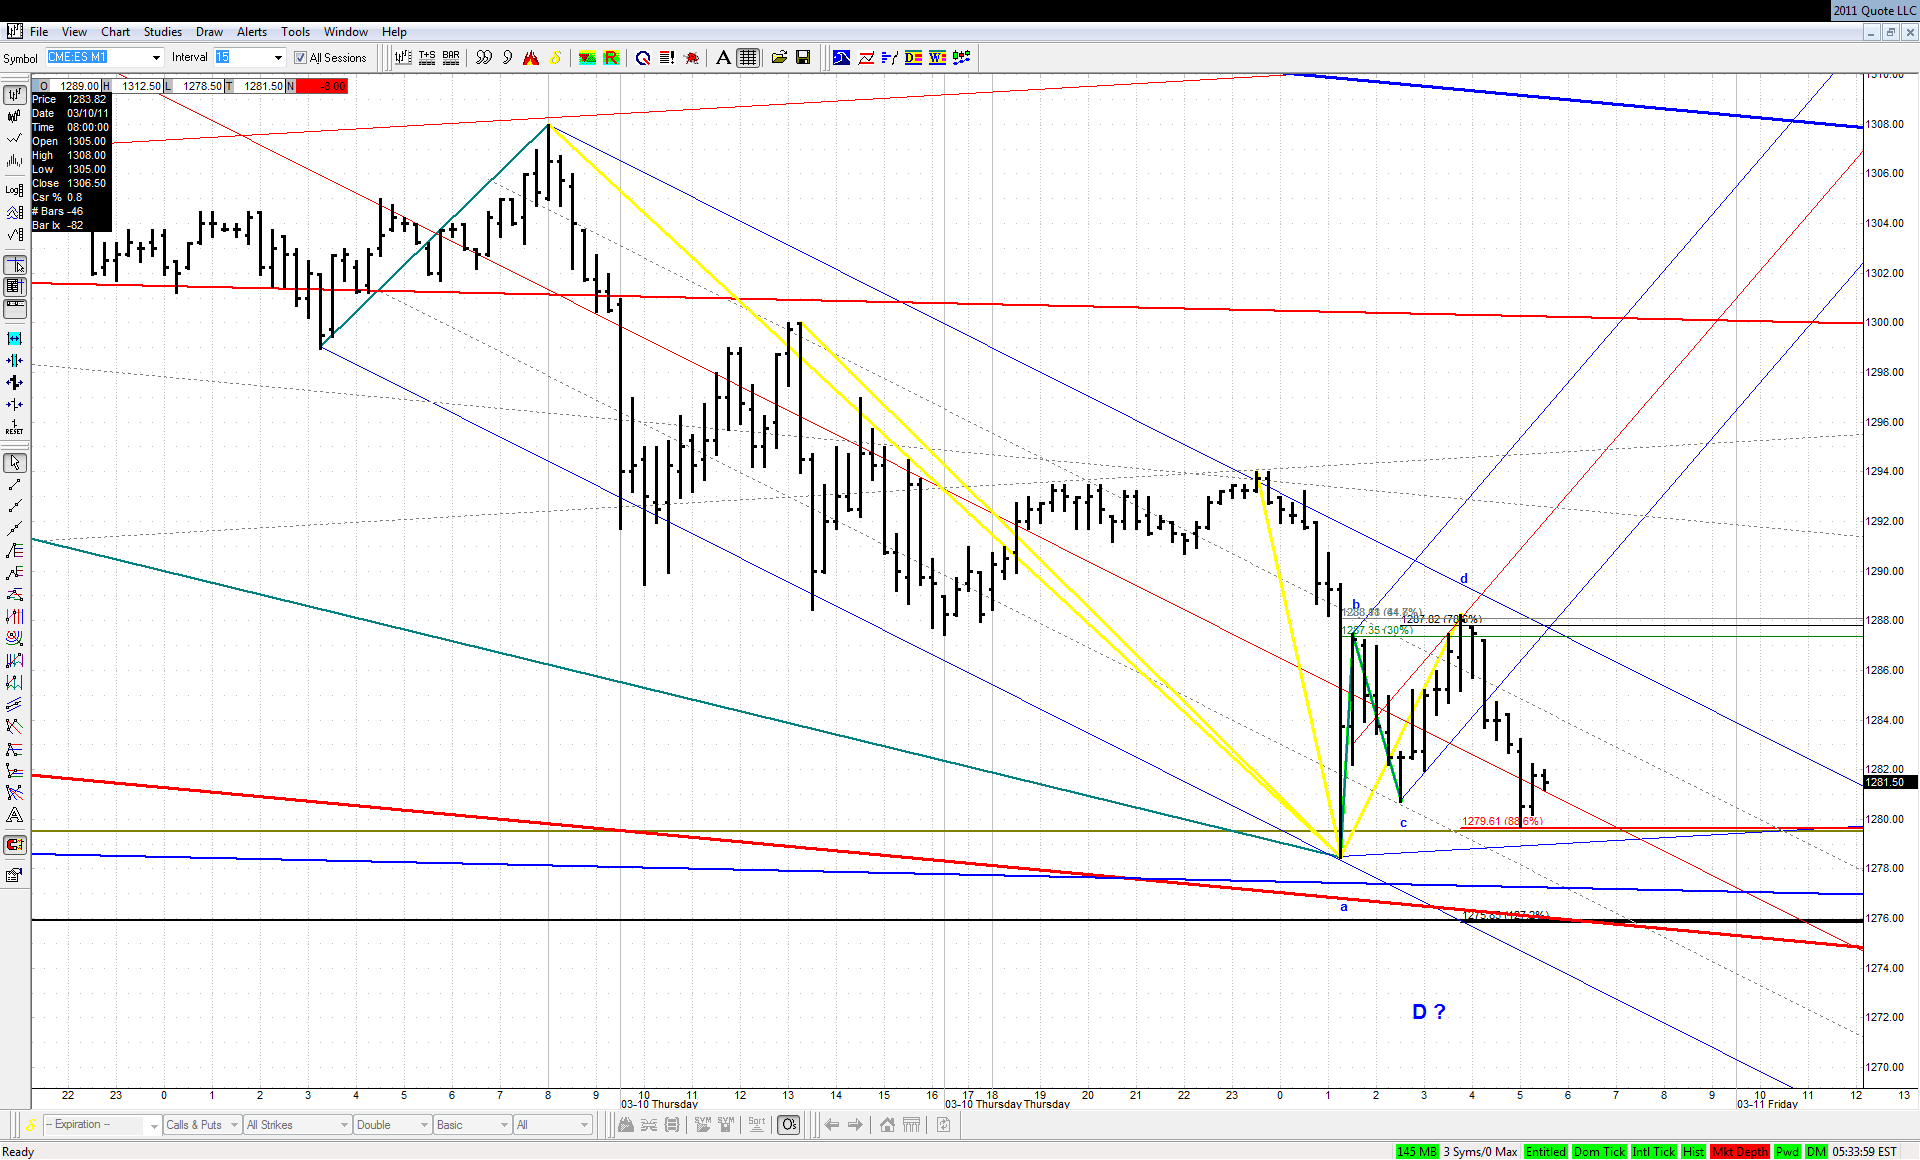
1.272 of the recent bearish ABCD in ES lies exactly at that all important line:

Click image for original size


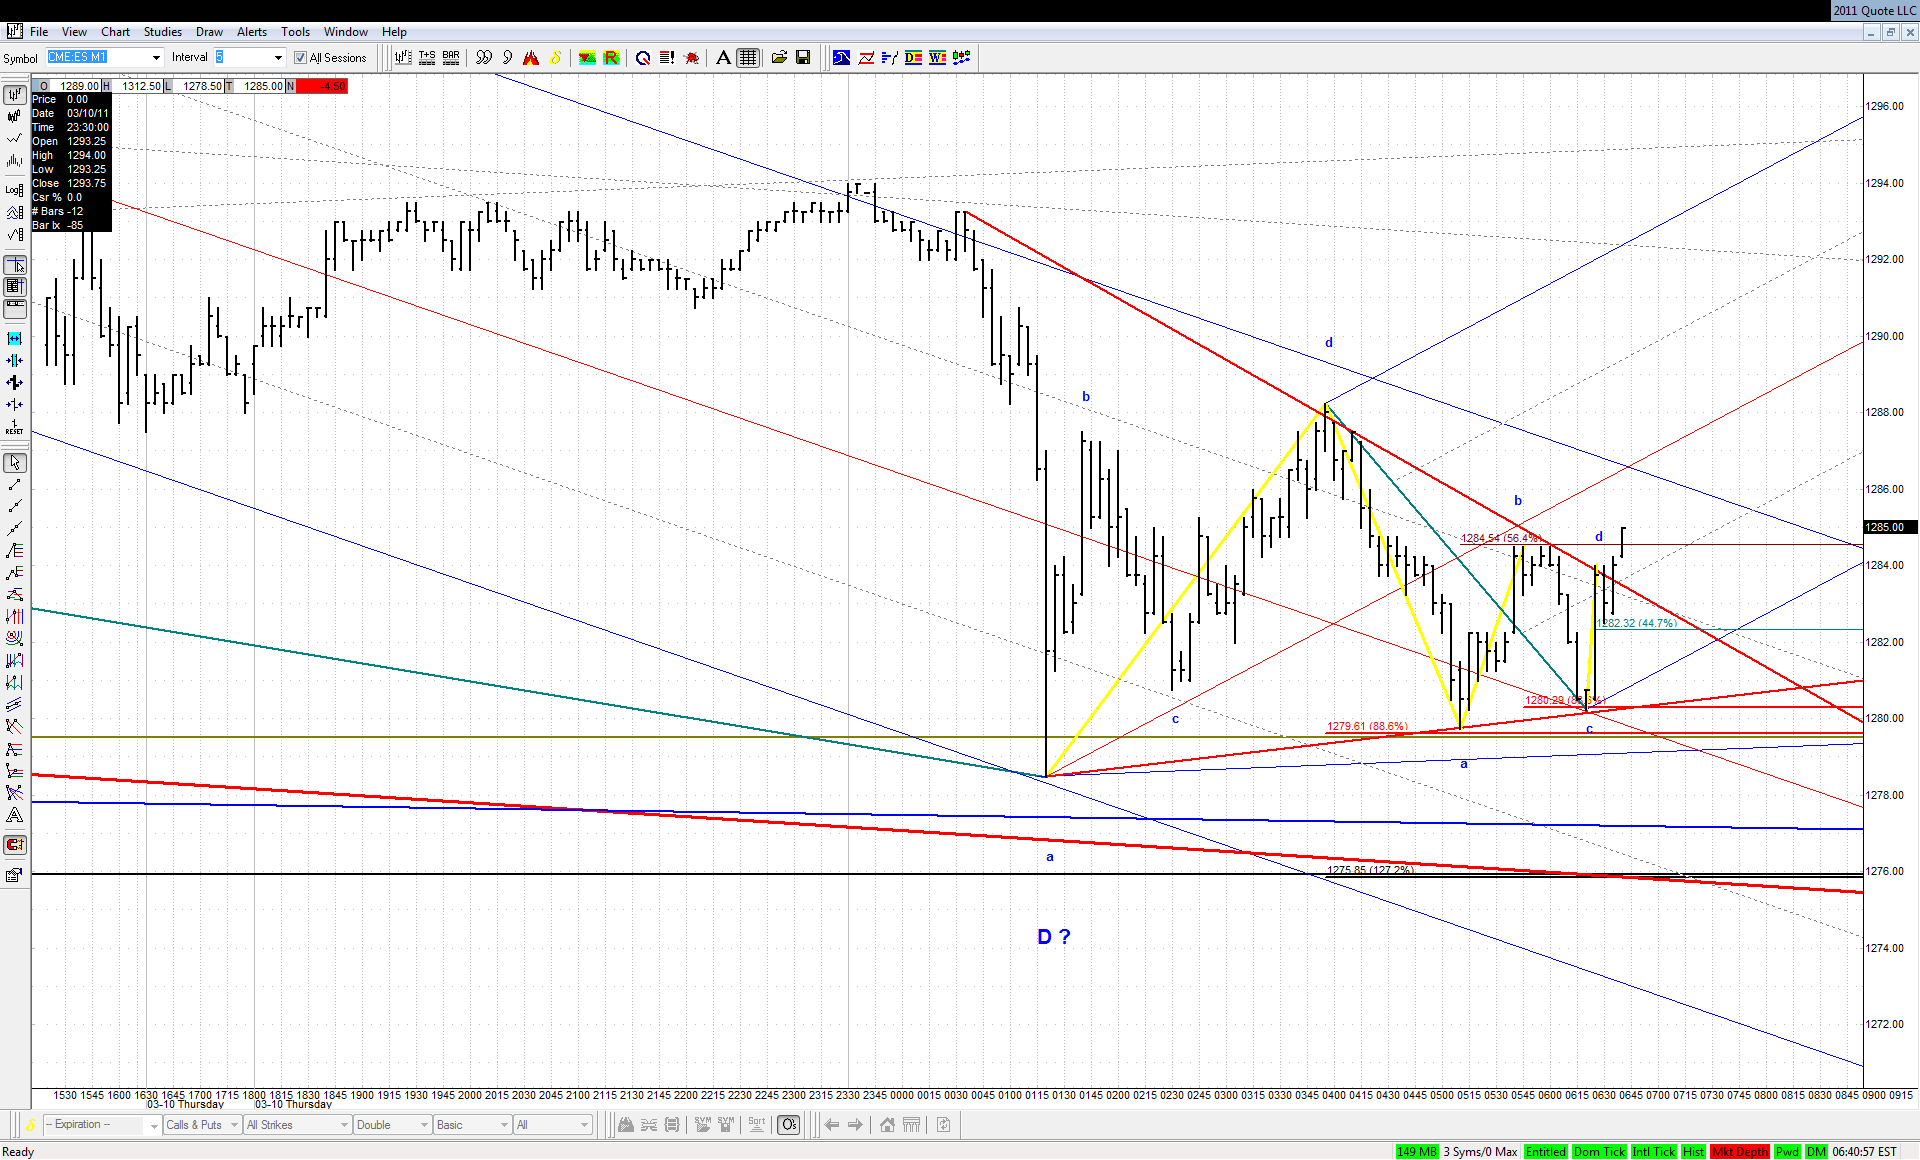
But if it doesn't overcome current .886 retracement - this would be even more bullish short term
JA
jarek
Rep: 94
Posts: 3,474
WoW - double .886. That would really be something:

Click image for original size
JA
jarek
Rep: 94
Posts: 3,474
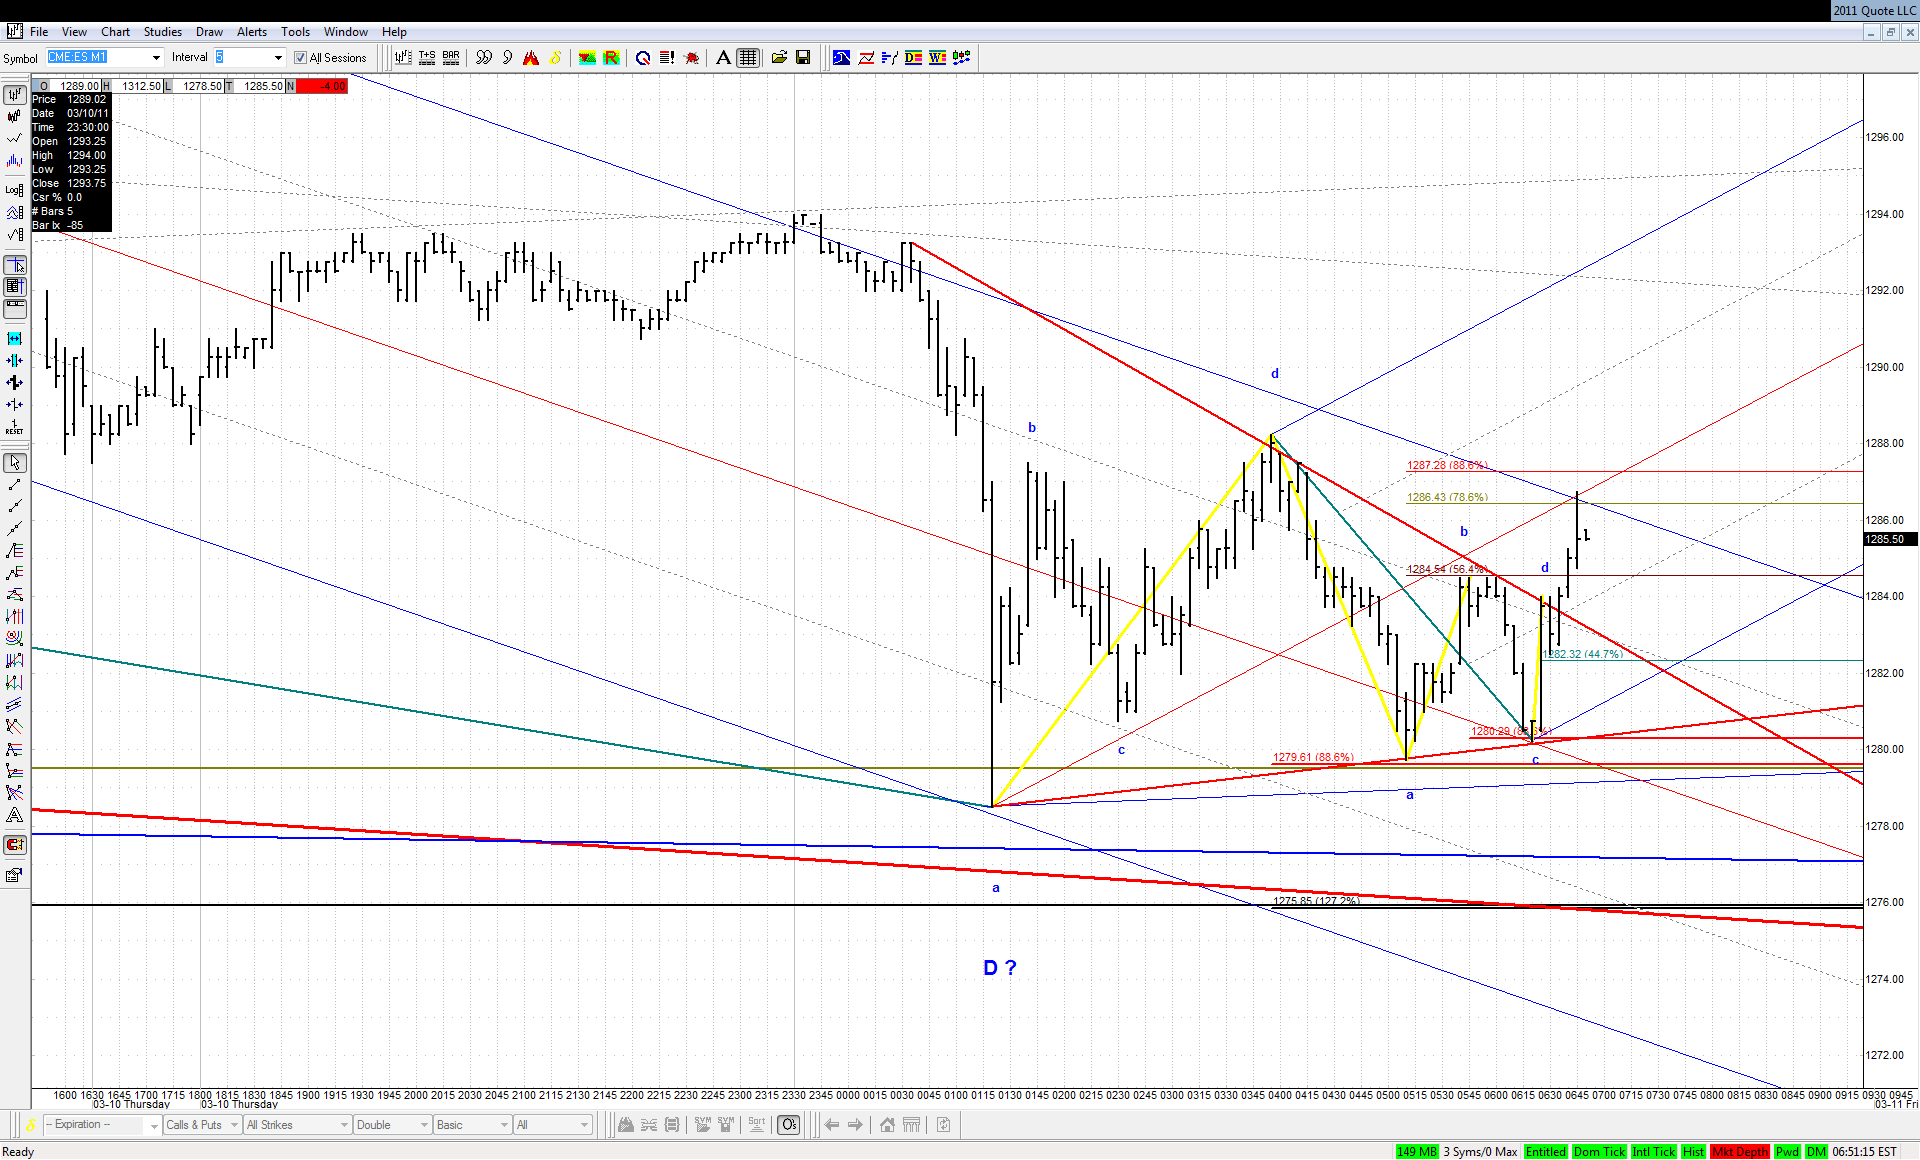
What a reaction off that double .886!

Click image for original size
JA
jarek
Rep: 94
Posts: 3,474
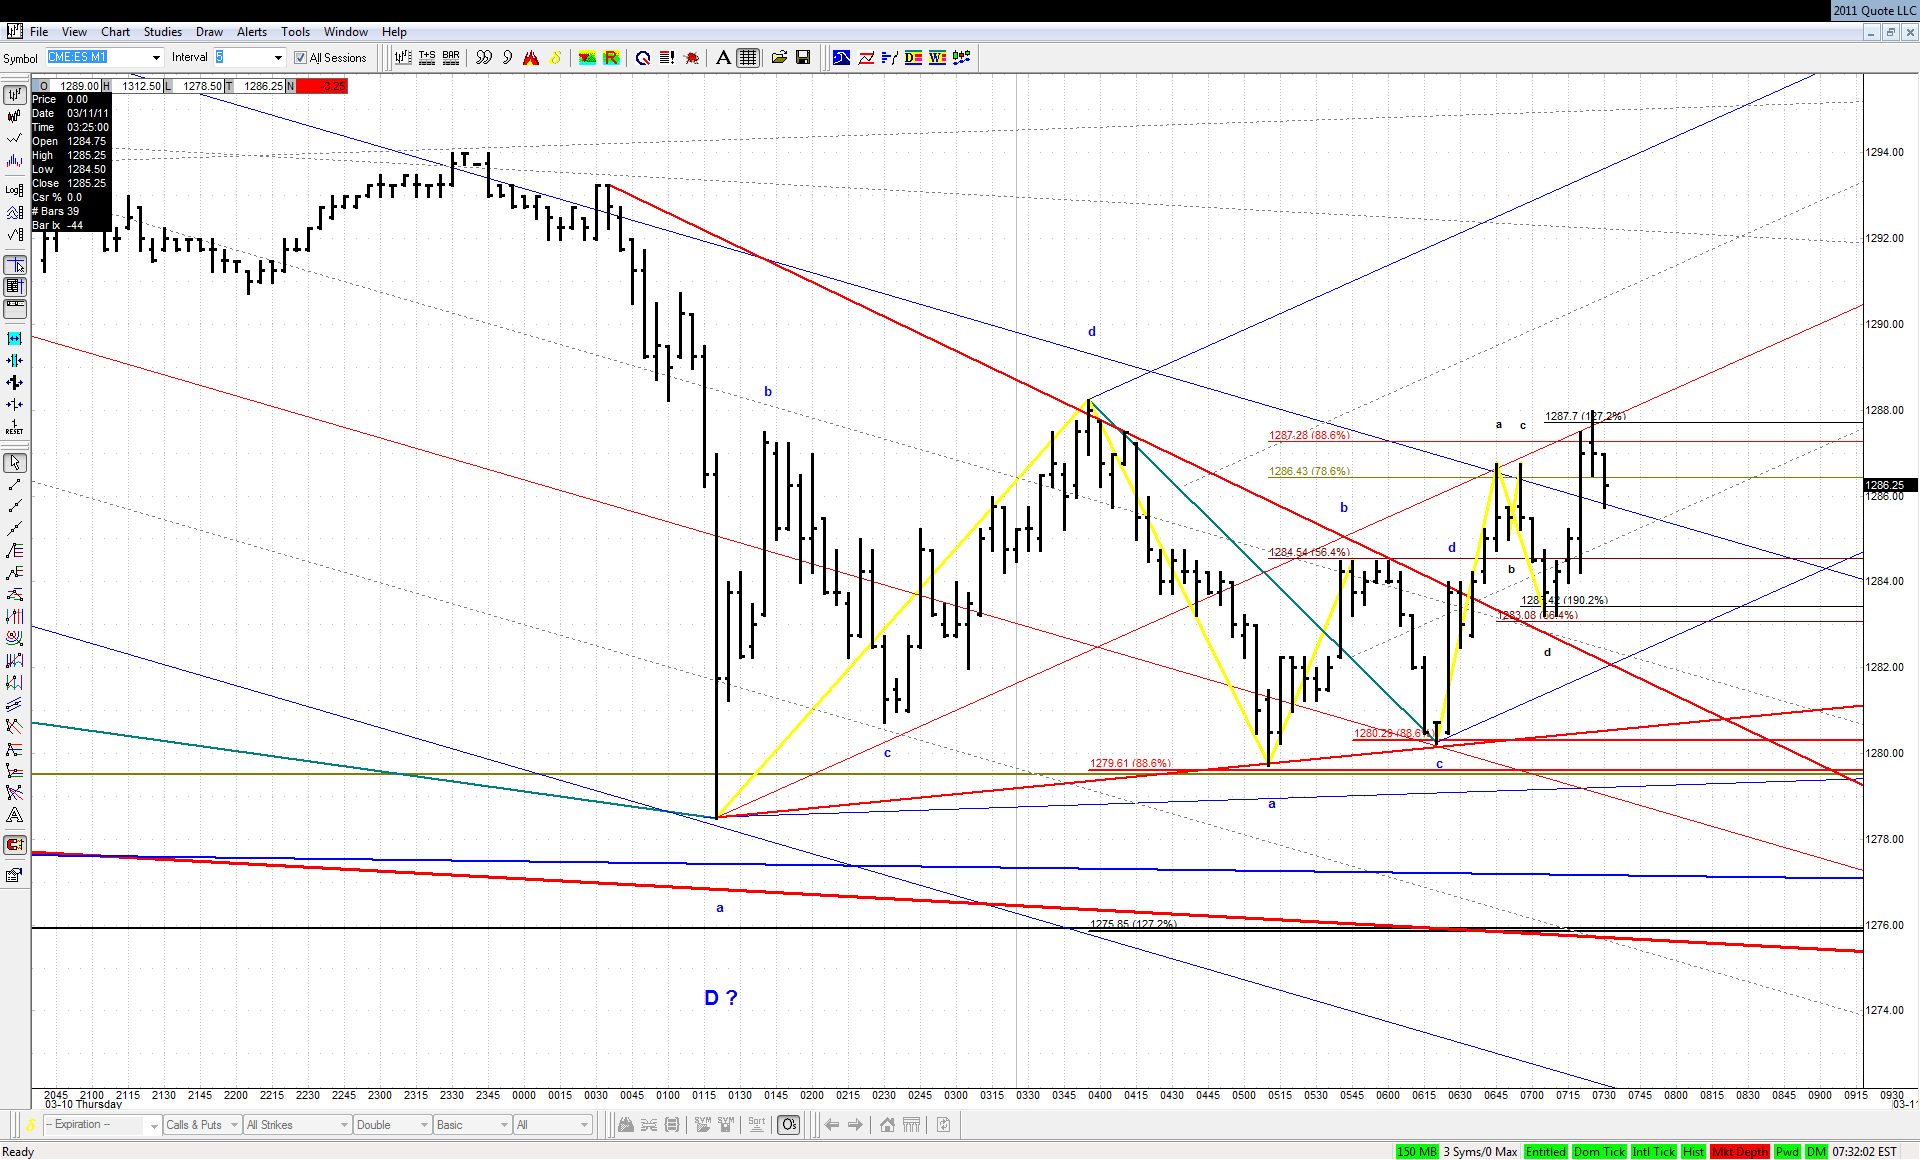
Failure of this small bearish 4PT at TL should lead also to a failure of this bigger bearish ABCD that ended at .886:

Click image for original size
JA
jarek
Rep: 94
Posts: 3,474
If they take out this geometry in the Game Zone - the bigger ABCD is theirs:

Click image for original size
RA
rat89
Rep: 0
Posts: 7,015
me too.....I have a LOT to learn from all of you.....never let ignorance keep you from posting....I haven't


Originally posted by jarek

I started to post here when my knowledge was probably 1/20th of the current level. Check yourself my charts from the beginning of 2009... But it somehow happenes that the more I post, the better trader I become

JA
jarek
Rep: 94
Posts: 3,474
Originally posted by jarek

If they take out this geometry in the Game Zone - the bigger ABCD is theirs...
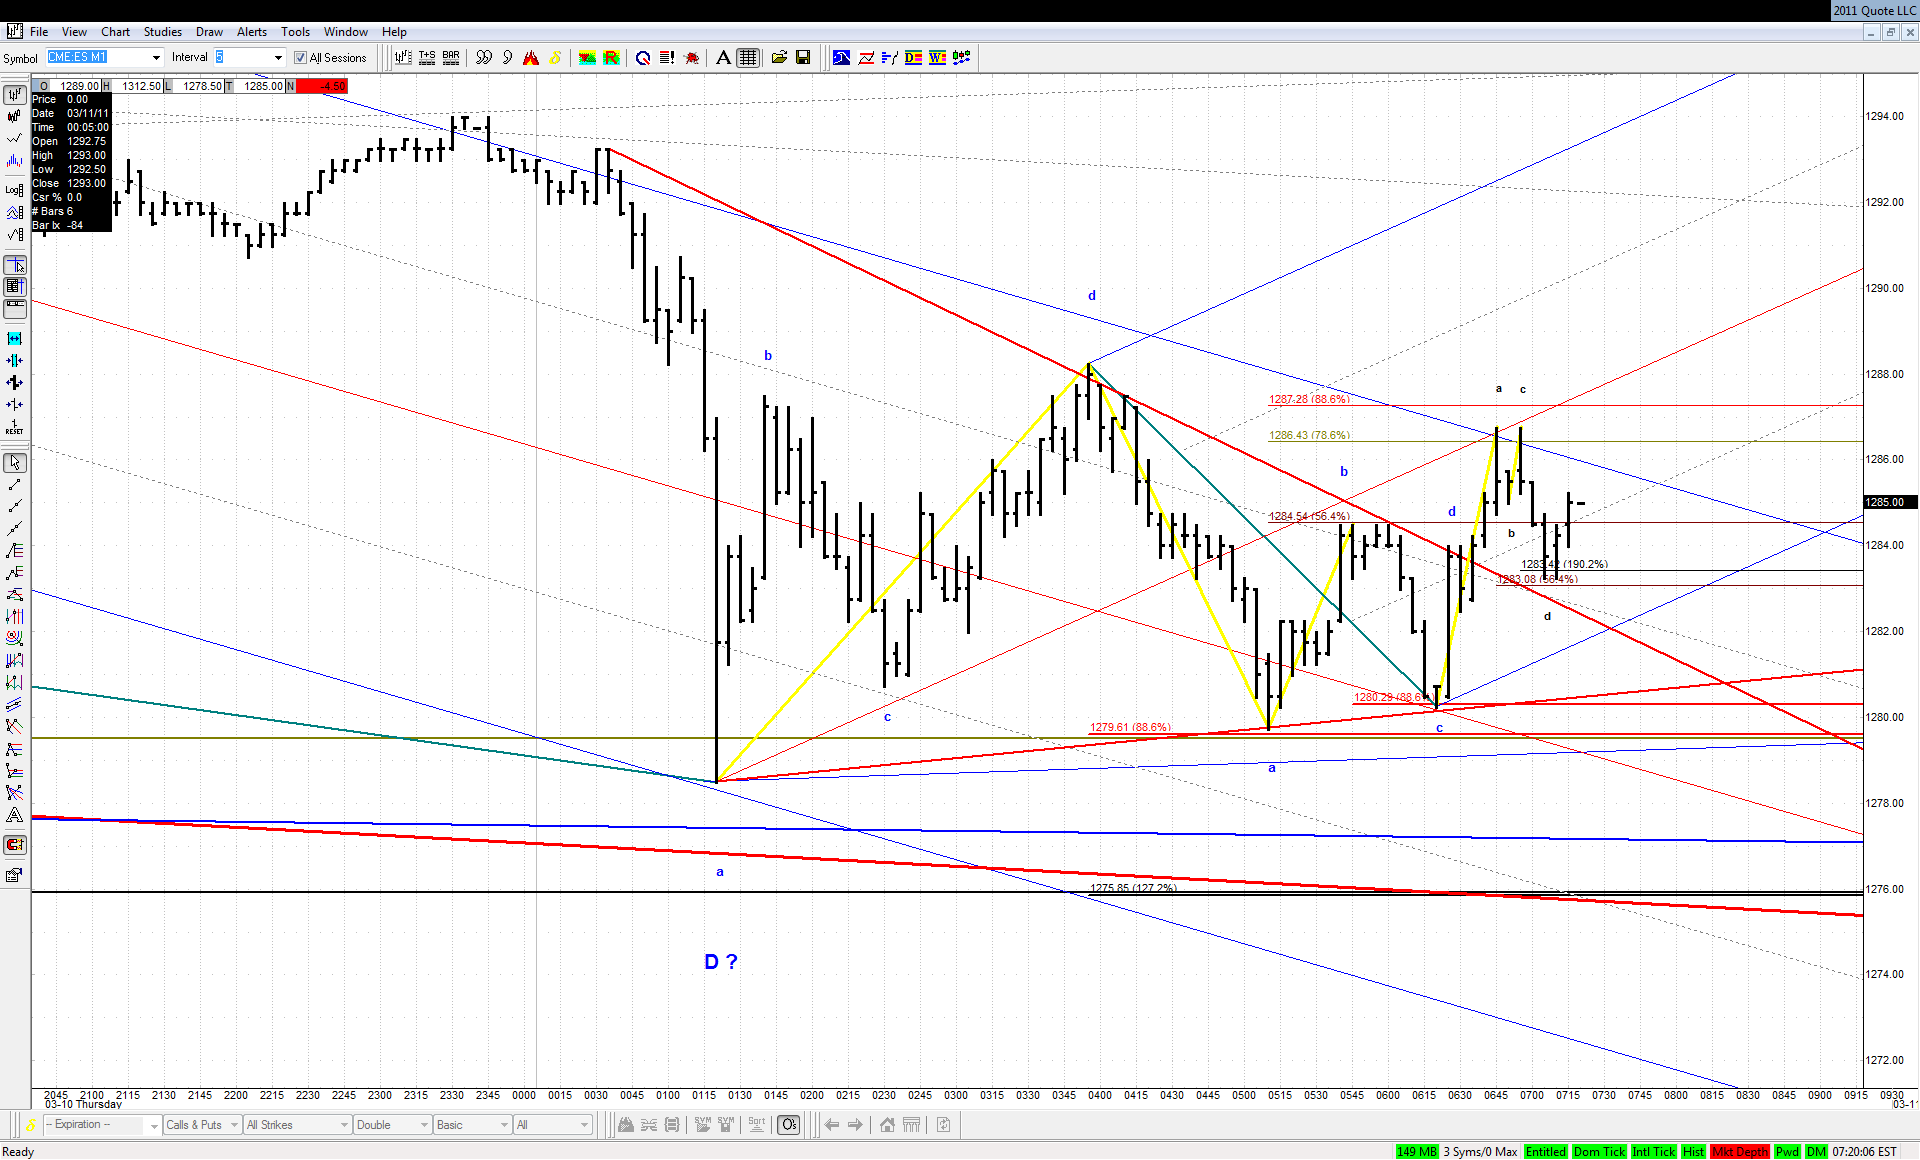
They formed a launch pad for this - small DT ABCD that back-tested that downsloping TL:

Click image for original size
JA
jarek
Rep: 94
Posts: 3,474
This DT played out as expected, but the bigger ABCD still holds. It should be the matter of time though IMO:

Click image for original size
RO
roofer
Rep: 3,689
Posts: 3,574
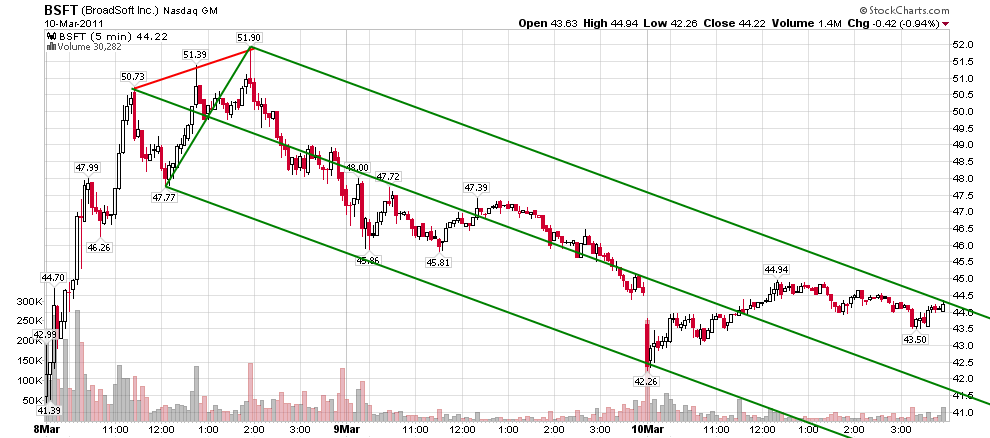
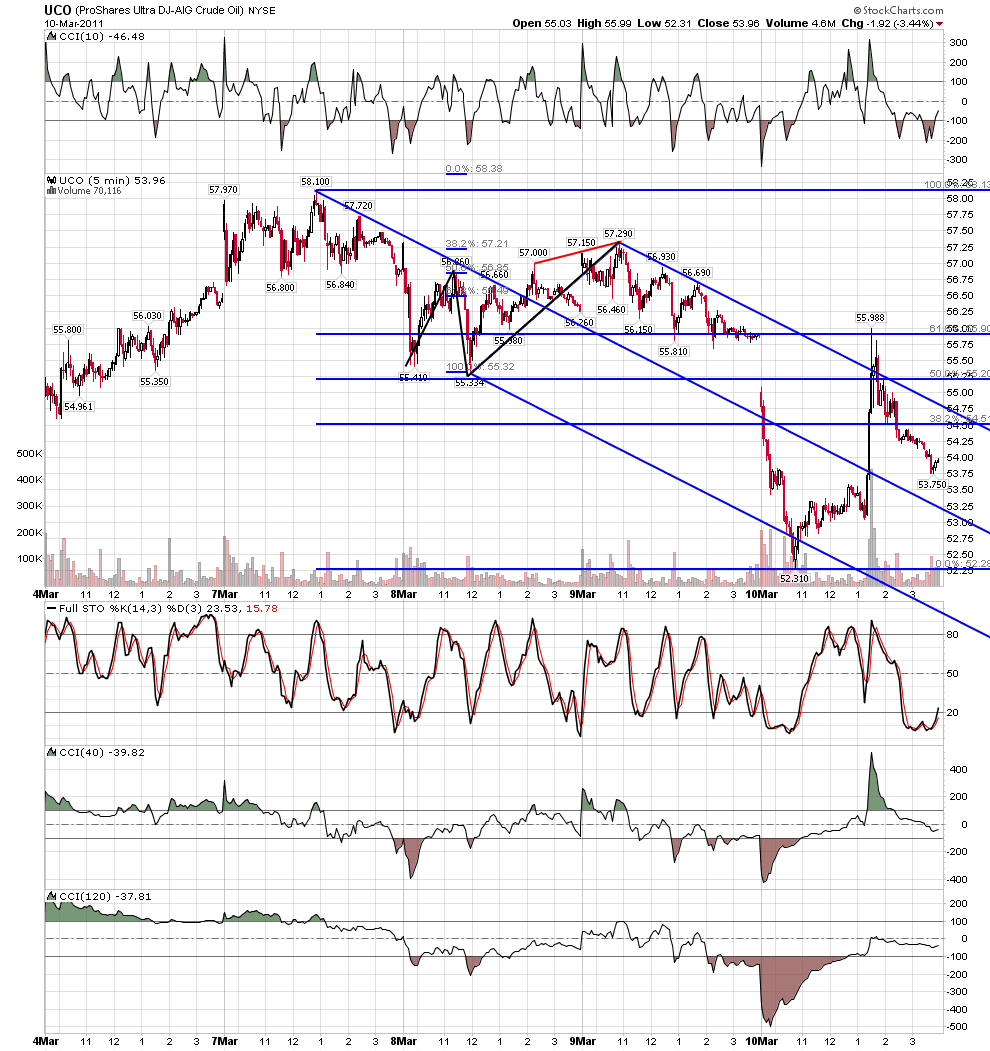
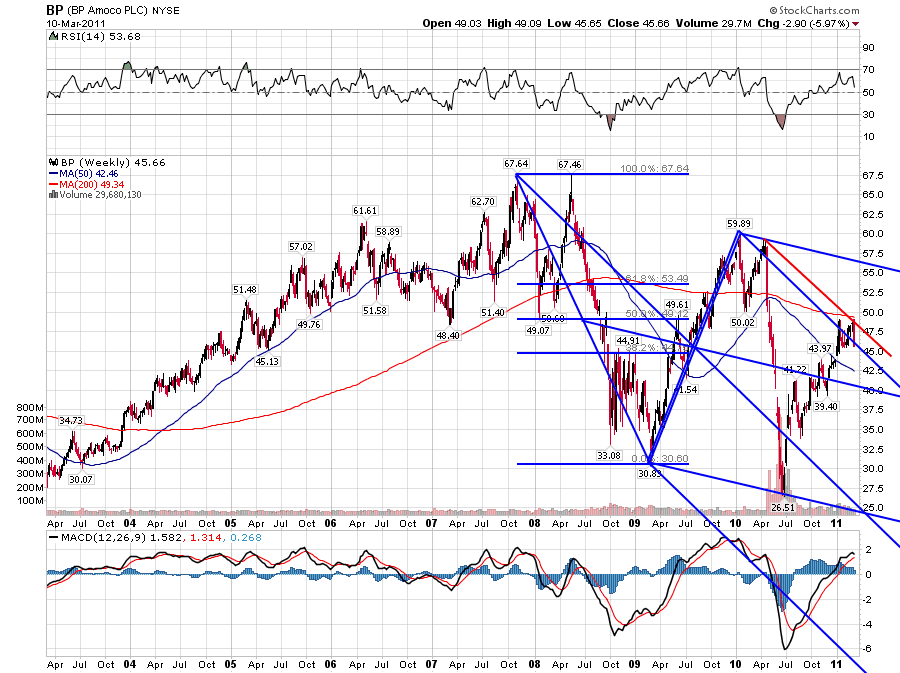
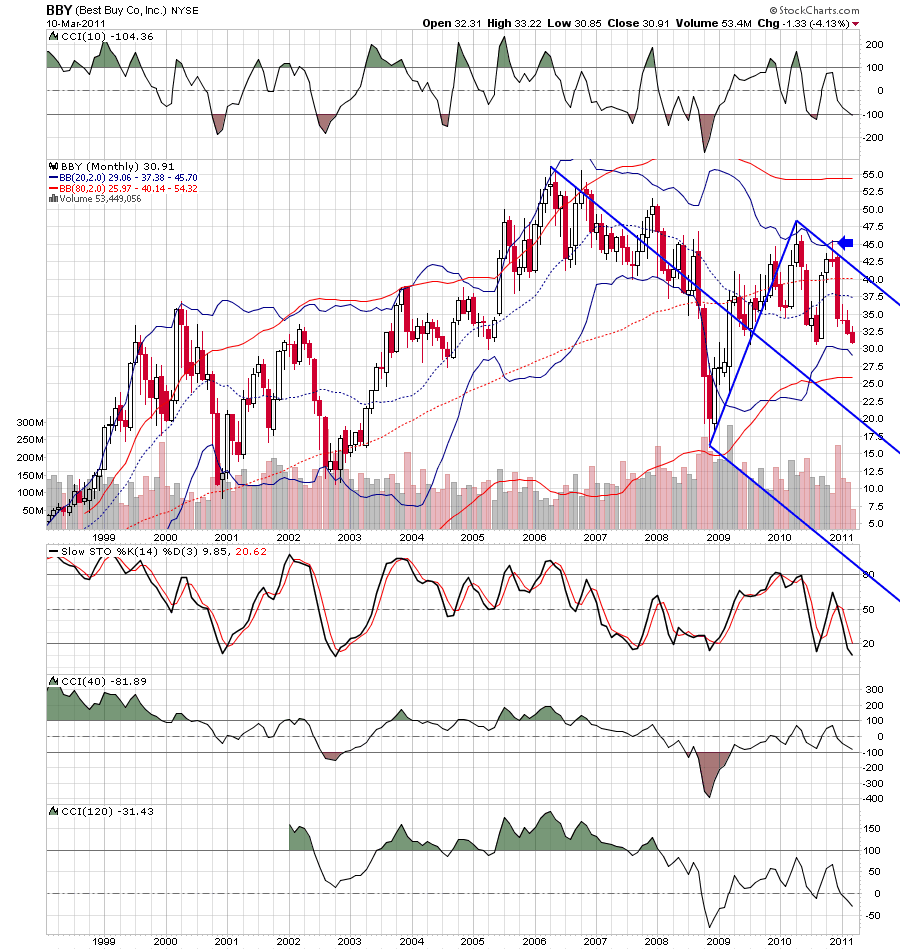
some classic short term action...../it is stranger than strange how the charts sometimes fortell the real world... look at BPH before well blew...../ i think the chart of BBY says it all... to me shorting BBY again and again, even in the face of the market ramp has been a no brainer.... i see bankruptcy within 2 years....strictly based on the charts...lastly, unless ndx can escape, i will find it hard to position trade long
Click image for original size

Click image for original size

Click image for original size

Click image for original size

Click image for original size
JA
jarek
Rep: 94
Posts: 3,474
Originally posted by jarek

... the bigger ABCD still holds. It should be the matter of time though IMO...
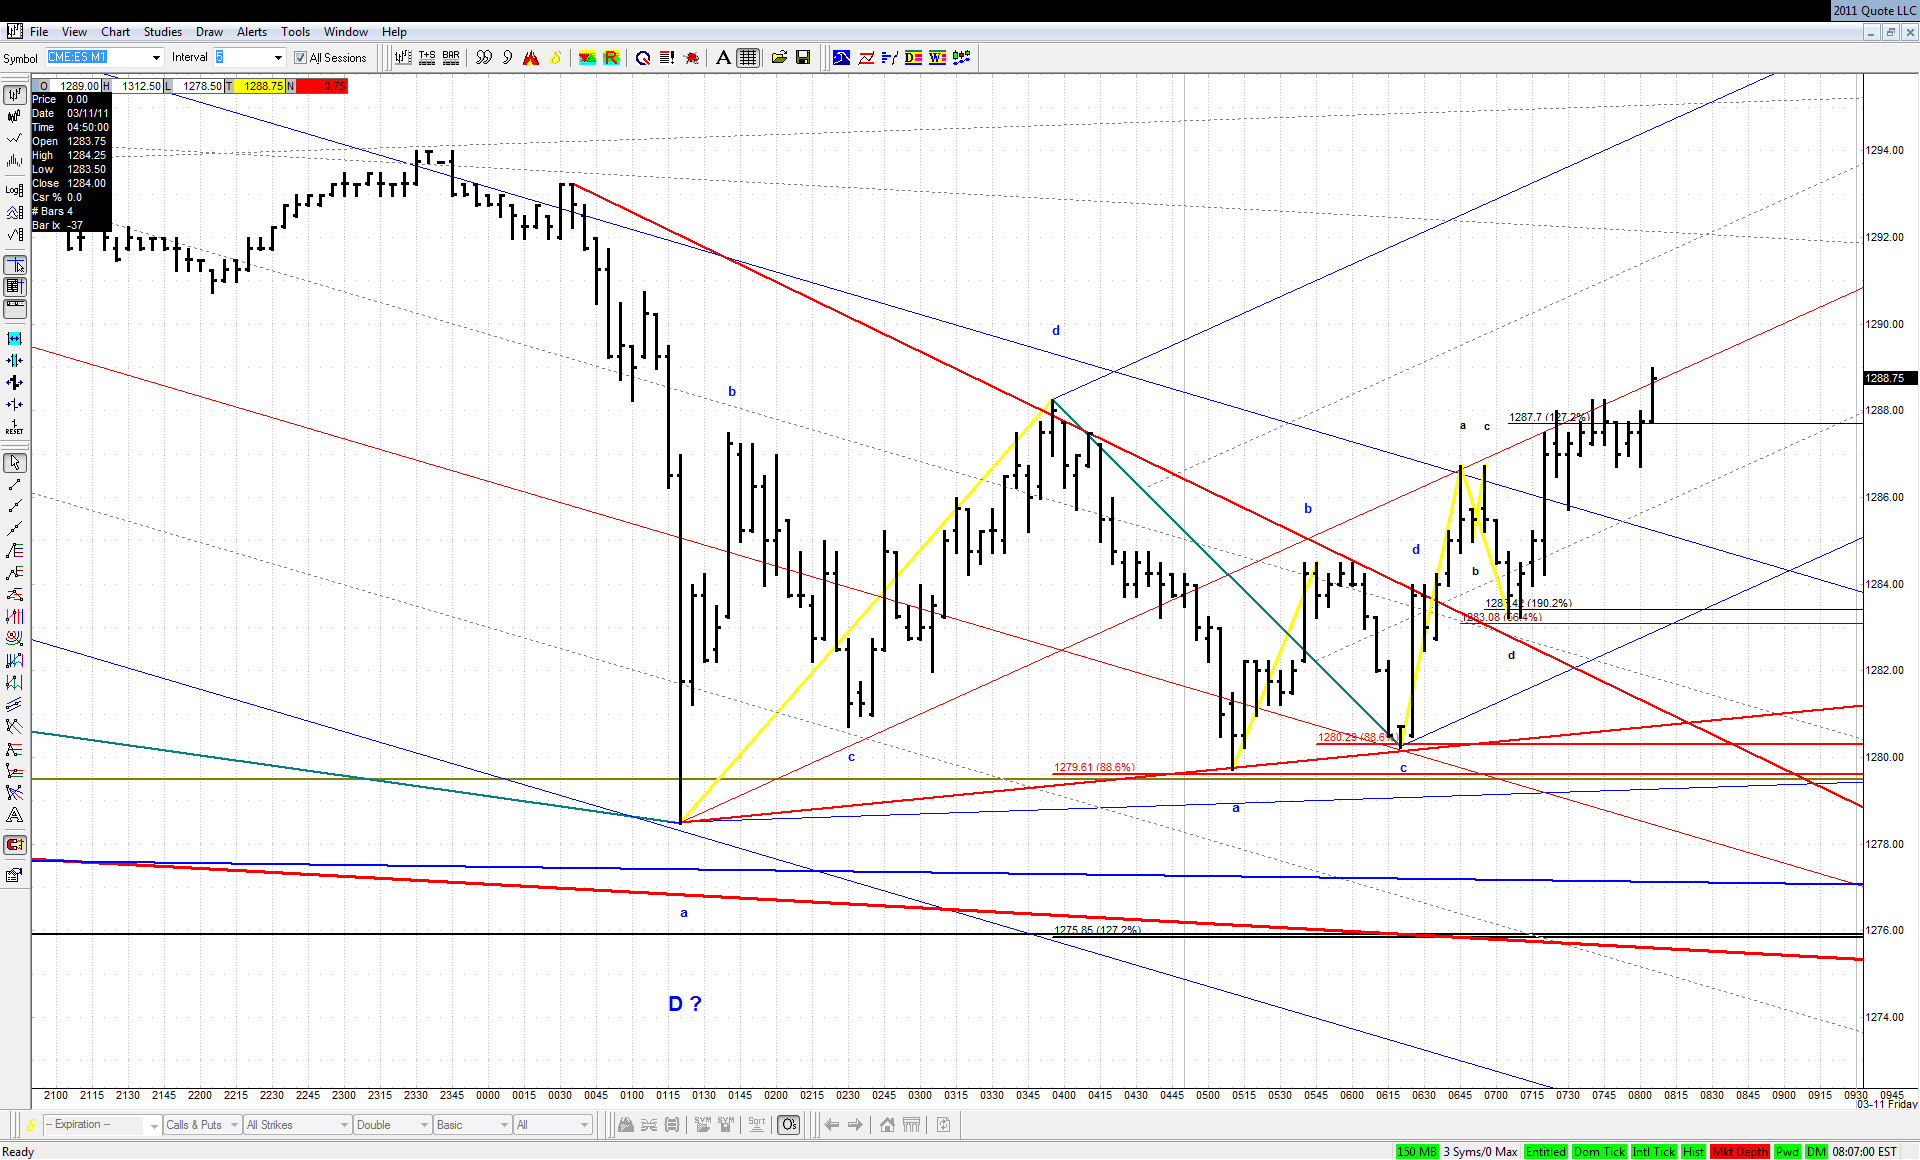
... and it was indeed!

Click image for original size


That concludes my live report from forming this potentially important bottom. Thank you watching "Deciphering the market using Kane methodology". More to come after some commercials
RA
rat89
Rep: 0
Posts: 7,015
yes, thanks jim

Originally posted by jimkane
Hopefully at least this leaves you with some understanding of my reasons.