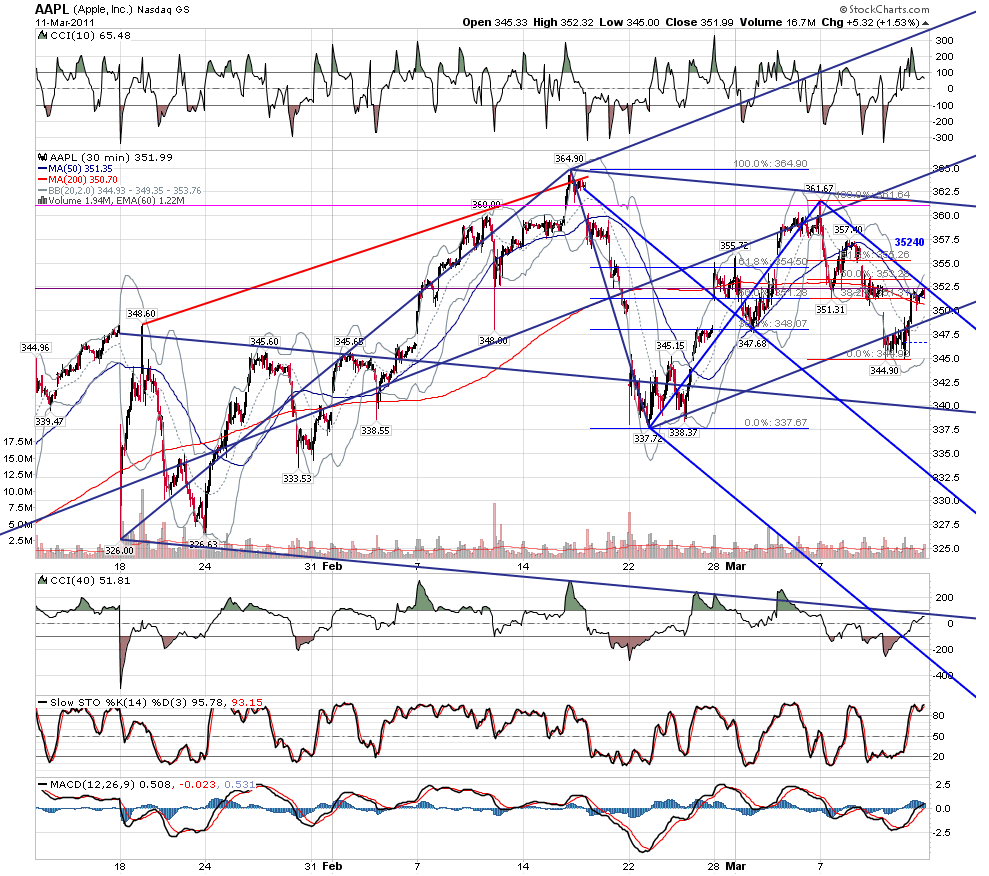
ES is shaping up nicely for my new scenario, especially with the smallest Schiff set respected very well so far:
However the W4 triangle on the main index could have already been completed on Friday and in such case the usual Sunday/Monday procedure should take place from the start of trading.
JI
jimkane
Rep: 3,058
Posts: 33,089
If you did the work I did (I assume you all did), my area was from 3.75-5.00 for the key Fibs, the lower line at 3.50 (since it was sloping down, it got lower as time went on), and the upper line from the 'triangle' breakdown at 4.50. It would have been more fun if I said '3.75-5.00' instead of 04-05, but get serious, I'm trying to show the general area, posted quickly, so people can see if their workups show the same area (and it did top within a tick of what I posted). That way they know they are focusing on the same spot as I am, to know if their work is pointing them to the same spot I am watching.
The key thing here was how I pointed out that the higher area was the key one. I wanted to watch, and be cautious and ready off the earlier areas, but not too cautious. I wanted my approach to be to 'ride until close' for the last area. The high tick at 3.75 was hit less than a half hour before the close. Time to get seriously ready, as posted. And right off the area it came, again, as expected. Hence, the 'Too easy' comment.
Many times, I feel, the games these guys play are quite obvious, if, as roofer might say, you use the tools. Sometimes things are all around us, but we can't see them without the correct tools. Imagine the things, like bacteria or stains, that are all around us, and we can't see any of them. Then you put on those glasses and light up the room with a UV lamp, like the CSI people do, and things all around light up. Always there, just invisible without the tools. I look at it like that. These things can sometimes, in my opinion, be obvious, if you have the tools to see how they play the games. Just some thoughts.
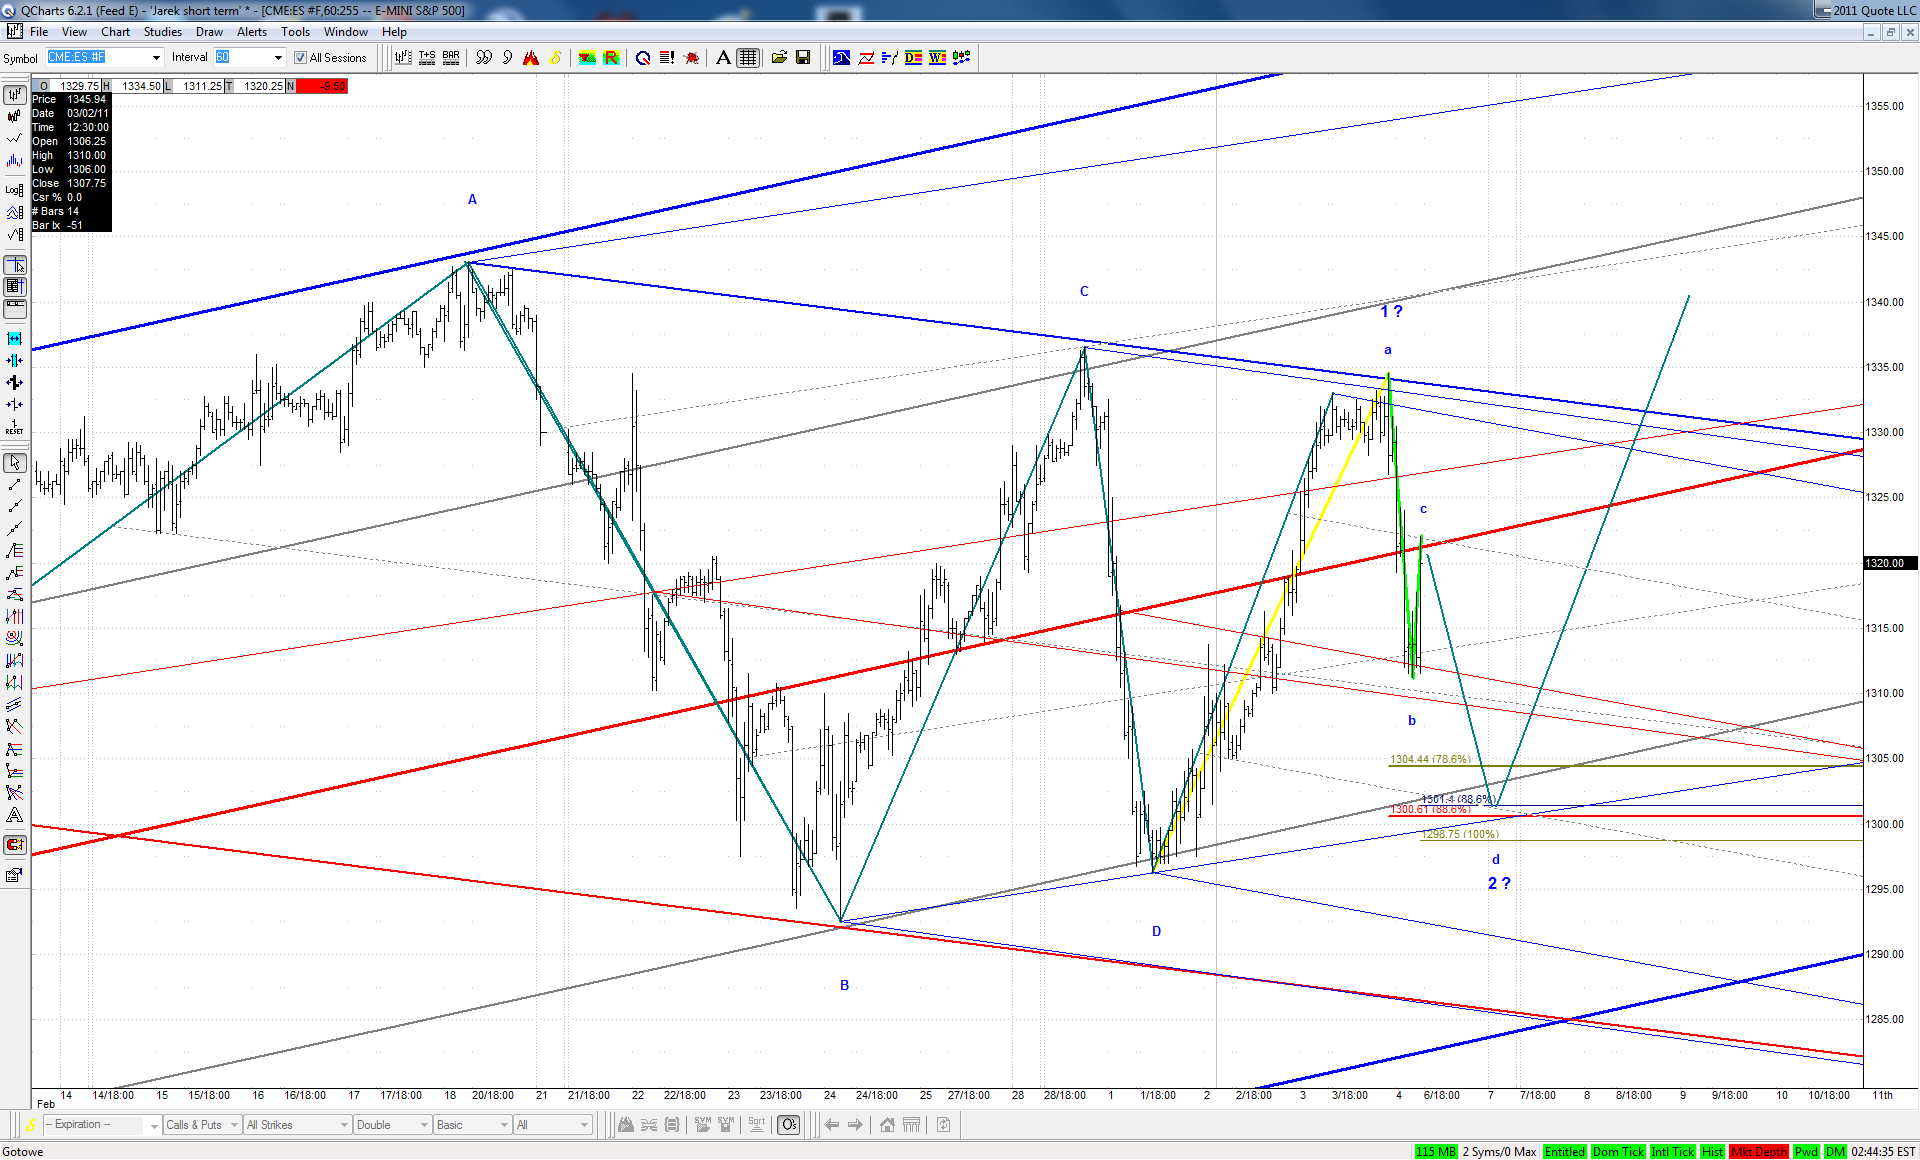
P.S Watch this ES ABCD here, right back to the price flow. Clue time.
RA
rat89
Rep: 0
Posts: 7,015
I think so....I would be curious to see your chart though Jim...
Originally posted by jimkane
I'm trying to show the general area, posted quickly, so people can see if their workups show the same area
JI
jimkane
Rep: 3,058
Posts: 33,089
rat, I've commented in the past a bit on why I rarely post charts in here anymore, but since who knows where those comments are buried, I'll post them again for the newcomers. During live action it is far too distracting and cumbersome for me to post charts. It's challenging enough to make posts at all. That's why I generally don't post until the quieter, late afternoon time when things are settled down and I am already positioned, or there is going to be little left to do as far as additional chartwork.
As for posting some charts after the close, here's why I don't do much of that (other than at that point I've usually had it, or I am getting ready to work with a student). My charts are usually loaded with a lot of things, old lines, old Fib brackets, etc., and by the end of a session they would be mostly incomprehensible to anyone else (notwithstanding the trade the chart naked comments I posted in another thread, which, although I said I felt I could do, I usually do mark up most timeframes, partially to keep my concentration, and partially to keep experimenting with concepts).
They also have various things on them that are proprietary to the extent that only mentor students who have signed non-disclosure agreements have seen, and some that aren't even shown to anyone. It might take me literally a half-hour to redo a chart from scratch and make it legible and relevant for that one post. There is just no way I have the time or energy to do that.
That's why jarek's charts are so useful in here, they generally show the basic gist of the key areas I'm watching. They aren't my charts, but they have a lot of the main core items, and more than enough to see the concepts in great detail. He also leaves certain things off at my request.
So, although I'd love to be able to show everything, it just isn't practical for me. I'm doing the best that I can, and I understand it isn't easy to grasp some things without more detailed chartwork, but 'all I can do is all I can do'. Hopefully at least this leaves you with some understanding of my reasons.
Originally posted by rat89
I think so....I would be curious to see your chart though Jim...
Originally posted by jimkane
I'm trying to show the general area, posted quickly, so people can see if their workups show the same area