ES Short Term Trading for 3-28-11
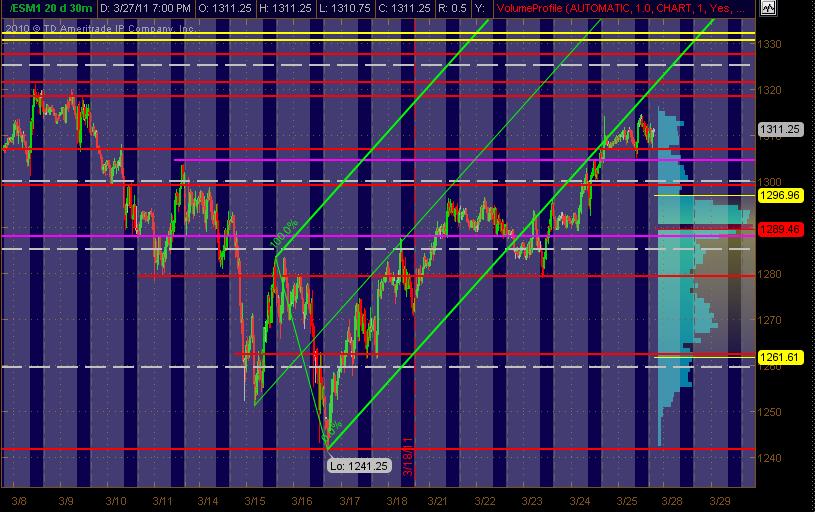
Figgered I'd post my ES trading MAP for Monday and this week. It's the June ES contract 30min chart of 20 days, all hours trading, with RTH sessions of blue background and gray being the "overnight" activity.
Red lines are potential significant PASR levels with Magenta being semi-significant. The Whitish dashed lines are the Weekly Pivots. The Red lines that are roughly 1319-1321 should be considered a ZONE. The Yellow lines also should be considered a potential zone of Fib Clusters around the 1331-1332ish area.
I've left the Green Andrew's Pitchfork that I drew in last week ... as price, after it broke below the lower line, has ridden up against it to some extent. The Volume at Price is displayed on the right vertical in Blue. Hope this is helpful to some as a MAP!
Click image for original size
Good afternoon. Was out this morning.
Click image for original size
may cover my short @ breakeven or .5 pts loss. EMA 20 and 50 broke EMA 200 on upward direction. Not good for shorts.
moved 1310.50 target to 1309.50
well Raj..the 12.50 is still working it's magic but another test up there will be enough for me..I want to see them overtake the 10.50 node otherwise us shorts are gonna be on the wrong side
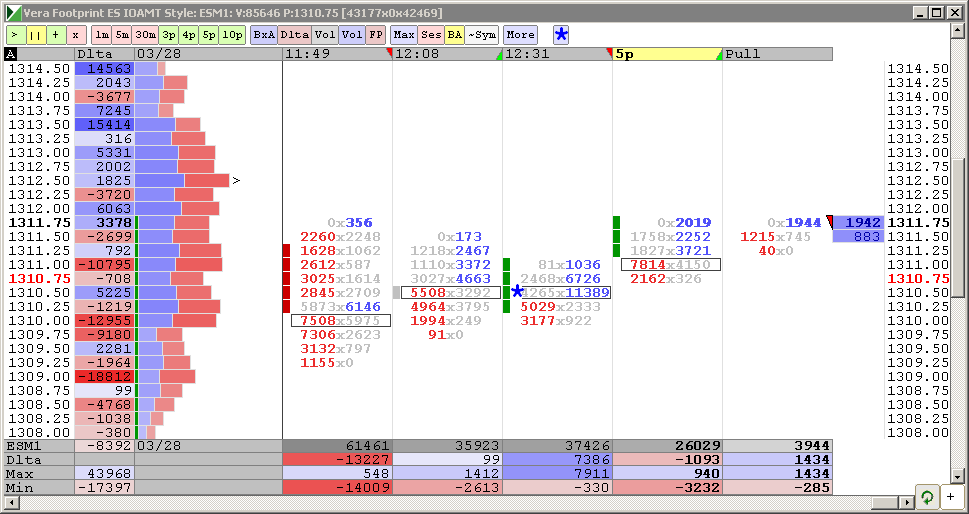
How cool is that.... the 1312.50 was a big number from friday and then the big volume came into it at 9:47 EST today.....but now what we need to see is some increase in Volume to break away from it down...otherwise there will be absolutely no reason for the market to NOT go back for yet another test up to it again....
Volume as an attractor....pure and simple..
Volume as an attractor....pure and simple..
Yes Bruce. trading up and down within 3 points range. I closed my position @ 1310. took .5 profit. again it may go to 1312.5 or 1313. If it goes there, I will take one more short.
setting my stop at 11.75...that is one nasty ledge up at 1312.50 and I'm not convinced of the volume down here...very light to be trying to create new VA lows with such poor volume
lol...looks like everybody went to lunch. 14k volume in a 30 min candle...i dont think ive ever seen such low volume intraday on a "normal" trading day
that's me gone at 1310.25....long hold and sure wish I resold that 1312.50 test but had no good signal...
good point Feng and without that volume we will just mean regress...vwap is fairly flat...so I think the smarter money may have been buying into that last dip down to get back to vwap/12.50
I agree Lorn..a potentially very powerful combination
Originally posted by Lorn
There is a certain aspect of delta in showing what the chasers are doing...imo.
That's why I prefer to look at delta on a cumulative basis in bar form so that I can see where the previous levels (pivots) came in relation to price. I use those levels (pivots) of CD as a way of marking where traders initiated there buying or selling. So it becomes a further area of support/resistance to use along with price action support/resistance.
Now combining that with your way of looking at volume Bruce I think is another step forward. The 1 min nodes of volume you follow, if they come in relation to a CD level of initiated buying/selling could give added weight to that levels effective support/resistance.
Ok. My brain hurts now.
Originally posted by BruceM
Yes, thanks Lorn...I guess I'm always looking to see things as they happen, or that repetitive pattern over time...
so right now I see all these orders that went off at the bid at 1310 - 1310.25...it's the peak volume price of the day now.....even overtook that 12.50 but this is based on repeated visits that price....
so if price rallies...the MD people would say "Hey , all those sell orders couldn't break down price so we rallied"
and if we decline they will say .." wow, look at all those sell orders...of course we dropped lower"
my statements are not directed at anyone in our forum...I'm just searching for ways to use this MD thing that is somewhat consistent ....if it even has any value...tons of youtube videos but that also is after the fact.....
I do like it for seeing the buildup of volume but I can see that on my Volume MP charts...the histogram shows that..
just babbling now...
Emini Day Trading /
Daily Notes /
Forecast /
Economic Events /
Search /
Terms and Conditions /
Disclaimer /
Books /
Online Books /
Site Map /
Contact /
Privacy Policy /
Links /
About /
Day Trading Forum /
Investment Calculators /
Pivot Point Calculator /
Market Profile Generator /
Fibonacci Calculator /
Mailing List /
Advertise Here /
Articles /
Financial Terms /
Brokers /
Software /
Holidays /
Stock Split Calendar /
Mortgage Calculator /
Donate
Copyright © 2004-2023, MyPivots. All rights reserved.
Copyright © 2004-2023, MyPivots. All rights reserved.