ES Short Term Trading for 3-28-11
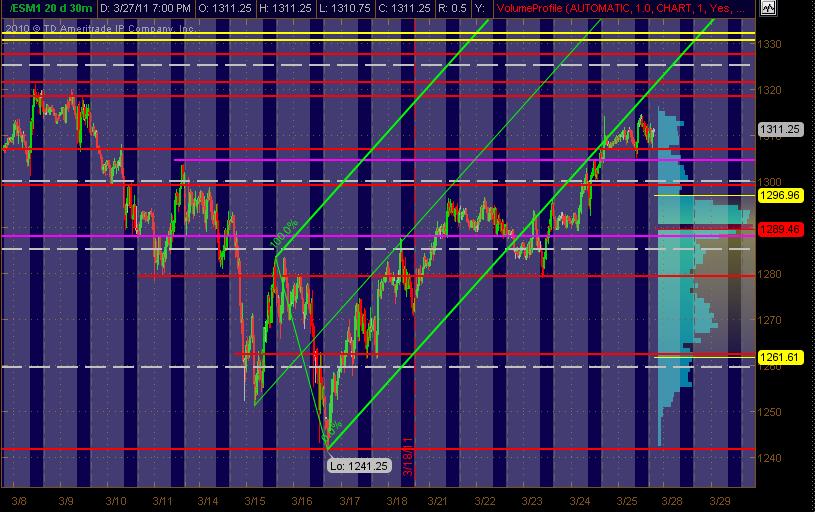
Figgered I'd post my ES trading MAP for Monday and this week. It's the June ES contract 30min chart of 20 days, all hours trading, with RTH sessions of blue background and gray being the "overnight" activity.
Red lines are potential significant PASR levels with Magenta being semi-significant. The Whitish dashed lines are the Weekly Pivots. The Red lines that are roughly 1319-1321 should be considered a ZONE. The Yellow lines also should be considered a potential zone of Fib Clusters around the 1331-1332ish area.
I've left the Green Andrew's Pitchfork that I drew in last week ... as price, after it broke below the lower line, has ridden up against it to some extent. The Volume at Price is displayed on the right vertical in Blue. Hope this is helpful to some as a MAP!
Click image for original size
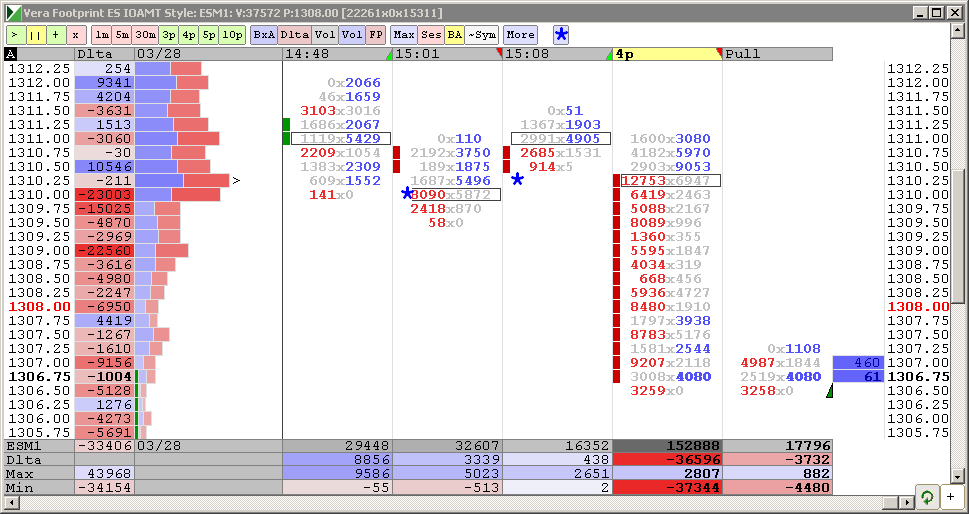
I'm curious how the Footprint would have either made somebody hold the trade longer on the short side or have them flip to get long..down here
Looking at my 5 tic reversal bar I can see lower volume on the test down but delta was more negative compared to the last bar...seems to conflict...would have prefered to see higher volume and lower delta etc...to hold that
but then again I am a DELTA newbie...and proud of it!! LOL!
Looking at my 5 tic reversal bar I can see lower volume on the test down but delta was more negative compared to the last bar...seems to conflict...would have prefered to see higher volume and lower delta etc...to hold that
but then again I am a DELTA newbie...and proud of it!! LOL!
Something you gotta take into consideration Bruce when using Delta, CD or footprint based. Delta represents only MARKET orders. It doesn't represent ALL volume.
Originally posted by BruceM
I'm curious how the Footprint would have either made somebody hold the trade longer on the short side or have them flip to get long..down here
Looking at my 5 tic reversal bar I can see lower volume on the test down but delta was more negative compared to the last bar...seems to conflict...would have prefered to see higher volume and lower delta etc...to hold that
but then again I am a DELTA newbie...and proud of it!! LOL!
I thought it was all transacted orders, like Time & Sales. How would they know what kind of order was sent to a broker?
Originally posted by Lorn
Something you gotta take into consideration Bruce when using Delta, CD or footprint based. Delta represents only MARKET orders. It doesn't represent ALL volume.
Originally posted by BruceM
I'm curious how the Footprint would have either made somebody hold the trade longer on the short side or have them flip to get long..down here
Looking at my 5 tic reversal bar I can see lower volume on the test down but delta was more negative compared to the last bar...seems to conflict...would have prefered to see higher volume and lower delta etc...to hold that
but then again I am a DELTA newbie...and proud of it!! LOL!
No its not like time and sale. It is purely orders entered at market. How they know? I'm not sure. I think CME has been marking trades with this kind of data for some time.
Yes, thanks Lorn...I guess I'm always looking to see things as they happen, or that repetitive pattern over time...
so right now I see all these orders that went off at the bid at 1310 - 1310.25...it's the peak volume price of the day now.....even overtook that 12.50 but this is based on repeated visits that price....
so if price rallies...the MD people would say "Hey , all those sell orders couldn't break down price so we rallied"
and if we decline they will say .." wow, look at all those sell orders...of course we dropped lower"
my statements are not directed at anyone in our forum...I'm just searching for ways to use this MD thing that is somewhat consistent ....if it even has any value...tons of youtube videos but that also is after the fact.....
I do like it for seeing the buildup of volume but I can see that on my Volume MP charts...the histogram shows that..
just babbling now...
big volume and big negative delta should lead down to the 06 - 07.50...but what can I do ..? sell at market.....no thanks...
Now I sound like a youtube video...LOL!
Now I sound like a youtube video...LOL!
Bruce, you could have sold @ market :) Another youtube channel from me :)
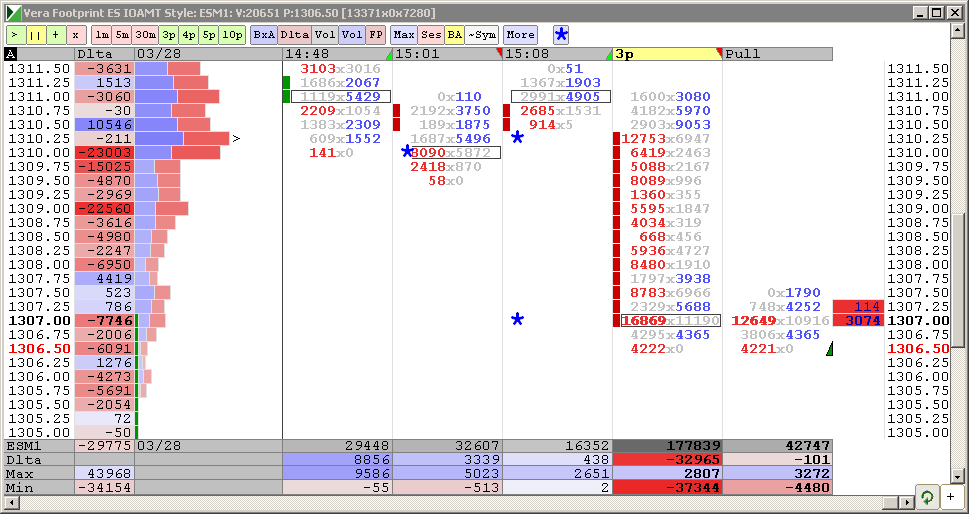
I moved the second blue marker to the left as not to obstract the figure
Click image for original size
Click image for original size
There is a certain aspect of delta in showing what the chasers are doing...imo.
That's why I prefer to look at delta on a cumulative basis in bar form so that I can see where the previous levels (pivots) came in relation to price. I use those levels (pivots) of CD as a way of marking where traders initiated there buying or selling. So it becomes a further area of support/resistance to use along with price action support/resistance.
Now combining that with your way of looking at volume Bruce I think is another step forward. The 1 min nodes of volume you follow, if they come in relation to a CD level of initiated buying/selling could give added weight to that levels effective support/resistance.
Ok. My brain hurts now.
Originally posted by BruceM
Yes, thanks Lorn...I guess I'm always looking to see things as they happen, or that repetitive pattern over time...
so right now I see all these orders that went off at the bid at 1310 - 1310.25...it's the peak volume price of the day now.....even overtook that 12.50 but this is based on repeated visits that price....
so if price rallies...the MD people would say "Hey , all those sell orders couldn't break down price so we rallied"
and if we decline they will say .." wow, look at all those sell orders...of course we dropped lower"
my statements are not directed at anyone in our forum...I'm just searching for ways to use this MD thing that is somewhat consistent ....if it even has any value...tons of youtube videos but that also is after the fact.....
I do like it for seeing the buildup of volume but I can see that on my Volume MP charts...the histogram shows that..
just babbling now...
I agree Lorn..a potentially very powerful combination
Originally posted by Lorn
There is a certain aspect of delta in showing what the chasers are doing...imo.
That's why I prefer to look at delta on a cumulative basis in bar form so that I can see where the previous levels (pivots) came in relation to price. I use those levels (pivots) of CD as a way of marking where traders initiated there buying or selling. So it becomes a further area of support/resistance to use along with price action support/resistance.
Now combining that with your way of looking at volume Bruce I think is another step forward. The 1 min nodes of volume you follow, if they come in relation to a CD level of initiated buying/selling could give added weight to that levels effective support/resistance.
Ok. My brain hurts now.
Originally posted by BruceM
Yes, thanks Lorn...I guess I'm always looking to see things as they happen, or that repetitive pattern over time...
so right now I see all these orders that went off at the bid at 1310 - 1310.25...it's the peak volume price of the day now.....even overtook that 12.50 but this is based on repeated visits that price....
so if price rallies...the MD people would say "Hey , all those sell orders couldn't break down price so we rallied"
and if we decline they will say .." wow, look at all those sell orders...of course we dropped lower"
my statements are not directed at anyone in our forum...I'm just searching for ways to use this MD thing that is somewhat consistent ....if it even has any value...tons of youtube videos but that also is after the fact.....
I do like it for seeing the buildup of volume but I can see that on my Volume MP charts...the histogram shows that..
just babbling now...
Emini Day Trading /
Daily Notes /
Forecast /
Economic Events /
Search /
Terms and Conditions /
Disclaimer /
Books /
Online Books /
Site Map /
Contact /
Privacy Policy /
Links /
About /
Day Trading Forum /
Investment Calculators /
Pivot Point Calculator /
Market Profile Generator /
Fibonacci Calculator /
Mailing List /
Advertise Here /
Articles /
Financial Terms /
Brokers /
Software /
Holidays /
Stock Split Calendar /
Mortgage Calculator /
Donate
Copyright © 2004-2023, MyPivots. All rights reserved.
Copyright © 2004-2023, MyPivots. All rights reserved.