ES Short Term Trading for 4-20-2011
here's a look at a profile chart this morning. We have a huge opening gap up this morning and it has left some single prints down at the 22.50 to 21.25 range. I am thinking to go short just after the open around the O/N highs of 28.50 to 1320.75 which is the bottom of the value range today.
Click image for original size
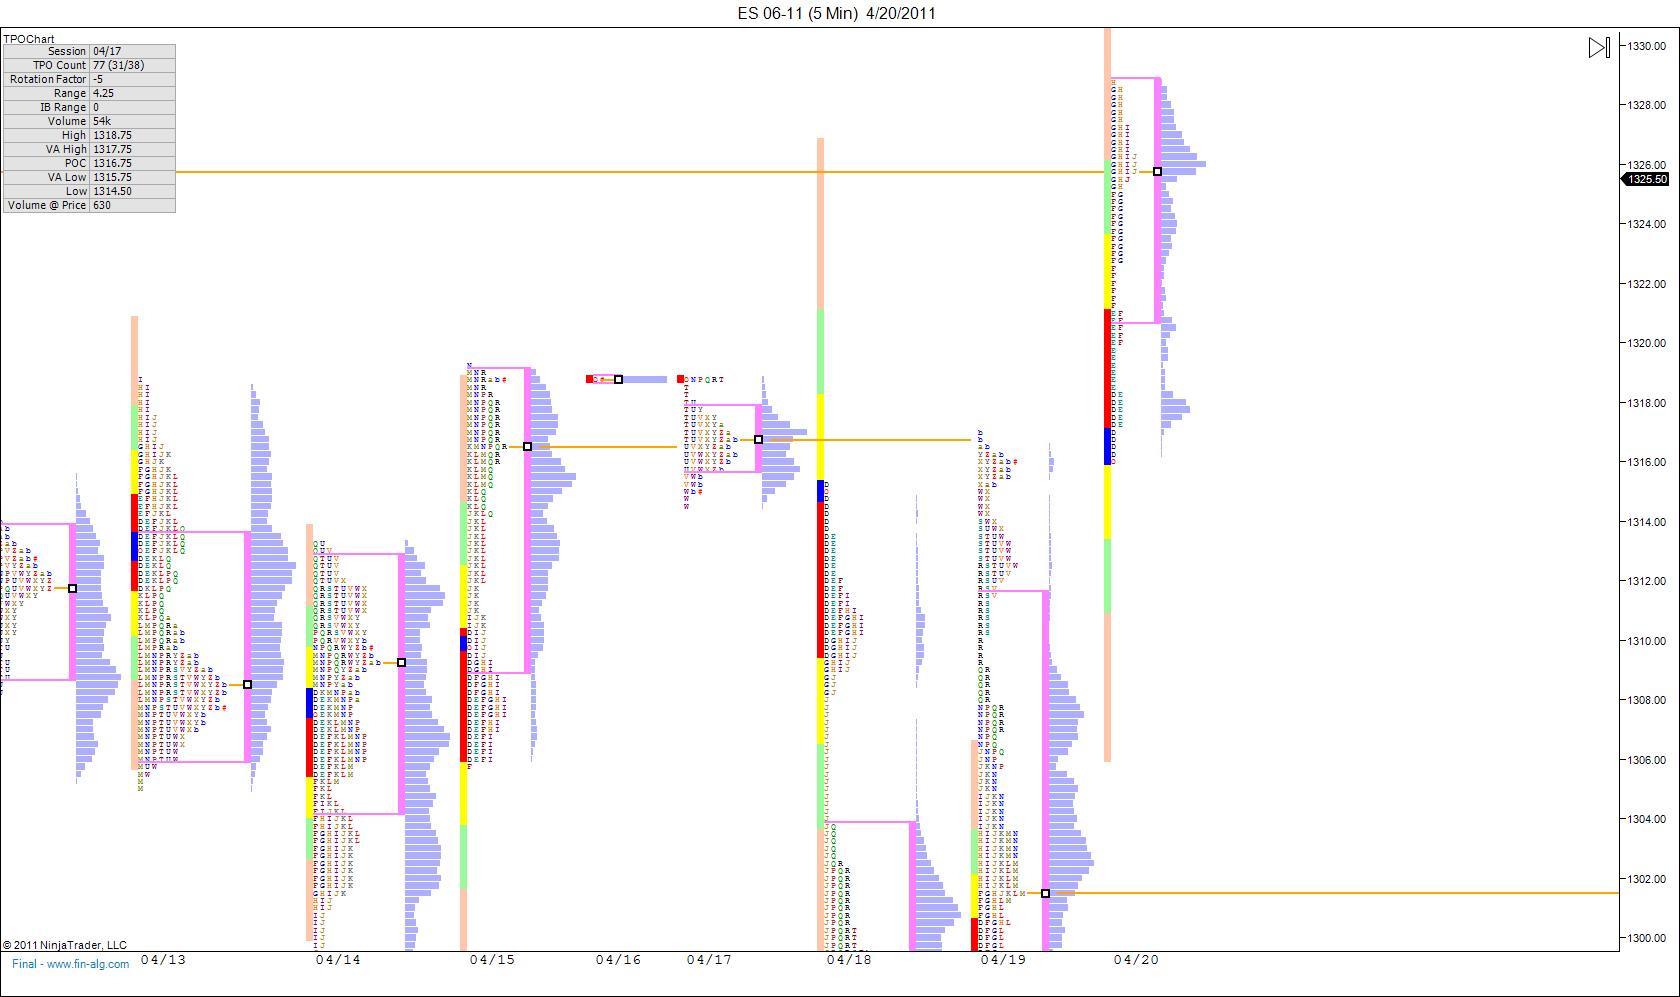
nice examples today....so far failure to sustain trade outside O/N highs........if they can get above hour highs then the breakout traders will TRY and push for 1332 that is next volume point........hoping that isn't the plan....I still like the 1320 target and would like to see the market start breaking down below the HIghs of the opening range
fwiw, i have the 33-33.5 area as the next significant projected area above the current high, so pretty close to bruce's 32 volume point...25-25.5, then 22.5 and finally 20 are the buying spots i would keep an eye on if we start to break down
that first buying spot worked well for a quick scalp...taking a break here...good luck
Originally posted by apk781
fwiw, i have the 33-33.5 area as the next significant projected area above the current high, so pretty close to bruce's 32 volume point...25-25.5, then 22.5 and finally 20 are the buying spots i would keep an eye on if we start to break down
sold one more time into the O/N high....but will watch hour high break if it comes...
ad line at plus 2k and volume leading almost 7 to 1 up volume...I keep wondering how much power is left to keep lifting this higher ..hopefully not much.
Looking for market to spend some time back at 1326 again and hopefully soon
Once again $ticks are diverging from yesterdays high values...
ad line at plus 2k and volume leading almost 7 to 1 up volume...I keep wondering how much power is left to keep lifting this higher ..hopefully not much.
Looking for market to spend some time back at 1326 again and hopefully soon
Once again $ticks are diverging from yesterdays high values...
Here is a look at that O/N high the dotted line. Below you can see yesterday's RTH high by the green dashed line.
Click image for original size

trying to hold three now that we hit the OR high. You will note that the biggest one minute volume bar was the first bar of the RTH session......no other volume came close and they couldn't generate volume above the O/N highs.......so we returned to where the volume was......
I beleive mean reversion trading requires a major paridigm shft in ones thinking....this is stil a tough trade to hold as are still inside the Hour range
I beleive mean reversion trading requires a major paridigm shft in ones thinking....this is stil a tough trade to hold as are still inside the Hour range
at one point the peak volume price was up near 27.50 because price spent time there going back and forth over that area...now it has shifted down to 1325......in theory good for shorts.....in theory...!!
took one more off at the 23.75 print....it is still key support number and the OR low!!
Thought this was worthwhile sharing. Was reading some Dr. Brett over lunch and came across a post of what to do between trades. This comment on what he does is superb..
I stay engaged by watching unfolding sentiment (NYSE TICK, Market Delta), seeing how price and volume behave at the edges of market ranges, and by seeing how markets correlated to my own are behaving.
What is happening at the EDGES of RANGES is a massive statement.
I stay engaged by watching unfolding sentiment (NYSE TICK, Market Delta), seeing how price and volume behave at the edges of market ranges, and by seeing how markets correlated to my own are behaving.
What is happening at the EDGES of RANGES is a massive statement.
Interesting formation here...we have a low volume price still at 25.75 and then we have a peak volume price at 27.50 and the real peak volume at 25 even.....They will need to move it away from this cluster otherwise we will just end up eventually with a big giant Bell shaped curve.....the classic consolidation day. That would be a bit odd with that huge gap opening...so I'm expecting a good move and hopefully down soon
My stop on last two is at 28 even...still stuck in hour range so that needs to resolve and I'm not convinced that the shorts will win yet today.....
My stop on last two is at 28 even...still stuck in hour range so that needs to resolve and I'm not convinced that the shorts will win yet today.....
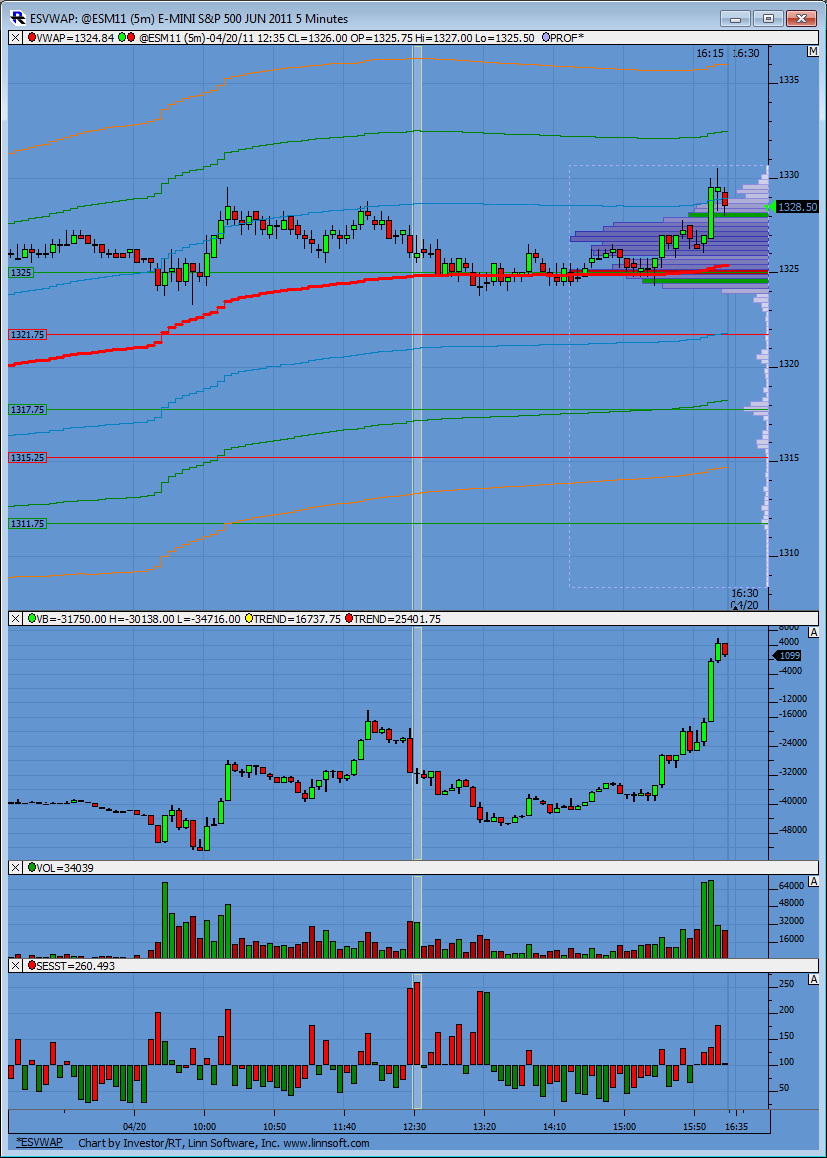
Here is the end of day chart to study. I've added a new pane at the bottom of relative volume. The bars compare volume to that specific time frame over 200 days of trading to give a relative percent reading compared to the normal (average) volume of that period. So for instance, the two big red bars at 12:25 and 12:30 were saying the volume at those time stamps was 250% greater in relative strength then the average over the last 200 days.
Not sure if it helps any. I'm just experimenting with it.
Not sure if it helps any. I'm just experimenting with it.
Click image for original size
Emini Day Trading /
Daily Notes /
Forecast /
Economic Events /
Search /
Terms and Conditions /
Disclaimer /
Books /
Online Books /
Site Map /
Contact /
Privacy Policy /
Links /
About /
Day Trading Forum /
Investment Calculators /
Pivot Point Calculator /
Market Profile Generator /
Fibonacci Calculator /
Mailing List /
Advertise Here /
Articles /
Financial Terms /
Brokers /
Software /
Holidays /
Stock Split Calendar /
Mortgage Calculator /
Donate
Copyright © 2004-2023, MyPivots. All rights reserved.
Copyright © 2004-2023, MyPivots. All rights reserved.