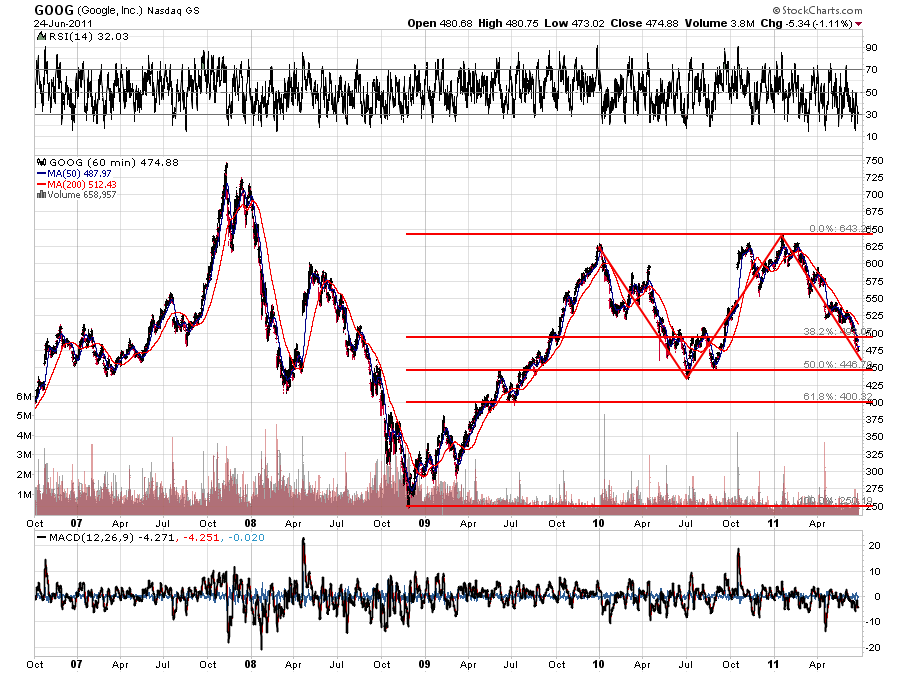
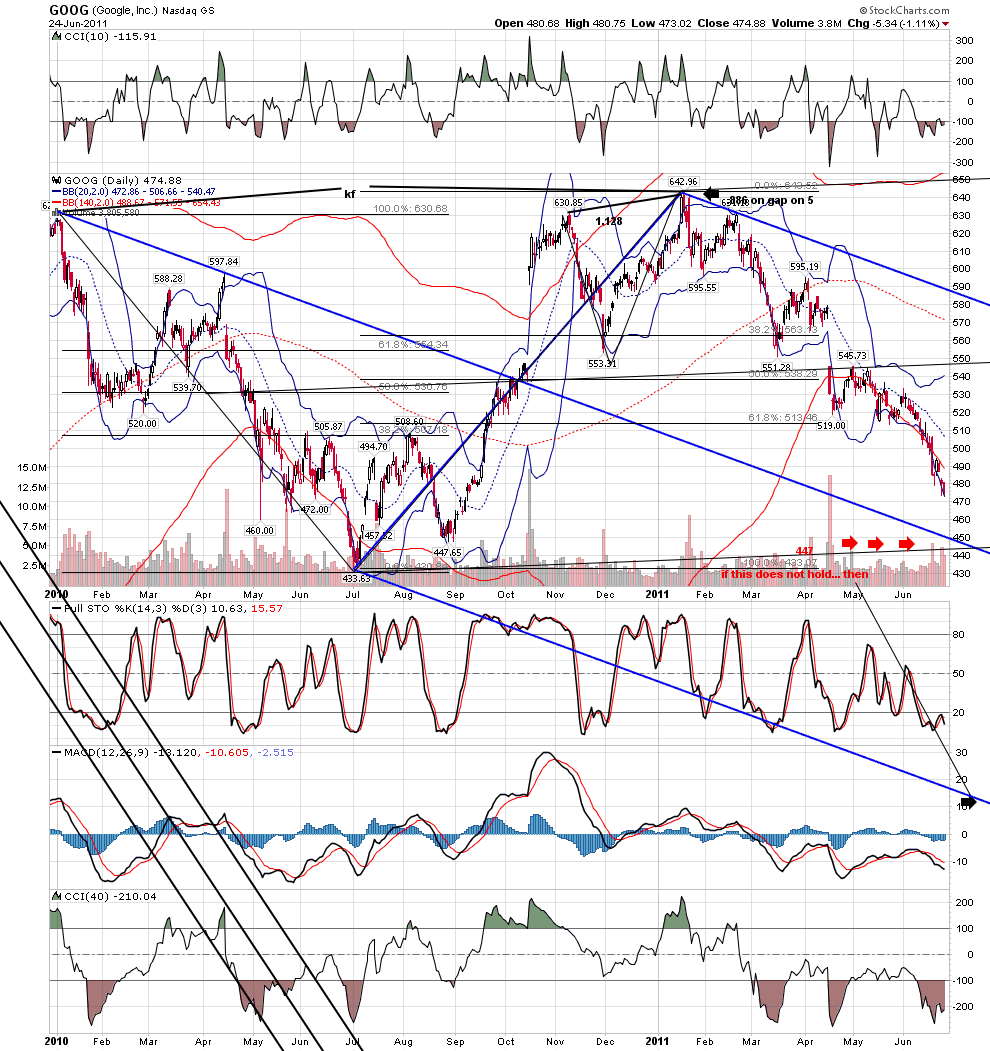
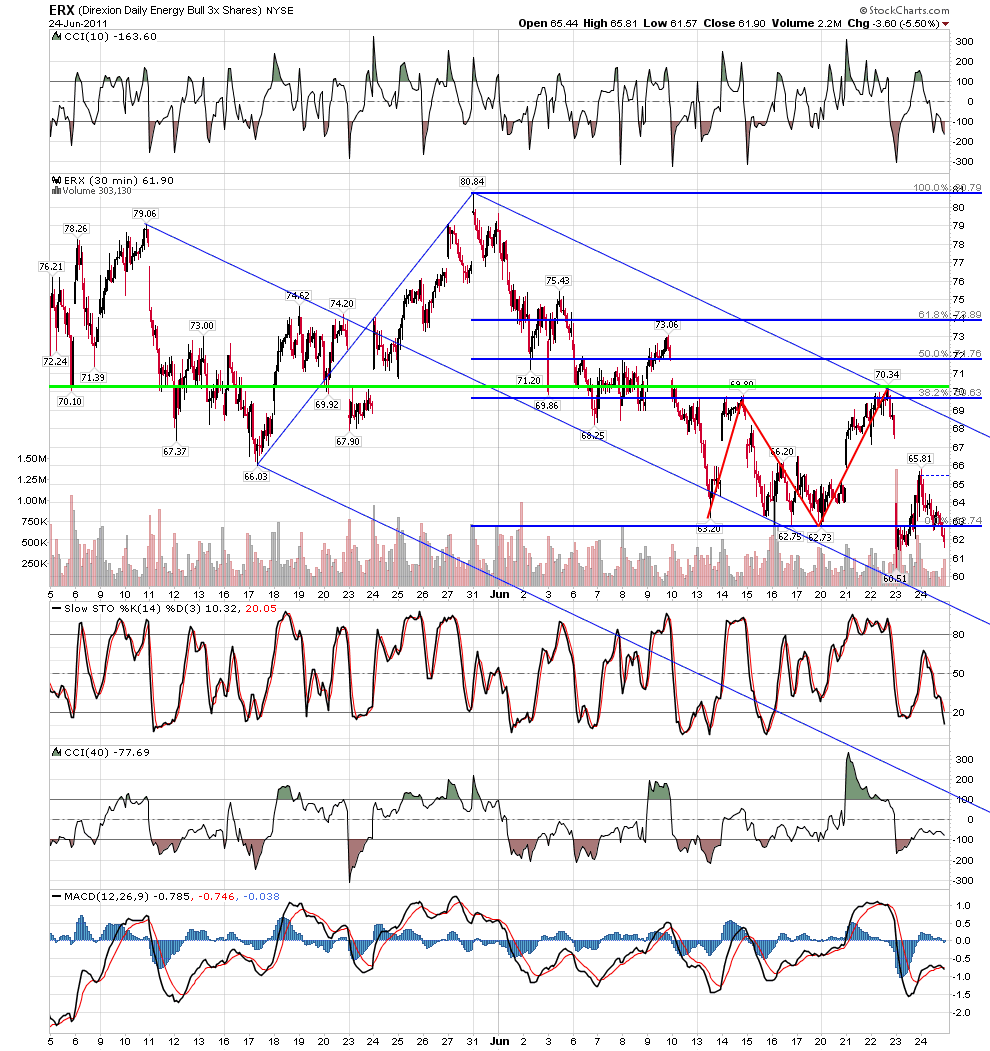
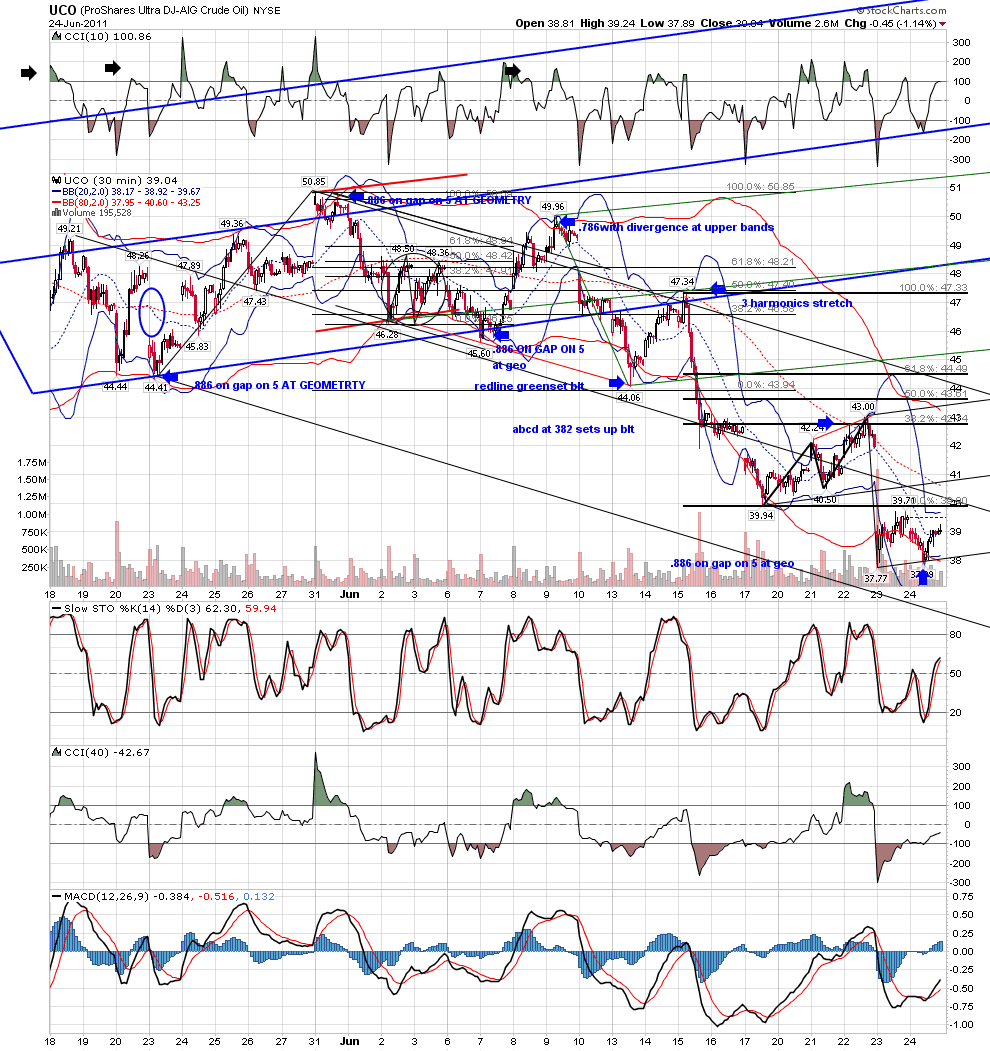
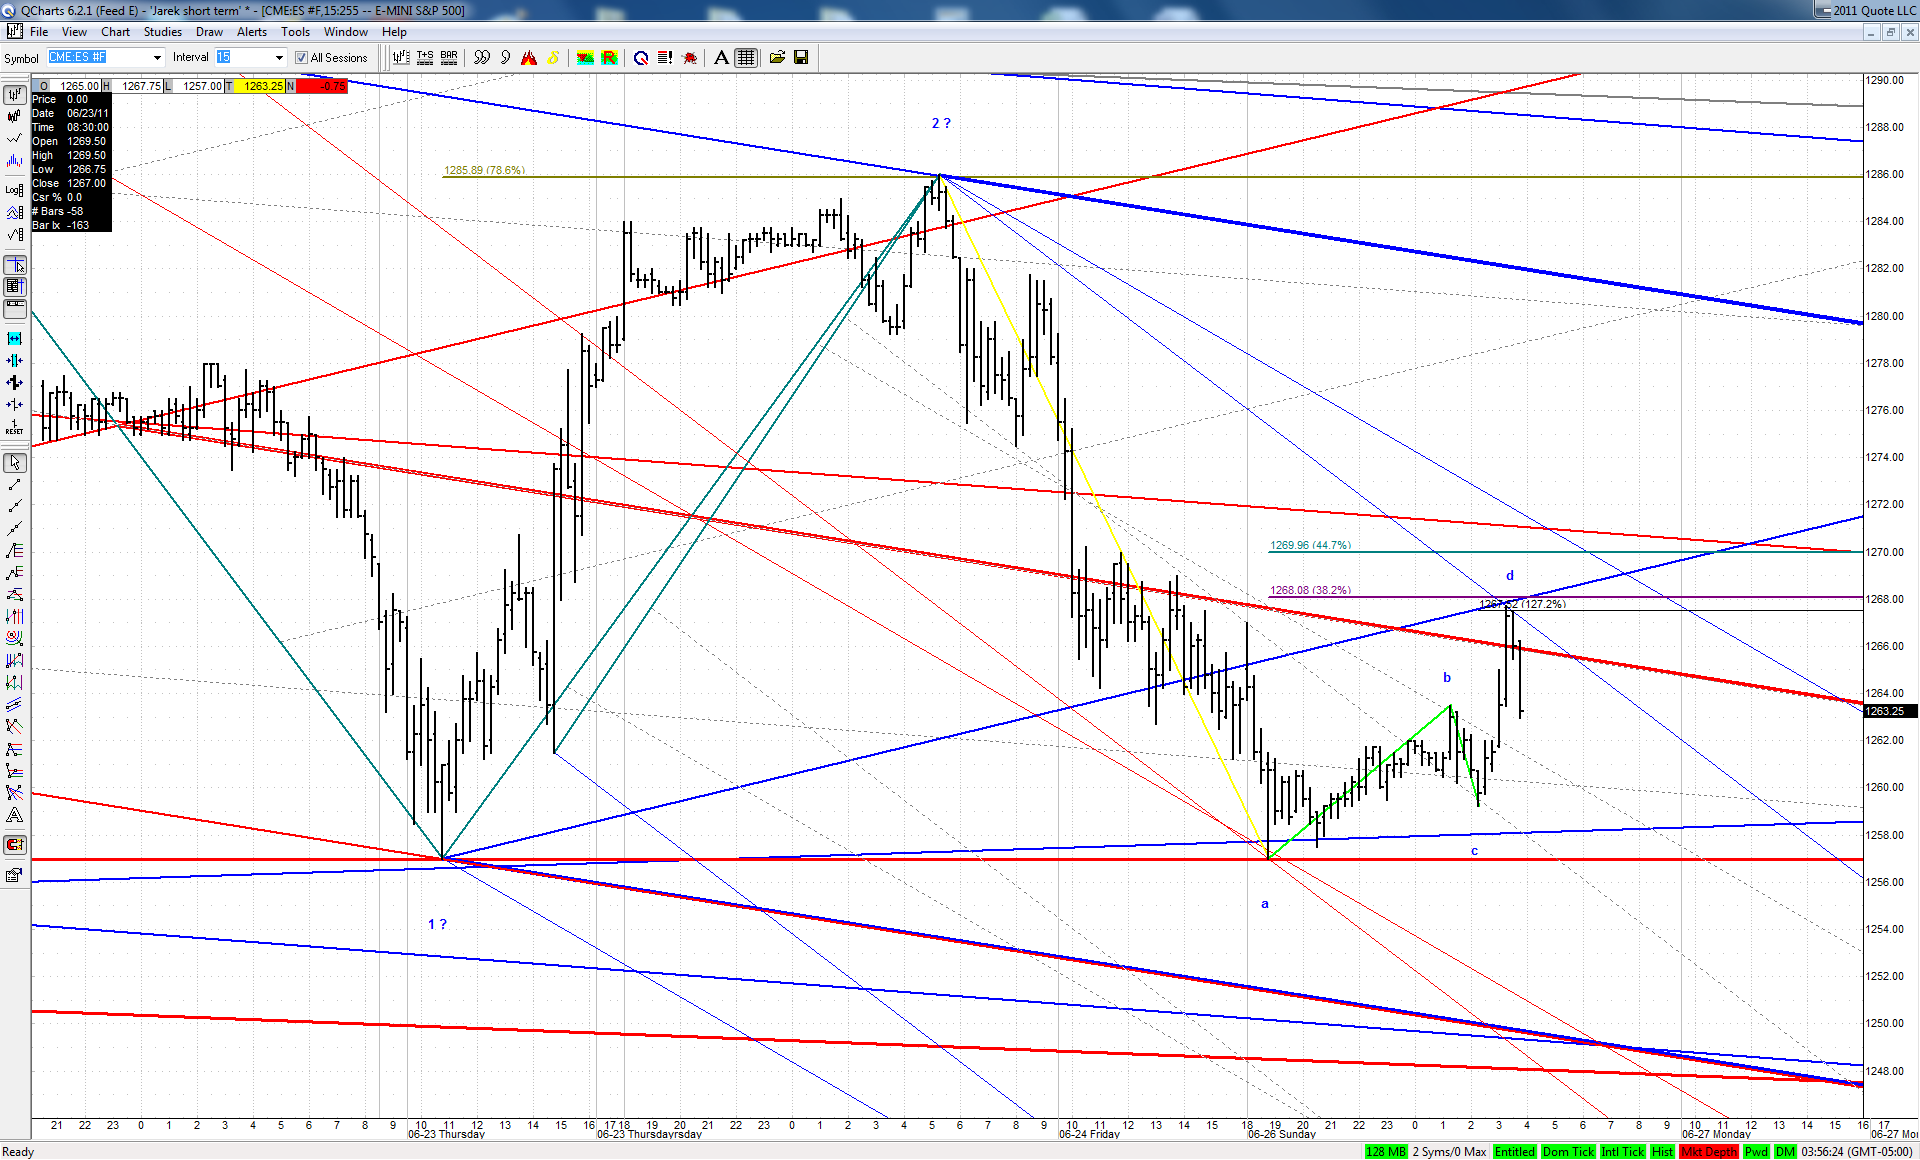
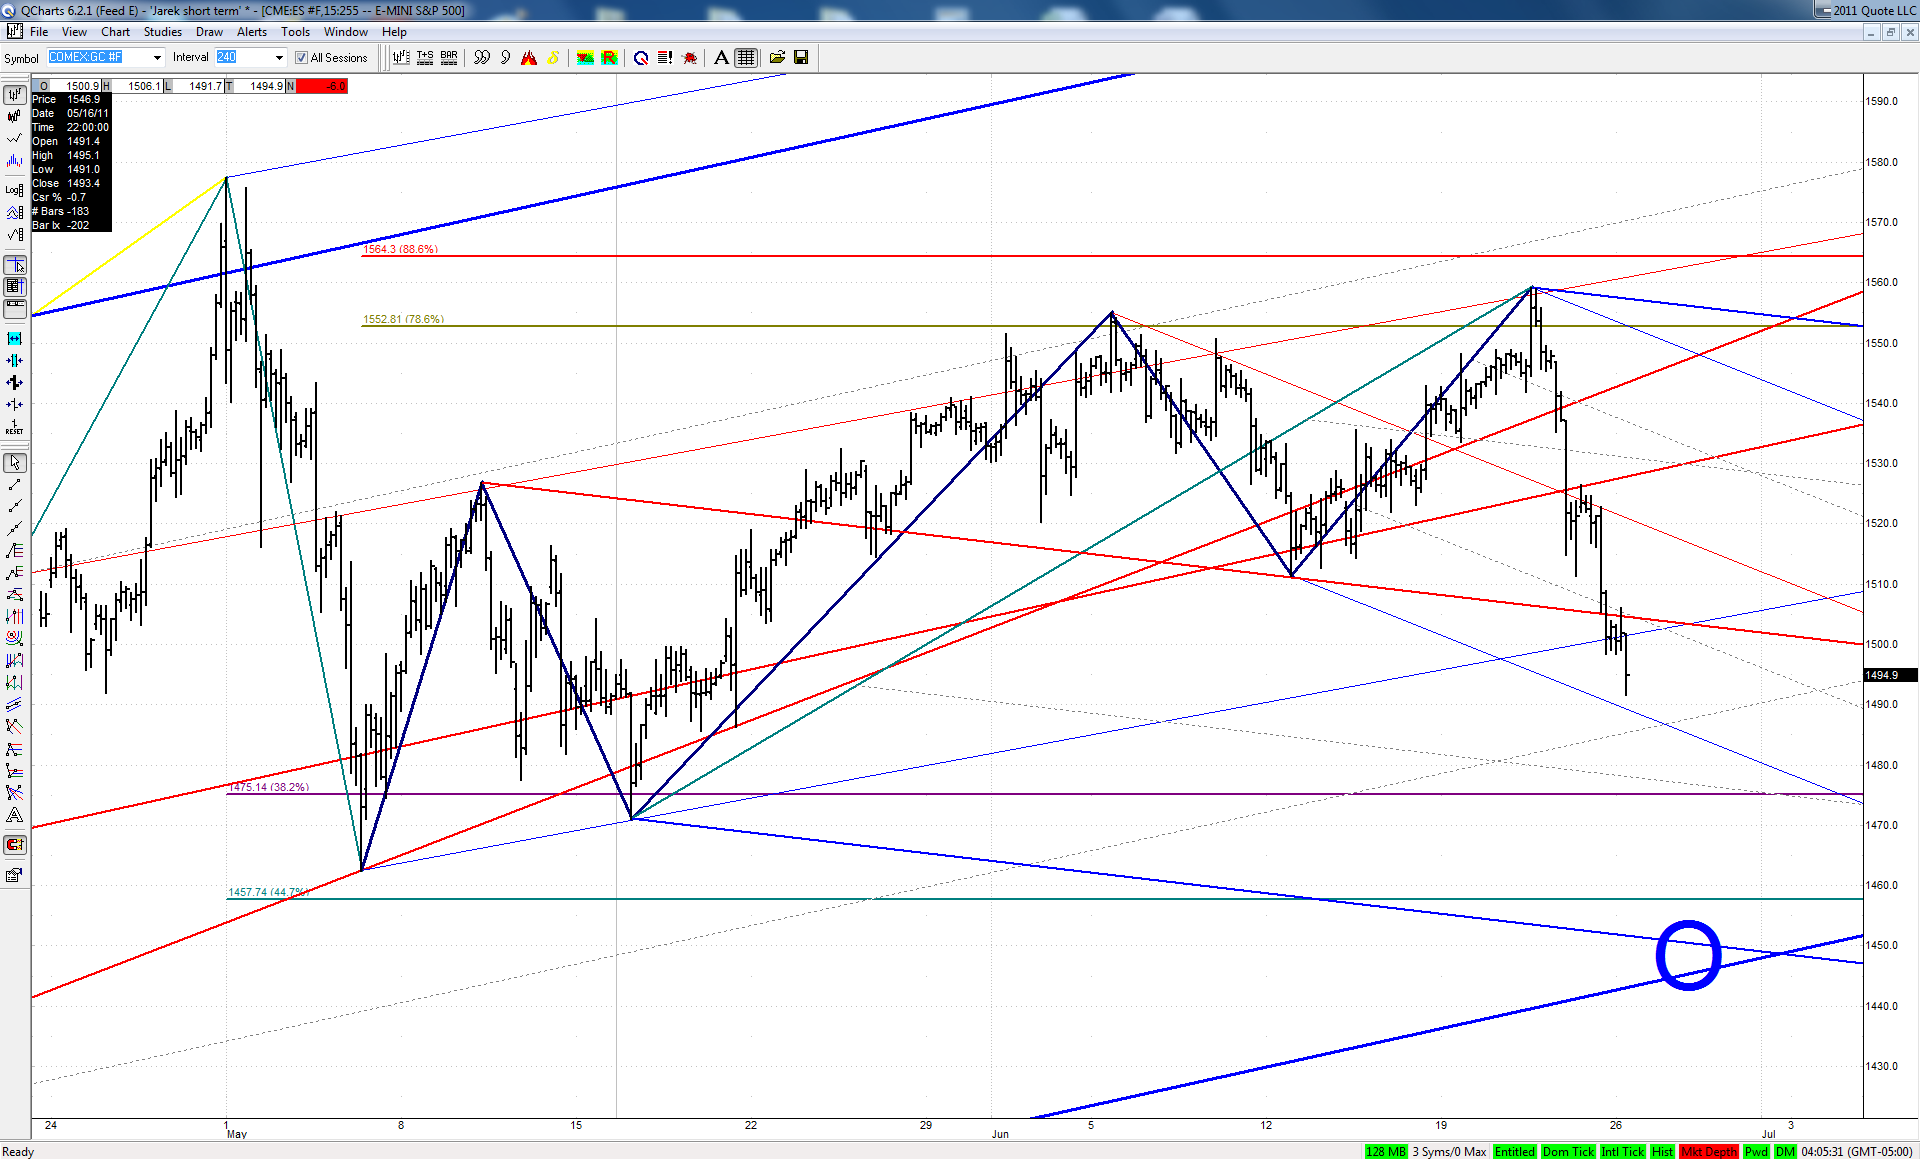
i do not know how things will play out.. but the 447 level in GOOG seems incredibly important....i know this too.. the last 3 days i knocked the cover off the ball with my tools..on the short term..but i am aware...''' as an important turn approaches, the tools work better and better on smaller time frames.. traders become mesmerized by their success and miss the big turn..''
Click image for original size
Click image for original size
RO
roofer
Rep: 3,689
Posts: 3,574
2
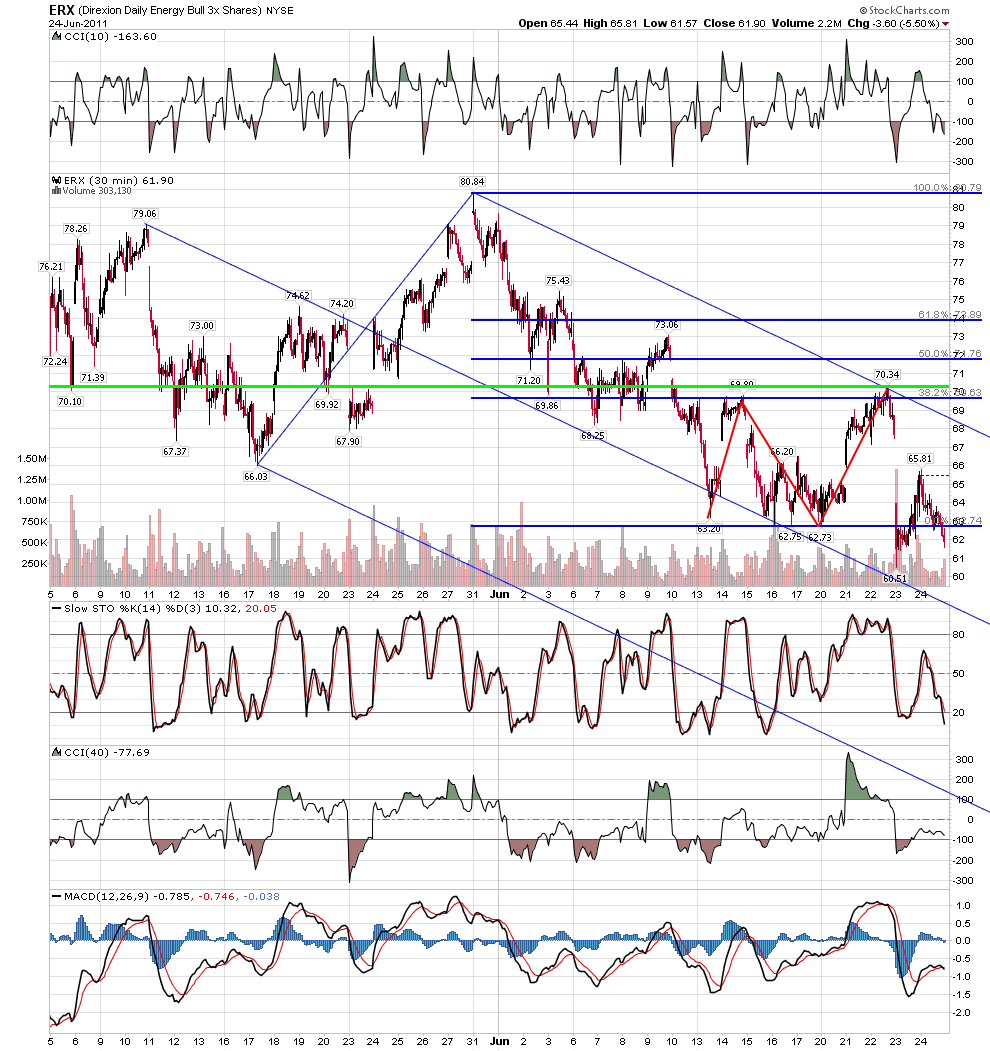
the play pen.... predefined trade setups at the geometry...
Click image for original size
Click image for original size
Click image for original size
JI
jimkane
Rep: 3,058
Posts: 33,089
2
For those following Bill Gross's shorting of treasuries, skim down this article for the few paragraphs on that. The entire article is worth reading, too, for those that are interested.
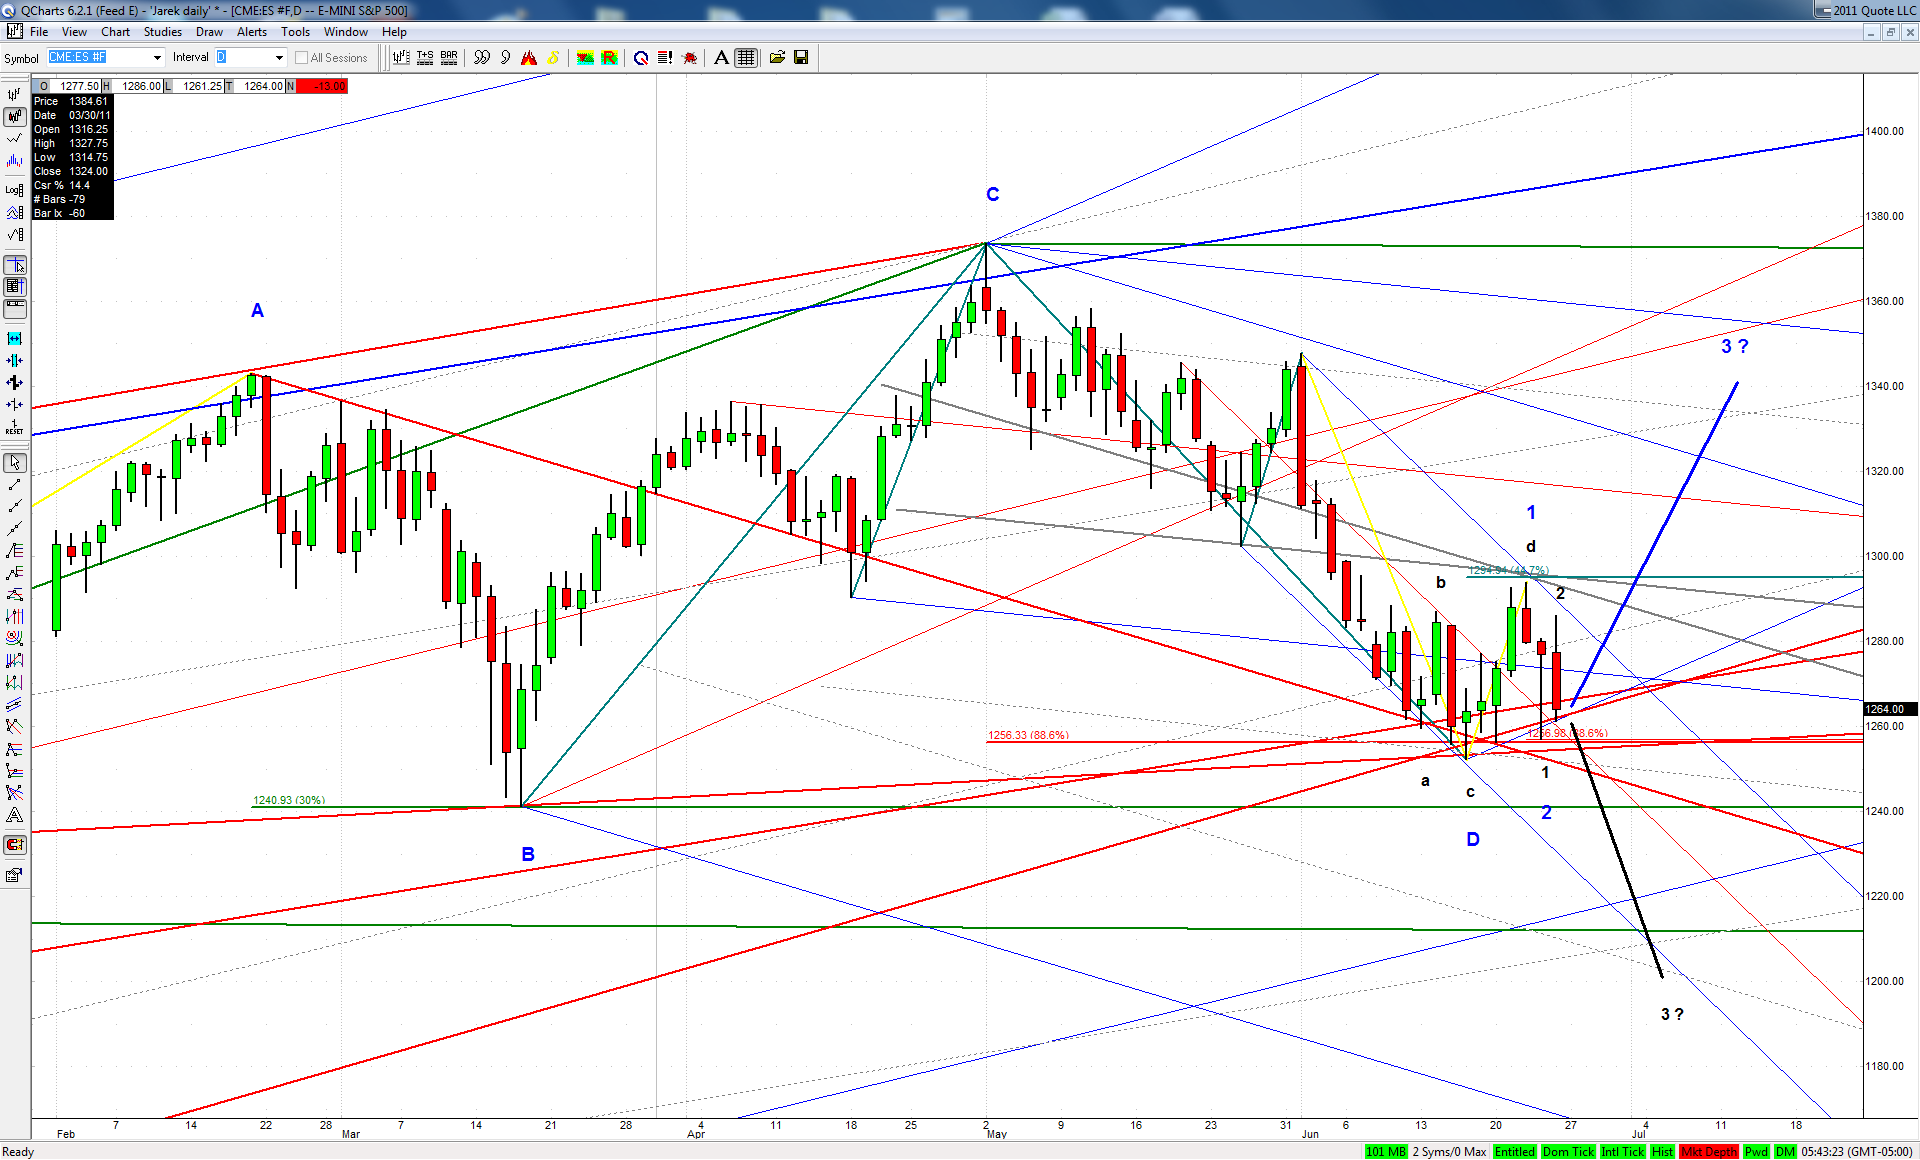
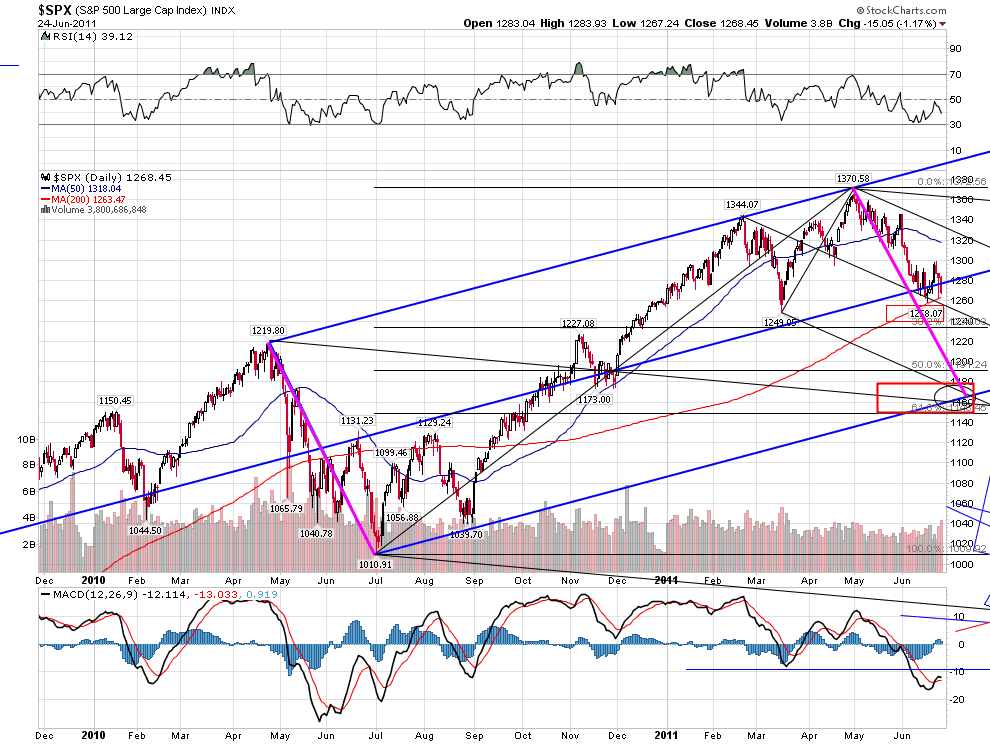
Recall that area I mentioned around 1160? roofer had an area that equated to around 1140 I think it was, converted from his SPY chart. Anyway, I have this incredible timing factor that comes in with that around the middle to end of the first full trading week of July (July 1 is a Friday, I mean the week after), perhaps July 6-8. This would require a 'plunge' of perhaps 100 points in 8-10 trading days. It's totally doable, but quite 'extreme'.
I think it could only happen with a bit of 'panic' on some news, like trouble in Greece or a big OPEC retaliation and oil spike for O'bummer's coordinated oil release (although typically right now commodities are moving with the market). So, I'm not thinking this scenario is likely, but if they do forsake this triple TL/March low/200-dma spot, it might drop precipitously to this area. It's just something I wanted to mention as a possibility I am keeping an eye on. It also may just move to the area a little later, not hitting the timing factor perfectly. Notice how the area is hardly that far below what jarek showed on his chart as the start of a potential 'W3'. It isn't really that big of a move.
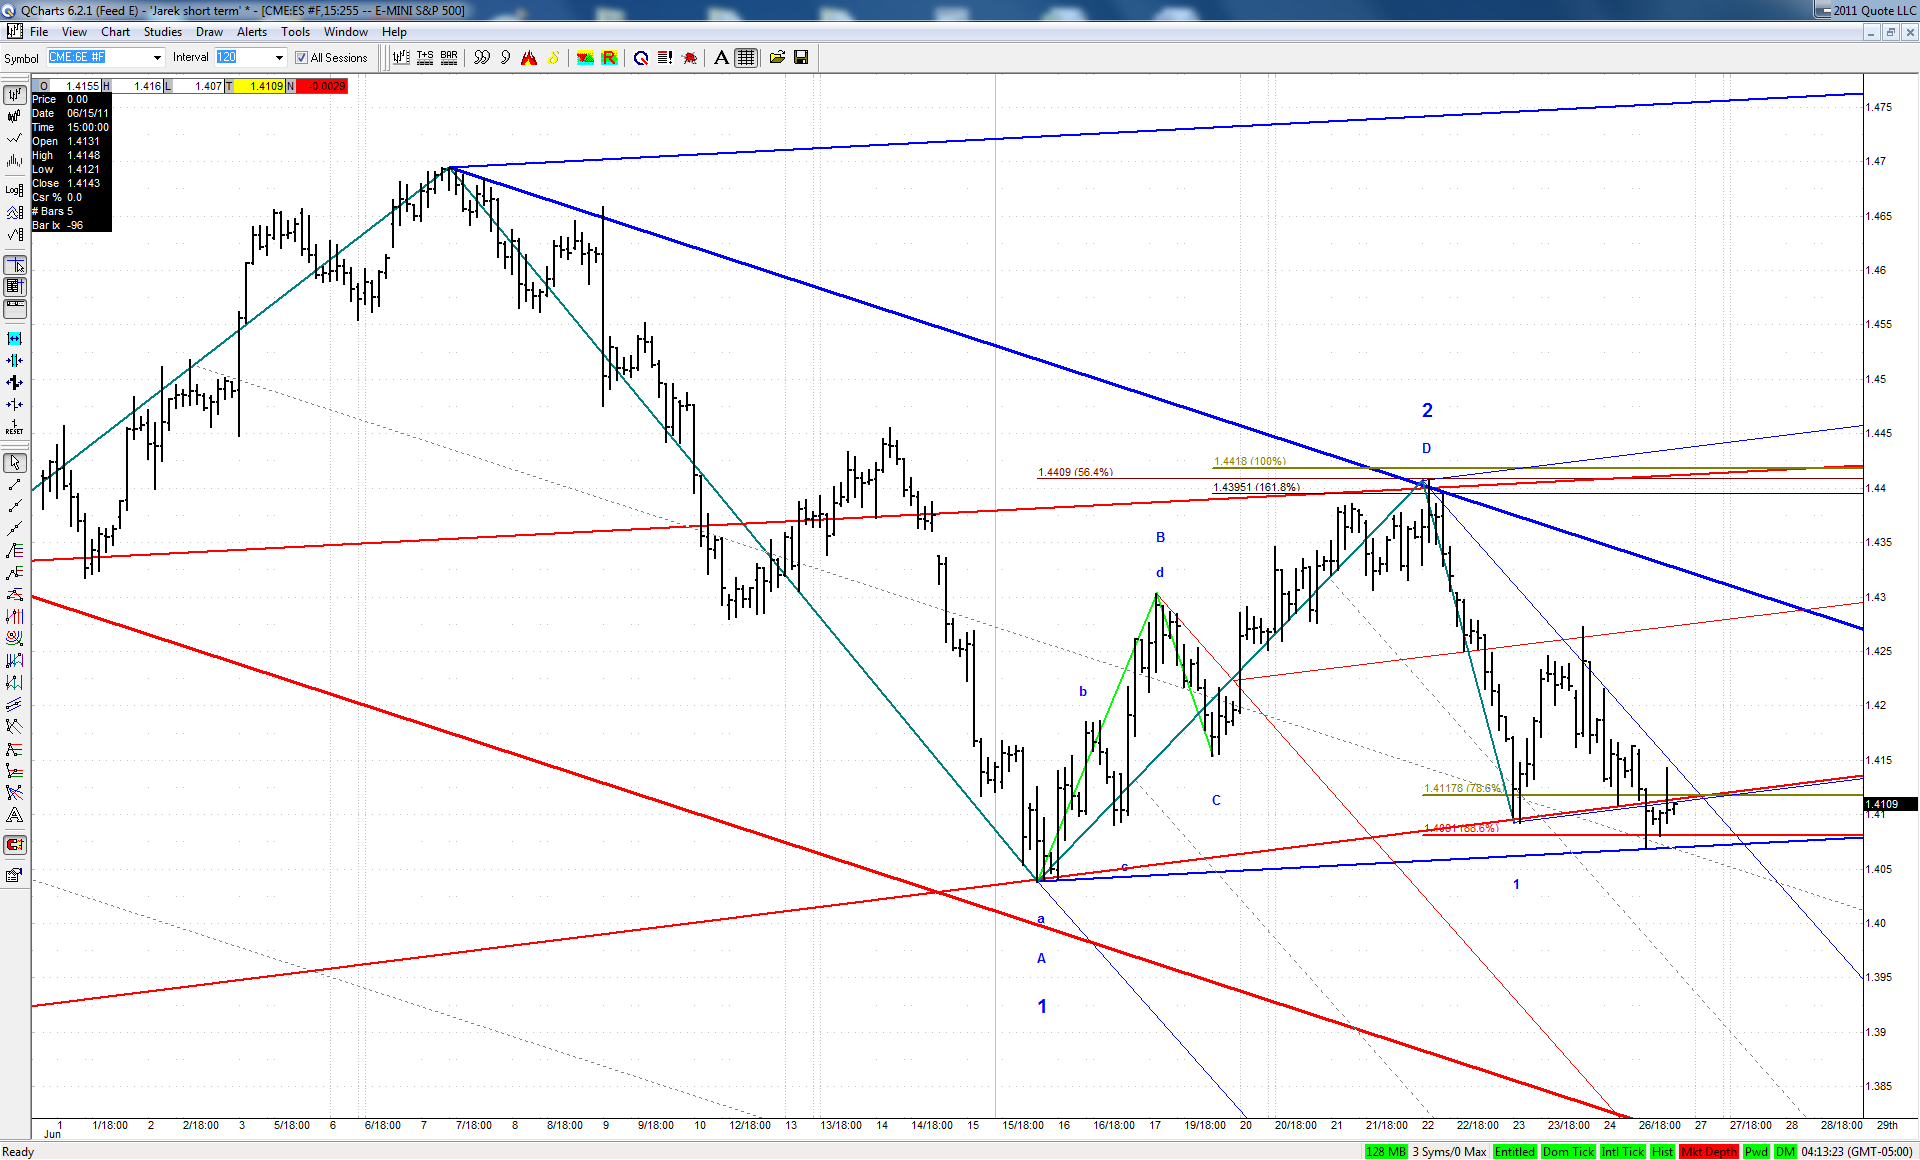
On another note, I just updated my higher timeframe Euro charts, and there are a few really notable areas down lower, in the mid 1.35's to mid-1.37's (the obvious ABCD), around 1.30-.31, and 1.24-.25, and then the spot I really like, around 1.14. Point is, this would line up well with the ES moving down to 1160. We'll see. Maybe it goes straight up from here. I just know where I'm looking, on both sides.
RO
roofer
Rep: 3,689
Posts: 3,574
5
chart jims spoke of
Click image for original size
JI
jimkane
Rep: 3,058
Posts: 33,089
2
(Edited )
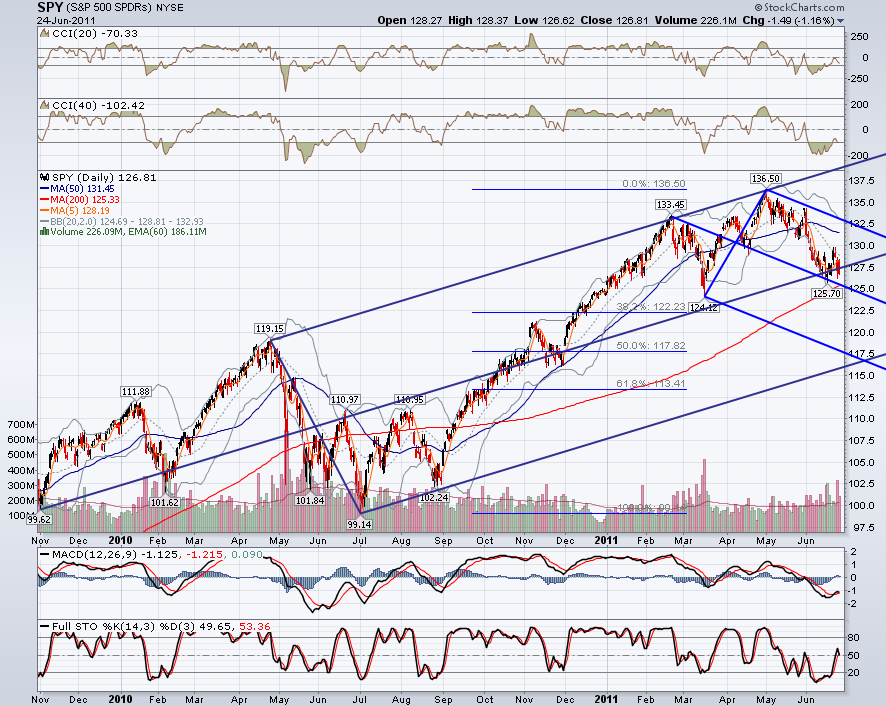
And I just did an updated conversion (9.97 to 1 is the current ratio), and my area is roughly equivalent to SPY 116. Look at roofer's chart above. 116 is his updated area. I'd say that's the most likely scenario we have now, that it 'wants' that spot. Notice his time factor is consistent with mine, which is no surprise, as a good part of my timing comes from similar sets/lines.
RA
rat89
Rep: 0
Posts: 7,015
3
and here it is on spy
Click image for original size
JA
jarek
Rep: 94
Posts: 3,474
3
(Edited )
The lure of a double bottom sucked in many already, but we know where to look if this is a real W3 down:
Click image for original size
JA
jarek
Rep: 94
Posts: 3,474
4
Gold behaves like the May-June rise was an ending diagonal within a failed W5 up. The immediate downside target would be well defined in such case:
Click image for original size
JA
jarek
Rep: 94
Posts: 3,474
2
Originally posted by jarek
...After such straight shot off the bearish ABCD to the Game Zone, probability favors the failure of an ABCD. If this one plays out regardless, it would be a sign of the underlying weakness in EUR.
Bulls in EUR still fighting to deny the following scenario: